Clinical Trial
. 2023 Apr 3;22(4):421-434.
doi: 10.1158/1535-7163.MCT-22-0401.

SGN-CD228A Is an Investigational CD228-Directed Antibody-Drug Conjugate with Potent Antitumor Activity across a Wide Spectrum of Preclinical Solid Tumor Models

Affiliations
Clinical Trial

SGN-CD228A Is an Investigational CD228-Directed Antibody-Drug Conjugate with Potent Antitumor Activity across a Wide Spectrum of Preclinical Solid Tumor Models

Rebecca Mazahreh et al. Mol Cancer Ther. .

Abstract

SGN-CD228A is an investigational antibody-drug conjugate (ADC) directed to melanotransferrin (CD228, MELTF, MFI2, p97), a cell-surface protein first identified in melanoma. SGN-CD228A consists of a humanized antibody, hL49, with high specificity and affinity for CD228 that is stably conjugated to 8 molecules of the clinically validated microtubule-disrupting agent monomethyl auristatin E (MMAE) via a novel glucuronide linker. We performed comprehensive IHC studies, which corroborated published RNA sequencing data and confirmed low CD228 expression in normal tissues and high expression in several cancers, including melanoma, squamous non-small cell lung cancer (NSCLC), triple-negative breast cancer (TNBC), colorectal cancer, and pancreatic cancer. SGN-CD228A was efficiently internalized in various tumor cell types, and its cytotoxic activity was dependent on CD228 expression and internalization and intrinsic sensitivity to the MMAE payload. Compared with the valine-citrulline dipeptide linker, the novel glucuronide linker increased the cellular retention of MMAE in vitro and conferred improved antitumor activity against melanoma cell lines in vitro and in vivo. In addition, SGN-CD228A was active across melanoma, TNBC, and NSCLC cell line- and patient-derived xenograft models with heterogeneous antigen expression. In vivo, CD228 expression was important for response to SGN-CD228A but was not well correlated across all tumor types, suggesting that other factors associated with ADC activity are important. Overall, SGN-CD228A is a CD228-directed, investigational ADC that employs innovative technology and has compelling preclinical antitumor activity. SGN-CD228A is investigated in a Phase I clinical trial (NCT04042480) in patients with advanced solid tumors.


Figures

None
Graphical abstract
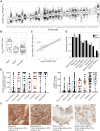
Figure 1. CD228 is expressed in solid tumors. A, CD228 RNA levels were obtained from TCGA. Abbreviations are defined in Supplementary Table S1. B, Log2-transformed FPKM values of CD228 RNA-seq data in TCGA-BRCA breast cancer subtypes. C, Correlation between CD228 RNA-seq (TPM) and publicly available (via CPTAC) CD228 MS values in matched TCGA-BRCA samples (Pearson correlation coefficient shown). D, Tumor microarrays (n > 49/tumor type) were stained for CD228 using commercial rabbit polyclonal antibody. The prevalence of CD228-positive samples by IHC was calculated as the number of samples with any CD228 staining relative to total samples tested in the TMA dataset for a particular tumor type. Prevalence of CD228 positivity by RNA was estimated from the TCGA dataset under the assumption of equal prevalence from both IHC and RNA in the melanoma samples. Using this assumption, we were able to calculate an RNA cutpoint in TCGA and apply it to the nonmelanoma TCGA cohorts. E, Full tumor sections were stained with a novel IHC-optimized anti-CD228 monoclonal antibody. CD228 positivity was assessed by a pathologist using both percent tumor cells staining and H-score metrics. F, Representative examples of the mean H-score staining in (E). Note that the RNA and MS data in this figure were extracted from the OmicSoft omics portal.
Figure 1.
CD228 is expressed in solid tumors. A, CD228 RNA levels were obtained from TCGA. Abbreviations are defined in Supplementary Table S1. B, Log2-transformed FPKM values of CD228 RNA-seq data in TCGA-BRCA breast cancer subtypes. C, Correlation between CD228 RNA-seq (TPM) and publicly available (via CPTAC) CD228 MS values in matched TCGA-BRCA samples (Pearson correlation coefficient shown). D, Tumor microarrays (n > 49/tumor type) were stained for CD228 using commercial rabbit polyclonal antibody. The prevalence of CD228-positive samples by IHC was calculated as the number of samples with any CD228 staining relative to total samples tested in the TMA dataset for a particular tumor type. Prevalence of CD228 positivity by RNA was estimated from the TCGA dataset under the assumption of equal prevalence from both IHC and RNA in the melanoma samples. Using this assumption, we were able to calculate an RNA cutpoint in TCGA and apply it to the nonmelanoma TCGA cohorts. E, Full tumor sections were stained with a novel IHC-optimized anti-CD228 monoclonal antibody. CD228 positivity was assessed by a pathologist using both percent tumor cells staining and H-score metrics. F, Representative examples of the mean H-score staining in (E). Note that the RNA and MS data in this figure were extracted from the OmicSoft omics portal.
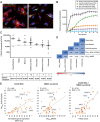
Figure 2. hL49 is a promising antibody backbone for ADCs directed to CD228-expressing cells. A, Structure of the mDPR-PEG12-gluc-MMAE drug-linker described in (16). B, Western blotting of CD228 CRISPR/CAS9-knockout cells (SK-MEL-5, SK-MEL-28), CD228-overexpressing cells (RPMI-7951) and corresponding control (C) cells. C, Viability of the cell lines in (B) incubated with increasing concentrations of mL49, cL49, or isotype control (hIgG1-ADC) ADCs for 96 hours. Results are representative of 3 experiments. D, Cytotoxicity assay performed as in (C). mAb1 (#271633; Santa Cruz); mAb2 (#893416; R&D), mAb3 (#363101; BioLegend). E, Sensorgram showing hL49 binding kinetics to serial CD228 concentrations (100–0.41 nmol/L) as determined by BLI. Global fit to a 1:1 Langmuir binding model was used to calculate the on-rate constant (kon), off-rate constant (koff) and KD values. Blue traces indicate processed data; red traces indicate fitted curves. Results are representative of 3 experiments.
Figure 2.
hL49 is a promising antibody backbone for ADCs directed to CD228-expressing cells. A, Structure of the mDPR-PEG12-gluc-MMAE drug-linker described in (16). B, Western blotting of CD228 CRISPR/CAS9-knockout cells (SK-MEL-5, SK-MEL-28), CD228-overexpressing cells (RPMI-7951) and corresponding control (C) cells. C, Viability of the cell lines in (B) incubated with increasing concentrations of mL49, cL49, or isotype control (hIgG1-ADC) ADCs for 96 hours. Results are representative of 3 experiments. D, Cytotoxicity assay performed as in (C). mAb1 (#271633; Santa Cruz); mAb2 (#893416; R&D), mAb3 (#363101; BioLegend). E, Sensorgram showing hL49 binding kinetics to serial CD228 concentrations (100–0.41 nmol/L) as determined by BLI. Global fit to a 1:1 Langmuir binding model was used to calculate the on-rate constant (kon), off-rate constant (koff) and KD values. Blue traces indicate processed data; red traces indicate fitted curves. Results are representative of 3 experiments.
Figure 3. SGN-CD228A is internalized by and has cytotoxic activity against panel of cancer cells with varying CD228 expression. A, A2058 cells were dosed with 2 μg/mL SGN-CD228A, incubated on ice for 30 minutes, and immediately fixed and permeabilized (0-hour time point) or incubated at 37°C for 4 hours. Cells were stained with anti-human antibody (red), LAMP-1 lysosome marker (green), and Hoechst (blue). B, Cells were incubated with hL49 conjugated to 8 copies of AF647 and 2 copies of the TQ5WS quencher, and images were collected. The amount of AF647 liberated from the antibody and quencher was quantified (total pixel intensity) and normalized to the number of cells/timepoint (Hoechst+). Values plotted represent average of 2 independent experiments using triplicates/condition. Error bars = SD. C, CD228 expression in cancer cell line panel. Dashed line indicates 15,000 copies. D, Pairwise correlation r values between CD228 expression and internalization and GR inhibition by SGN-CD228A and MMAE (GRAOC) in the cells in (C). E, Scatter plots showing the relationship between SGN-CD228A efficacy (GRAOC) and CD228 RNA expression (left), MMAE sensitivity (middle), or a linear model combining both variables (right). Coefficient of determination (R2), mean absolute error (MAE), and linear regression line are depicted. Examples of cell lines for which the model showed improvement are indicated.
Figure 3.
SGN-CD228A is internalized by and has cytotoxic activity against panel of cancer cells with varying CD228 expression. A, A2058 cells were dosed with 2 μg/mL SGN-CD228A, incubated on ice for 30 minutes, and immediately fixed and permeabilized (0-hour time point) or incubated at 37°C for 4 hours. Cells were stained with anti-human antibody (red), LAMP-1 lysosome marker (green), and Hoechst (blue). B, Cells were incubated with hL49 conjugated to 8 copies of AF647 and 2 copies of the TQ5WS quencher, and images were collected. The amount of AF647 liberated from the antibody and quencher was quantified (total pixel intensity) and normalized to the number of cells/timepoint (Hoechst+). Values plotted represent average of 2 independent experiments using triplicates/condition. Error bars = SD. C, CD228 expression in cancer cell line panel. Dashed line indicates 15,000 copies. D, Pairwise correlation r values between CD228 expression and internalization and GR inhibition by SGN-CD228A and MMAE (GRAOC) in the cells in (C). E, Scatter plots showing the relationship between SGN-CD228A efficacy (GRAOC) and CD228 RNA expression (left), MMAE sensitivity (middle), or a linear model combining both variables (right). Coefficient of determination (R2), mean absolute error (MAE), and linear regression line are depicted. Examples of cell lines for which the model showed improvement are indicated.
Figure 4. SGN-CD228A has in vivo antitumor activity in CDX mouse models across multiple doses and tumor types. A and B, Female athymic nude mice were subcutaneously implanted with 1.0×10⁶ Colo-853 cells (A) or 2.5×10⁶ A2058 cells (B). When tumors reached ∼100 mm3, n = 8 mice/group were administered single intraperitoneal injection of SGN-CD228A or hIgG1-ADC. C, %TGI by 1 mg/kg SGN-CD228A was calculated for 1–4 studies/CDX model, and CD228 receptor numbers were determined by qFACS. Dashed line represents average %TGI by 1 mg/kg hIgG1-ADC across all CDX studies. D, Treatment response to 1 and 3 mg/kg SGN-CD228A in the same CDX models was categorized based on the following criteria: CR = tumor < starting volume, PR = tumor < starting volume for 1+ days (but not the last day), and PD = tumor volume never regresses on any day. In total, n = 76 and n = 98 mice were included in the low-dose and high-dose group, respectively.
Figure 4.
SGN-CD228A has in vivo antitumor activity in CDX mouse models across multiple doses and tumor types. A and B, Female athymic nude mice were subcutaneously implanted with 1.0×10⁶ Colo-853 cells (A) or 2.5×10⁶ A2058 cells (B). When tumors reached ∼100 mm3, n = 8 mice/group were administered single intraperitoneal injection of SGN-CD228A or hIgG1-ADC. C, %TGI by 1 mg/kg SGN-CD228A was calculated for 1–4 studies/CDX model, and CD228 receptor numbers were determined by qFACS. Dashed line represents average %TGI by 1 mg/kg hIgG1-ADC across all CDX studies. D, Treatment response to 1 and 3 mg/kg SGN-CD228A in the same CDX models was categorized based on the following criteria: CR = tumor < starting volume, PR = tumor < starting volume for 1+ days (but not the last day), and PD = tumor volume never regresses on any day. In total, n = 76 and n = 98 mice were included in the low-dose and high-dose group, respectively.
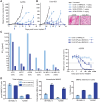
Figure 5. The glucuronide linker confers improved antitumor activity to hL49 over the Val-Cit linker in vivo and in vitro. A and B, Female athymic nude mice were subcutaneously implanted with 2.5×10⁶ A2058 cells (A) or 1.0×10⁶ Colo-853 cells (B). n = 8 mice/group were administered the indicated ADCs (arrows). Data plotted as mean+SEM. C, The indicated cell lines (CD228 receptor numbers in parentheses) were incubated with increasing concentrations of hL49 conjugated to DAR4 dipeptide drug-linker (hL49-vc-MMAE (4)), DAR4 glucuronide drug-linker (hL49-MP-gluc-MMAE (4)), or DAR8 glucuronide drug-linker (hL49-MP-gluc-MMAE (8)). Viability was measured after 96 hours, and EC50 values were obtained using linear regression of the plotted data (example curves shown on the right). D, SK-MEL-5 and A2058 cells were treated with 20 ng/mL ADC (hL49-vc-MMAE (4) or SGN-CD228A) for 24 hours, and released MMAE was quantified using LC/MS-MS in cells and in medium to determine total released MMAE, intracellular MMAE, and total released MMAE retained in the cells. Data plotted as mean ± SD of two biological replicates.
Figure 5.
The glucuronide linker confers improved antitumor activity to hL49 over the Val-Cit linker in vivo and in vitro. A and B, Female athymic nude mice were subcutaneously implanted with 2.5×10⁶ A2058 cells (A) or 1.0×10⁶ Colo-853 cells (B). n = 8 mice/group were administered the indicated ADCs (arrows). Data plotted as mean+SEM. C, The indicated cell lines (CD228 receptor numbers in parentheses) were incubated with increasing concentrations of hL49 conjugated to DAR4 dipeptide drug-linker (hL49-vc-MMAE (4)), DAR4 glucuronide drug-linker (hL49-MP-gluc-MMAE (4)), or DAR8 glucuronide drug-linker (hL49-MP-gluc-MMAE (8)). Viability was measured after 96 hours, and EC50 values were obtained using linear regression of the plotted data (example curves shown on the right). D, SK-MEL-5 and A2058 cells were treated with 20 ng/mL ADC (hL49-vc-MMAE (4) or SGN-CD228A) for 24 hours, and released MMAE was quantified using LC/MS-MS in cells and in medium to determine total released MMAE, intracellular MMAE, and total released MMAE retained in the cells. Data plotted as mean ± SD of two biological replicates.
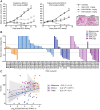
Figure 6. SGN-CD228A shows promising antitumor activity in PDX mouse models. A, NSCLC PDX models were established in nude mice, and n = 3 mice/group were given single intraperitoneal injection of SGN-CD228A or hIgG1-ADC. Data plotted as mean+SEM. B, PDX models were established in nude mice (n = 9 melanoma, n = 39 NSCLC, n = 22 TNBC). Two mice/model were injected with a single intraperitoneal dose of 3 mg/mL SGN-CD228A, and one mouse was injected with vehicle control. PDX models were divided into “low” and “high” CD228 RNA expression groups using a threshold of 5.20 log2(TPM). Dashed lines at 30% and −30% indicate thresholds for progressive disease and partial response according to RECIST criteria. *NSCLC, squamous; ^NSCLC, unknown subtype. Data shown as mean of 2 mice/model. C, CD228 expression is correlated with %TGI in PDX models. Pearson's product-moment correlation was performed with R.
Figure 6.
SGN-CD228A shows promising antitumor activity in PDX mouse models. A, NSCLC PDX models were established in nude mice, and n = 3 mice/group were given single intraperitoneal injection of SGN-CD228A or hIgG1-ADC. Data plotted as mean+SEM. B, PDX models were established in nude mice (n = 9 melanoma, n = 39 NSCLC, n = 22 TNBC). Two mice/model were injected with a single intraperitoneal dose of 3 mg/mL SGN-CD228A, and one mouse was injected with vehicle control. PDX models were divided into “low” and “high” CD228 RNA expression groups using a threshold of 5.20 log2(TPM). Dashed lines at 30% and −30% indicate thresholds for progressive disease and partial response according to RECIST criteria. *NSCLC, squamous; ^NSCLC, unknown subtype. Data shown as mean of 2 mice/model. C, CD228 expression is correlated with %TGI in PDX models. Pearson's product-moment correlation was performed with R.

Comment in

  • 1535-7163. doi: 10.1158/1535-7163.MCT-22-4-HI

References

    1. Brown JP, Woodbury RG, Hart CE, Hellstrom I, Hellstrom KE. Quantitative analysis of melanoma-associated antigen p97 in normal and neoplastic tissues. Proc Natl Acad Sci USA 1981;78:539–43. - PMC - PubMed
    1. Brown JP, Hewick RM, Hellstrom I, Hellstrom KE, Doolittle RF, Dreyer WJ. Human melanoma-associated antigen p97 is structurally and functionally related to transferrin. Nature 1982;296:171–3. - PubMed
    1. Rose TM, Plowman GD, Teplow DB, Dreyer WJ, Hellstrom KE, Brown JP. Primary structure of the human melanoma-associated antigen p97 (melanotransferrin) deduced from the mRNA sequence. Proc Natl Acad Sci USA 1986;83:1261–5. - PMC - PubMed
    1. Demeule M, Poirier J, Jodoin J, Bertrand Y, Desrosiers RR, Dagenais C, et al. . High transcytosis of melanotransferrin (P97) across the blood-brain barrier. J Neurochem 2002;83:924–33. - PubMed
    1. Dus-Szachniewicz K, Ostasiewicz P, Wozniak M, Kolodziej P, Wisniewski JR, Ziolkowski P. Pattern of melanotransferrin expression in human colorectal tissues: an immunohistochemical study on potential clinical application. Anticancer Res 2015;35:6551–61. - PubMed

Publication types

Associated data

Grants and funding