. 2023 May 18;141(20):2508-2519.
doi: 10.1182/blood.2022015418.

CXCL8/CXCR2 signaling mediates bone marrow fibrosis and is a therapeutic target in myelofibrosis

Affiliations

CXCL8/CXCR2 signaling mediates bone marrow fibrosis and is a therapeutic target in myelofibrosis

Andrew J Dunbar et al. Blood. .

Abstract

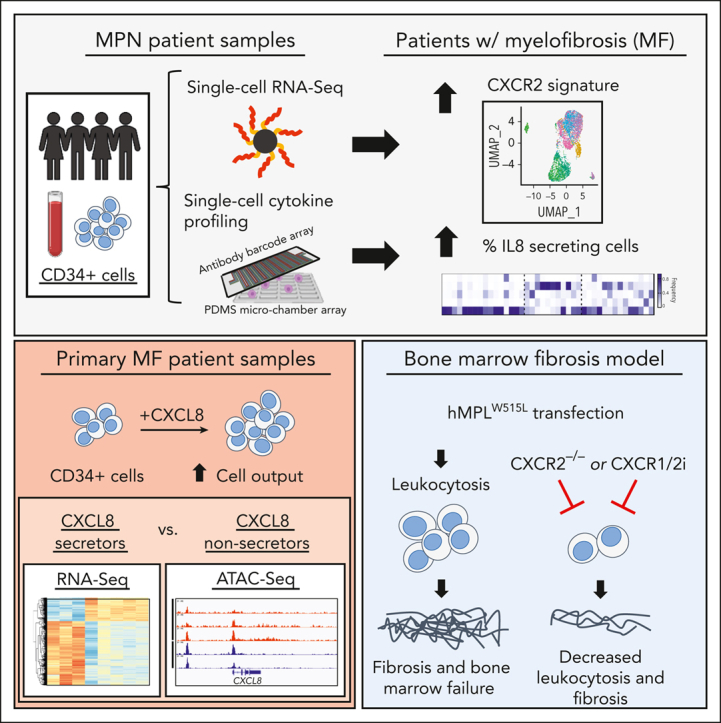
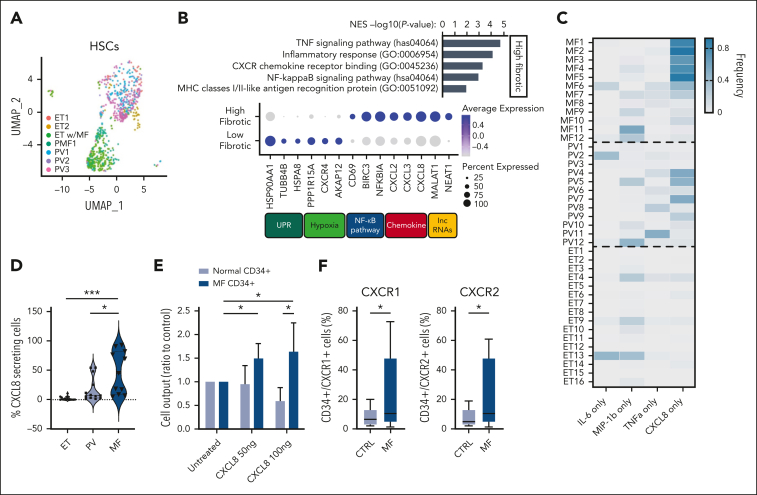
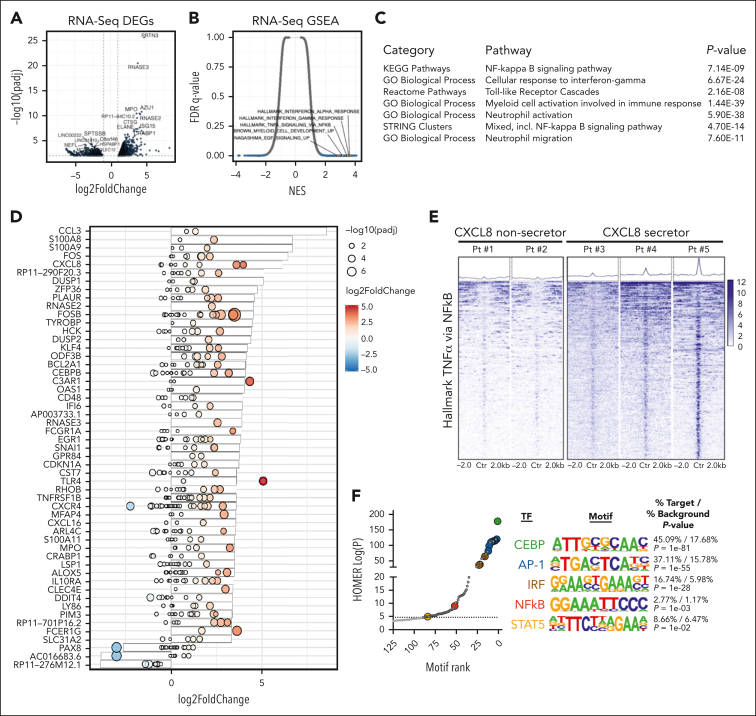
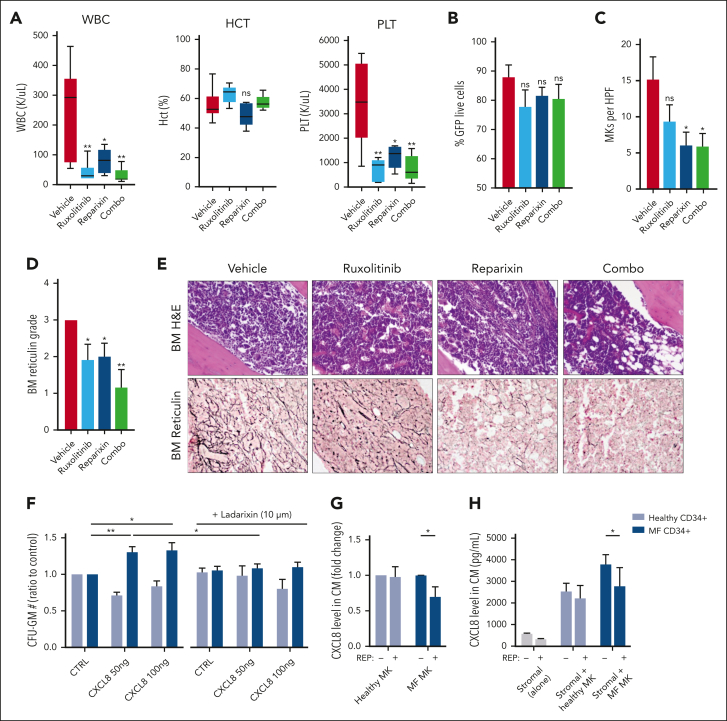
Proinflammatory signaling is a hallmark feature of human cancer, including in myeloproliferative neoplasms (MPNs), most notably myelofibrosis (MF). Dysregulated inflammatory signaling contributes to fibrotic progression in MF; however, the individual cytokine mediators elicited by malignant MPN cells to promote collagen-producing fibrosis and disease evolution are yet to be fully elucidated. Previously, we identified a critical role for combined constitutive JAK/STAT and aberrant NF-κB proinflammatory signaling in MF development. Using single-cell transcriptional and cytokine-secretion studies of primary cells from patients with MF and the human MPLW515L (hMPLW515L) murine model of MF, we extend our previous work and delineate the role of CXCL8/CXCR2 signaling in MF pathogenesis and bone marrow fibrosis progression. Hematopoietic stem/progenitor cells from patients with MF are enriched for a CXCL8/CXCR2 gene signature and display enhanced proliferation and fitness in response to an exogenous CXCL8 ligand in vitro. Genetic deletion of Cxcr2 in the hMPLW515L-adoptive transfer model abrogates fibrosis and extends overall survival, and pharmacologic inhibition of the CXCR1/2 pathway improves hematologic parameters, attenuates bone marrow fibrosis, and synergizes with JAK inhibitor therapy. Our mechanistic insights provide a rationale for therapeutic targeting of the CXCL8/CXCR2 pathway among patients with MF.


Conflict of interest statement

Conflict-of-interest disclosure: R.L.L. is on the supervisory board of Qiagen and is a scientific adviser to Imago, Mission Bio, Bakx, Zentalis, Ajax, Auron, Prelude, C4 Therapeutics, and IsoPlexis; has received research support from AbbVie, Constellation, Ajax, Zentalis, and Prelude; has received research support from and consulted for Celgene and Roche and has consulted for Syndax, Incyte, Janssen, Astellas, MorphoSys, and Novartis; and has received honoraria from AstraZeneca and Novartis for invited lectures and from Gilead and Novartis for grant reviews. A.J.D. has served on an advisory committee for Incyte. R.F. is cofounder and scientific adviser of IsoPlexis, Singleron Biotechnologies, and AtlasXomics with significant financial interest. A.R.M. and R.H. received funds from Dompé farmaceutici S.p.A. (Via Campo di Pile, 67100 L’Aquila, Italy). J.C., E.T., T.M., and J.Z. are employees and equity partners of IsoPlexis Corporation. M.K. is currently an employee of Imago BioSciences. R.L.B. has received honoraria from Mission Bio and is a member of the Speakers Bureau for Mission Bio. The remaining authors declare no competing financial interests.

Figures

None
Graphical abstract
Figure 1.
Figure 1.
CD34+ cells secreting only CXCL8 are enriched in a subset of patients with MF, and this correlates with clinical features, including grade reticulin fibrosis. (A) Uniform manifold approximation and projection visualization of individual HSCs colored based on the patient (see supplemental Table 1). (B, top) GSEA of differentially expressed genes (DEGs) based on clustering of patient HSCs; (B, bottom) most DEGs and their pathway associations (percent expressed: percentage of cells expressing listed gene; average expression scale: Z score of normalized read counts, with blue, positive values and gray, negative values). UPR, unfolded protein response. (C) Heatmap demonstrating frequency of individual cytokine-secreting CD34+ cells detected across MPN subtypes MF, PV, and ET among individual patients as a percentage of total cytokine-secreting cells (from 0% in gray to 100% in dark blue). Four cytokines presented: IL-6, MIP-1β, TNFα, and CXCL8. (D) Violin plot depicting the correlation between MPN subtype and percent fraction of cells secreting only CXCL8, as detected via single-cell cytokine analysis. (E) Ratio of total cell output relative to untreated cultured healthy donor (HD) (light blue) vs MF (dark blue) CD34+ cells in response to exogenous CXCL8 (50 or 100 ng). Representative of triplicate experiments from N = 3 HD and N = 6 MF samples. Data shown represent mean ± standard deviation (SD. (F) Percent of total CD34+ cells expressing CXCR1 (left) or CXCR2 (right) via flow cytometry of HD (control [CTRL]; N = 13) vs patients with MF (N = 15). Data shown represent mean ± SD. ∗P < .05; ∗∗∗P < .001. NES, normalized enrichment score.
Figure 2.
Figure 2.
Integrated transcriptional (RNA-Seq)/chromatin accessibility (ATAC-Seq) profiling identifies pathways enriched in CXCL8-secretor MF. (A) Volcano plot demonstrating most DEGs in CXCL8 secretor (N = 3) vs nonsecretor (N = 5) patients with MPN via RNA-Seq. The significant events with an inclusion level >0.5 log fold change and an FDR-corrected P < .0001 are shown in blue. (B) GSEA demonstrating enriched pathways of CXCL8 secretors vs nonsecretors plotted as NES vs FDR q value. (C) Table depicting results of enriched pathways from optimized subnetwork gene expression analysis in CXCL8 secretor vs nonsecretor patients with MPN. (D) Waterfall plot with integrated gene expression and chromatin accessibility showing most differentially regulated genes (represented as log2 fold change) in CXCL8 secretors (N = 3) vs nonsecretors (N = 2) and their corresponding degree of changes in accessibility peaks (represented as log2 fold change and -log10[padj]; red, positive values; blue, negative values). (E) Tornado plot and heatmaps depicting accessibility at promoter regions of the top 500 leading-edge genes in the hallmark TNFα/NF-κB gene set of CXCL8 nonsecretor (N = 2) vs CXCL8-secretor (N = 3) patients with MPN. (F) Known Homer motif analysis from ATAC-Seq data demonstrating increased accessibility of CEBP, AP-1 (and AP-1 related), interferon-regulatory factor (and interferon-regulatory factor–related), NF-κB, and STAT5 motif signatures among enhancer regions of CXCL8-high/fibrotic MPN.
Figure 3.
Figure 3.
Cxcr2 deletion in murine BM improves counts and reticulin fibrosis in the hMPLW515L adoptive transfer model of MF. (A) WBC counts (×103/μL), hematocrit levels (%), and platelet counts (×103/μL) of Cxcr2f/f;Cre+ knockout (KO) hMPLW515L mice compared with Cxcr2f/f;Cre WT hMPLW515L or MSCV-MigR1-IRES-GFP EV control mice at timed euthanization 9 weeks after transplant. N = 4 or 5 per arm; ∗P < .05; ∗∗P < .01; ∗∗∗P < .001; ∗∗∗∗P < .0001. Data shown represent mean ± standard error of mean (SEM). Two-way analysis of variance was used to compare groups. (B) Peripheral blood mutant cell fraction vs GFP percentage in Cxcr2f/f;Cre+ hMPLW515L mice vs Cxcr2f/f;Cre WT hMPLW515L or EV control mice. N = 4 or 5 per arm; ∗∗P < .01; ∗∗∗P < .001; ∗∗∗∗P < .0001. Data shown represent mean ± SEM. (C) Liver weights (mg) of Cxcr2f/f;Cre+ KO vs Cxcr2f/f;Cre WT hMPLW515L mice compared with EV controls. ∗∗P < .01. Data shown represent mean ± SEM. (D) Representative H&E and reticulin images of BM from Cxcr2f/f;Cre+ KO vs Cxcr2f/f;Cre WT hMPLW515L mice at timed euthanization 9 weeks after transplant. Representative images of N = 6 mice per arm. (E) Kaplan-Meier survival analysis of Cxcr2f/f;Cre+ KO hMPLW515L mice (N = 16) vs Cxcr2f/f;Cre WT hMPLW515L mice (N = 13). ∗∗P < .01 (log-rank test). (F) Fold change in serum cytokine levels of IL-6, IL-10, and TNFα of Cxcr2f/f;Cre+ KO compared with Cxcr2f/f;Cre WT hMPLW515L mice. N = 8 per arm. ∗P < .05. Data shown represent mean ± SEM. (G) Western blot analysis of the alarmins S100a8/a9 from the harvested splenocytes of Cxcr2f/f;Cre+ KO vs Cxcr2f/f;Cre WT hMPLW515L mice. Original magnification ×20 (D). H&E, hematoxylin and eosin; ns, not significant.
Figure 4.
Figure 4.
Pharmacologic inhibition of CXCR1/2 improves hematologic parameters and reticulin fibrosis in the hMPLW515L-adoptive transfer model of MF. (A) WBC counts (×103/μL), hematocrit levels (%), and PLT (×103/μL) of hMPLW515L-affected mice treated with vehicle, ruxolitinib (60 mg/kg twice daily), the CXCR1/2 inhibitor reparixin (60 mg/kg twice daily), or combination therapy at timed euthanization after 21 days of treatment. N = 6 mice per arm. ∗P < .05; ∗∗P < .01. The t test (unpaired, two-tailed) was used to compare the mean of 2 groups. Data shown represent mean ± SEM. (B) Peripheral blood mutant cell fraction by GFP percentage of treated mice. Data shown represent mean ± SEM. (C) MKs number per high powered field (HPF) observed in BM of hMPLW515L mice in response to treatment. ∗P < .05. Data shown represent mean ± SEM. (D) BM reticulin scores of hMPLW515L-diseased mice treated with either vehicle, ruxolitinib, reparixin, or combination therapy. N = 6 mice per arm. ∗P < .05; ∗∗P < .01. (E) Representative H&E and reticulin images of hMPLW515L-diseased BM treated with ruxolitinib, reparixin, or combination therapy compared with vehicle-treated mice. N = 6 mice per condition. (F) Colony-forming unit (CFU) assay demonstrating total granulocyte-macrophage progenitor (CFU-GM) colony number as a ratio to control of untreated healthy human donor (light blue) vs MF (dark blue) CD34+ cells with exogenous CXCL8 and its response to the second-generation CXCR1/2 antagonist ladarixin (10 μM) in vitro. ∗P < .05; ∗∗P < .01. Representative of duplicate experiments from 5 healthy donor (HD) and 13 individual MF cases. (G) Fold change in detectable CXCL8 levels in conditioned media (CM) elicited by either HD vs MF MKs with or without the addition of reparixin (10 μM). Representative of duplicate experiments from 3 HD and 6 individual MF cases. ∗P < .05. Data shown represent mean ± SD. (H) Total levels of CXCL8 in conditioned media of cultured stromal cells, either alone or together with healthy vs MF MKs with or without the addition of reparixin (10 μM). ∗P < .05. Data shown represent mean ± SD. Representative of duplicate experiments from 3 HD and 3 individual MF cases. Original magnification ×20 (E).

Comment in

References

    1. Tefferi A, Pardanani A. Myeloproliferative neoplasms: a contemporary review. JAMA Oncol. 2015;1(1):97–105. - PubMed
    1. Baxter EJ, Scott LM, Campbell PJ, et al. Acquired mutation of the tyrosine kinase JAK2 in human myeloproliferative disorders. Lancet. 2005;365(9464):1054–1061. - PubMed
    1. Kralovics R, Passamonti F, Buser AS, et al. A gain-of-function mutation of JAK2 in myeloproliferative disorders. N Engl J Med. 2005;352(17):1779–1790. - PubMed
    1. Levine RL, Wadleigh M, Cools J, et al. Activating mutation in the tyrosine kinase JAK2 in polycythemia vera, essential thrombocythemia, and myeloid metaplasia with myelofibrosis. Cancer Cell. 2005;7(4):387–397. - PubMed
    1. James C, Ugo V, Le Couedic JP, et al. A unique clonal JAK2 mutation leading to constitutive signalling causes polycythaemia vera. Nature. 2005;434(7037):1144–1148. - PubMed

Publication types