. 2023 Apr 27;141(17):2085-2099.
doi: 10.1182/blood.2022018252.

In vivo HSC prime editing rescues sickle cell disease in a mouse model

Affiliations

In vivo HSC prime editing rescues sickle cell disease in a mouse model

Chang Li et al. Blood. .

Abstract

Sickle cell disease (SCD) is a monogenic disease caused by a nucleotide mutation in the β-globin gene. Current gene therapy studies are mainly focused on lentiviral vector-mediated gene addition or CRISPR/Cas9-mediated fetal globin reactivation, leaving the root cause unfixed. We developed a vectorized prime editing system that can directly repair the SCD mutation in hematopoietic stem cells (HSCs) in vivo in a SCD mouse model (CD46/Townes mice). Our approach involved a single intravenous injection of a nonintegrating, prime editor-expressing viral vector into mobilized CD46/Townes mice and low-dose drug selection in vivo. This procedure resulted in the correction of ∼40% of βS alleles in HSCs. On average, 43% of sickle hemoglobin was replaced by adult hemoglobin, thereby greatly mitigating the SCD phenotypes. Transplantation in secondary recipients demonstrated that long-term repopulating HSCs were edited. Highly efficient target site editing was achieved with minimal generation of insertions and deletions and no detectable off-target editing. Because of its simplicity and portability, our in vivo prime editing approach has the potential for application in resource-poor countries where SCD is prevalent.


Conflict of interest statement

Conflict-of-interest disclosure: A.L. and H.-P.K. are academic co-founders of Ensoma Therapeutics. H.P.K. is a paid advisor for Ensoma. P.J.C. is currently an employee of Prime Medicine. D.R.L. is a consultant for Prime Medicine, Beam Therapeutics, Pairwise Plants, Chroma Medicine, and Nvelop Therapeutics, companies that use or deliver genome editing or epigenome engineering agents, and owns equity in these companies. The remaining authors declare no competing financial interests.

Figures
None
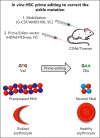
Graphical abstract
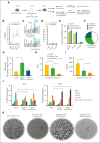
Figure 1.
Figure 1.
HDAd vectors expressing prime editors and in vitro validation. (A) Intended base conversions. The goal is to convert the GTG (Val) codon to a GAA (Glu) codon to repair the sickle mutation (T>A) and to prevent the PE from continuing editing by destroying the PAM (G>A silent mutation). (B) Schematics of HDAd vectors used in this study. The prime editing machinery consists of (1) a prime editing guide RNA (pegRNA), capable of identifying the target nucleotide sequence to be edited and encoding new genetic information that replaces the targeted sequence. The pegRNA consists of an extended single guide RNA (sgRNA) containing a primer binding site (PBS) and a reverse transcriptase (RT) template sequence. During genome editing, the primer binding site allows the 3’-end of the nicked DNA strand to hybridize to the pegRNA, whereas the RT template serves as a template for the synthesis of edited genetic information. epegRNA indicates the addition of engineered stabilizing structure at 3’-end of pegRNA for extended pegRNA expression and improved editing activity. (2) nCas9-RT. The SpCas9 nickase (nCas9) contains a H840A mutation to inactivate one of its two nuclease domains, thereby disabling its capability of making double-stranded DNA breaks and only allowing single strand DNA nicking. The Cas9 nickase is linked to a M-MLV RT capable of synthesizing DNA from a single-stranded RNA template. The nCas9-RT∗ in PEmax vectors designate optimization in codon usage, nuclear localization signals, and nCas9 activity through mutations. (3) sgRNA-nick is the sgRNA that directs the nCas9 to nick the nonedited DNA strand. The nick location of sgRNA-nick1 is 72 bp away from the pegRNA-induced nick. SgRNA-nick2 spacer partially overlaps with the pegRNA spacer and only matches with the PAM-containing strand after editing occurs, thereby minimizing indel frequency. (4) dominant negative MLH1 inhibits endogenous MLH1 through inhibition, thereby reducing cellular mismatch repair responses and increasing prime editing efficiency. Additional elements of the PE cassette include U6: U6 RNA polymerase III promoter; EF1α: Elongation factor 1α promoter, miRNA/β-3’UTR: miR-183-5p and miR-218-5p target sites embedded into β-globin to suppress nCas9-RT expression in HDAd producer cells, thus avoiding vector rearrangements, and supporting high vector production yields; (pA1: BGH pA; pA2: SV40 pA, pA3: rabbit β-globin pA). The vectors also contain a PGK-MGMTP140K expression cassette used before. Note that PE3 is an earlier version of the prime editing system whereas PEmax consists of codon- and activity-optimized nCas9-RT components. (C) Analysis of G>A (silent PAM site) editing in cell lines. Human embryonic kidney (HEK) 293 and erythroid K562 cells (both without the SCD mutation) were transduced with HDAd vectors expressing either PE3, PE3max, PE3bmax, or PE5max at the indicated MOIs. Three days later, DNA was subjected to Sanger sequencing. Data shown here are from 2 independent experiments. (D) Editing of the target T>A site in Lin BM cells from SCD CD46/Townes mice. Lin cells, a fraction that is enriched for HSPCs, was infected with the 3 HDAd-PE vectors at an MOI of 500 vp/cell and editing was analyzed 4 days later using NGS of the target region. n = 3 donor mice; ∗P < .05. (E) Analysis of G>A (silent PAM site) editing in CD34+ cells from 3 healthy donors using NGS. Editing was measured at 4 days after transduction. MOI = 500 vp/cell. ∗P < .05. Statistical significance was assessed using one-way ANOVA with Šidák’s multiple comparisons test to calculate P values. pA, polyadenylation signals; UbC, human ubiquitin C promoter.
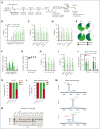
Figure 2.
Figure 2.
In vitro studies with CD34+ cells from patients with SCD infected with HDAd-PE5max. (A) SCD CD34+ cells (from 3 donors) were infected with HDAd-PE5max or the control virus HDAd-mgmt/GFP at an MOI of 4000 vp/cell or left untransduced (UNTD). On day 3, cells were either plated in Methocult for progenitor colony assays or subjected to ED with or without O6BG/BCNU in vitro selection. (B) Editing rates measured using NGS at various time points after transduction and in vitro differentiation with or without selection. (C) DNA chromatograms from Sanger sequencing showing target site T>A conversion in cells of donor #3 after ED. (D) Percentage of reads with indels. (E) Number of progenitor colonies formed from 2000 plated CD34+ cells (counted at day 14 of culture). BFUE, blast-forming units-erythroid; CFU-GM, granulocyte-macrophage colony–forming unit. (F) Editing measured using Sanger sequencing in donor #3 progenitor colonies after HDAd-PE5max transduction and selection (n = 111). (G) Fold expansion of total cell at day 18 of ED vs day 7 of ED. N = 3 donors. (H and I) Flow cytometry for ROS at day 18 of ED of untransduced cells and cells transduced with HDAd-PE5max without and with O6BG/BCNU in vitro selection (sel). (H) Percentage of ROS-positive cells. (I) ROS mean fluorescence intensity. (J) Percentage of erythroid progenitors counted on cytospins from differentiated SCD CD34+ cells at days 14 and 18 of ED, untransduced (UNTD) and HDAd-PE5max–transduced without and with selection. Two scientists counted 5 random fields. (K) Smears of total blood cells subjected to a sodium metabisulfite sickling assay. Pictures shown here are from day 18 of ED. The scale bar is 25 μm. ∗P < .05. Statistical significance was assessed using one-way ANOVA with Šidák’s multiple comparisons test to calculate P values. Baso, basophilic erythroblasts; dpt, days post transduction; Diff, in vitro ED; mat. Ortho, maturing orthochromatic erythroblasts; Ortho, orthochromatic erythroblasts; Poly, polychromatic erythroblasts; Pro, proerythroblasts; Pyrcs, pyrenocytes; Retics, reticulocytes.
Figure 3.
Figure 3.
Correction of the SCD mutation by ex vivo HSC transduction. (A) Schematic of the experiment. BM Lin cells were harvested from CD46/Townes mice and transduced with HDAd-PE5max at an MOI of 500 vp/cell. Cells were then either cultured for 3 days or transplanted into lethally irradiated C57BL/6 mice at 24 hours after transduction. The mice were followed for 16 weeks. For further evaluation of long-term repopulating cells, BM Lin cells from these mice were then used for secondary transplantation and these mice were monitored for another 16 weeks. (B and C) Analyses of day 3 cultures and colonies. (B) Target base conversions and indel frequency measured using NGS. Lin cells isolated from 3 independent donors were analyzed (n = 3 animals). (C) Allelic analysis in single Lin cell–derived progenitor colonies (n = 30). Editing was measured using Sanger sequencing at day 11 after plating of transduced Lin cells derived from a representative mouse. (D-H) Analyses of transplanted primary mice. (D) Engraftment of HDAd-PE5max–transduced HSCs measured using flow cytometry of human CD46 expression in PBMCs. (E) Analysis of target site editing (T>A, sickle site and G>A, silent PAM site) using Sanger sequencing in PBMCs at different time points after transplantation (n = 5 animals). (F) Editing (Sanger) at week 16 in PBMCs, splenocytes, BM MNCs, BM Lin cells and pooled progenitor colonies from plated Lin cells (Pooled CFU). (G) Target base conversions and indel frequency in BM MNCs (week 16) measured using NGS. (H) Allelic analysis in progenitor colonies derived from week-16 BM Lin cells (n = 36). Colonies from 3 individual mice were analyzed using Sanger sequencing (n = 12 for each mouse). All colonies had a 100% editing rate. (I-K). Analyses of secondary recipients similar to panels D-H. For panels C, E, F, H, J, and K, editing was measured using Sanger sequencing. For panels D-G, I-K, each symbol represents an individual mouse.
Figure 4.
Figure 4.
Therapeutic prime editing in CD46/Townes mice after in vivo HSC transduction with HDAd-PE5max. (A) Experimental procedure. Mice (n = 7) were mobilized using G-CSF/AMD3100 and were transduced in vivo with HDAd-PE5max (8 × 1010 vp/mouse = 3.2 × 1012 vp/kg). For in vivo selection, mice were injected with O6-BG (15 mg/kg, intraperitoneal [IP]) 2 times, 30 minutes apart. One hour after the second injection of O6-BG, mice were injected with BCNU (5 mg/kg, IP). For the second and third cycle, BCNU concentrations were increased to 9 mg/kg and 10 mg/kg, respectively. The mice were killed during week 16 for analyses. Lin cells were isolated from BM and IV injected into lethally irradiated C57BL/6J mice. The secondary transplanted mice were followed for another 16 weeks for the specified terminal point analyses. (B-F) Editing measured using Sanger sequencing of in vivo–transduced mice. (B) Target base editing (sickle repair and silent PAM) in PBMCs. (C) Editing in cells from different tissues at week 16 after in vivo transduction. (D) Editing in different lineage-positive cell subsets and Lin cells at week 16. CD3+ T cells, CD19+ B cells, Gr1+ granulocytes, Ter-119+ erythroid cells were sorted from BM MCs using flow cytometry. (E) Allelic analysis in single Lin cell–derived progenitor colonies. Editing was measured at day 11 after plating of transduced Lin cells. Data from 4 mice with indicated ear tag number are shown. Twelve colonies for each mouse were analyzed. (F) Editing in tissues (n = 4). (G-I) Analyses of secondary recipients. Lin cells from in vivo–transduced mice were transplanted into lethally irradiated C57BL/6 mice (n = 7) (cells from donor into 1 recipient). (G) Engraftment based on human CD46 expression in PBMCs. (H) Editing measured using Sanger sequencing in PBMCs of secondary recipients at indicated weeks after transplantation. (I) Editing measured using Sanger sequencing at week 16 after transplantation in PBMCs, splenocytes, and BM cells. (J) Target base conversions and indel frequency measured using NGS. Week 16 BM MNCs samples from primary and secondary mice were used. K-N) Analyses of hemoglobin composition. Whole blood samples at week 16 after in vivo (n = 7) and ex vivo (n = 5) transduction were analyzed. Samples from untreated CD46/Townes mice (n = 3) were used as control. (K) Percentages of hemoglobin tetramers as measured using HPLC. Representative chromatograms are shown in supplemental Figure 12A. (L) Percentages of hemoglobin subunits as measured using mass spectrometry. (M) Representative chromatogram pattern showing the separation of βA from βS globin chains. The labeled percentages were calculated based on the peak areas. See supplemental Figure 12B for representative full spectrum chromatograms. (N) Separation of hemoglobin variants using isoelectric focusing electrophoresis. Each lane represents 1 mouse (ear tag number labeled) or AFSC controls. Bands in AFSC controls indicating 4 different hemoglobin variants are labeled. For B-D and F-J, each dot represents 1 animal. Data shown are mean ± standard deviation, wherever applicable. AFSC, hemoglobin A, F, S, and C controls.
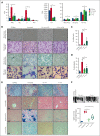
Figure 5.
Figure 5.
Phenotypic correction of CD46/Townes mice using ex vivo and in vivo approaches at week 16 after treatment. (A) Blood cell analysis of healthy control CD46tg mice (“CD46tg,” n = 3), untreated CD46/Townes mice (“untreated,” n = 3), primary recipient mice at week 16 after transplantation of ex vivo–transduced BM Lin cells from CD46/Townes mice (“ex vivo,” n = 5), and CD46/Townes mice at week 16 after in vivo transduction (“in vivo,” n = 7). (B) Representative microphotographs of blood cell and BM smears. First panel: smears of total blood cells subjected to a sickling assay; second panel: blood cell smears stained with Giemsa; third panel: staining of blood smears for reticulocytes with brilliant cresyl blue, which stains nuclear remnants of basophilic ribonucleoproteins in reticulocytes (black arrow); fourth panel: BM smears stained with Giemsa. The red arrow marks an undifferentiated proerythroblast. The blue arrow points at more differentiated erythroblasts or reticulocytes. The scale bars are 20 μm. (C) Percentage of sickle cells in blood smears. Each dot represents the percentage in an individual mouse. (D) Percentage of reticulocytes in blood smears. (E) Upper 2 panels: spleen and liver sections stained with hematoxylin and eosin. Lower 2 panels: tissue hemosiderosis visualized using Perls Prussian blue staining. Iron deposition is shown as cytoplasmic blue pigments of hemosiderin in spleen tissue sections. The scale bars are 200 μm. (F) Spleen sizes (upper panel) and spleen weight relative to body weight (lower panel). Each symbol represents an individual mouse. ∗P < .05. Statistical differences were calculated using one-way ANOVA with Šidák’s multiple comparisons test. HCT, hematocrit; Hb, hemoglobin; LY, lymphocytes; MO, monocytes; NE, neutrophils; PLT, platelets; RBC, red blood cells; WBC, white blood cells.
Figure 6.
Figure 6.
Analyses of OT effects. (A) OT editing measured using amplicon deep sequencing at the top 20 potential CIRCLE-seq nominated sites. The workflow is illustrated on the left side. Genomic DNA was isolated from BM MNCs of an untreated mouse or the mouse showing highest on-target editing after in vivo transduction with HDAd-PE5max. OT prime editing (middle bar graph) was calculated based on the percentage of reads with the G/T/C > A conversion at position +4 (corresponding to sickle mutation), counting the predicted nicking site as position +1. If position +4 was already an A in the wild-type allele, the calculation was performed based on the percentage of G/T/C > A conversion at position +5 (corresponding to the silent PAM mutation). Percentage of reads with indels was also analyzed (right bar graph). (B) OT editing at the top-5 ranked potential sites in mouse genome nominated through in silico prediction using Cas-OFFinder. Genomic DNA samples were the same as those in A. The workflow is illustrated on the left side. (C) OT editing at the top-5 ranked potential sites in human genome nominated through in silico prediction using Cas-OFFinder. Genomic DNA was isolated from untreated or HDAd-PEmax–transduced and selected SCD CD34+ cells. Percentage of reads with prime editing and indels are shown. Note that hOT#1’ (highlighted by a $ symbol) maps to the HBD site and only bears 1 bp mismatch at the on-target site.

Comment in

References

    1. Kato GJ, Piel FB, Reid CD, et al. Sickle cell disease. Nat Rev Dis Primers. 2018;4 - PubMed
    1. Kanter J, Walters MC, Krishnamurti L, et al. Biologic and clinical efficacy of LentiGlobin for sickle cell disease. N Engl J Med. 2022;386(7):617–628. - PubMed
    1. Frangoul H, Altshuler D, Cappellini MD, et al. CRISPR-Cas9 gene editing for sickle cell disease and beta-thalassemia. N Engl J Med. 2021;384(3):252–260. - PubMed
    1. Esrick EB, Lehmann LE, Biffi A, et al. Post-transcriptional genetic silencing of BCL11A to treat sickle cell disease. N Engl J Med. 2021;384(3):205–215. - PMC - PubMed
    1. Habib O, Habib G, Hwang GH, Bae S. Comprehensive analysis of prime editing outcomes in human embryonic stem cells. Nucleic Acids Res. 2022;50(2):1187–1197. - PMC - PubMed

Substances