. 2023 Feb 17;28(1):81.
doi: 10.1186/s40001-023-01032-7.

Role of epigenetics in the clinical evolution of COVID-19 disease. Epigenome-wide association study identifies markers of severe outcome

Affiliations

Role of epigenetics in the clinical evolution of COVID-19 disease. Epigenome-wide association study identifies markers of severe outcome

Luciano Calzari et al. Eur J Med Res. .

Abstract

Background: COVID-19 has a wide spectrum of clinical manifestations and given its impact on morbidity and mortality, there is an unmet medical need to discover endogenous cellular and molecular biomarkers that predict the expected clinical course of the disease. Recently, epigenetics and especially DNA methylation have been pointed out as a promising tool for outcome prediction in several diseases.

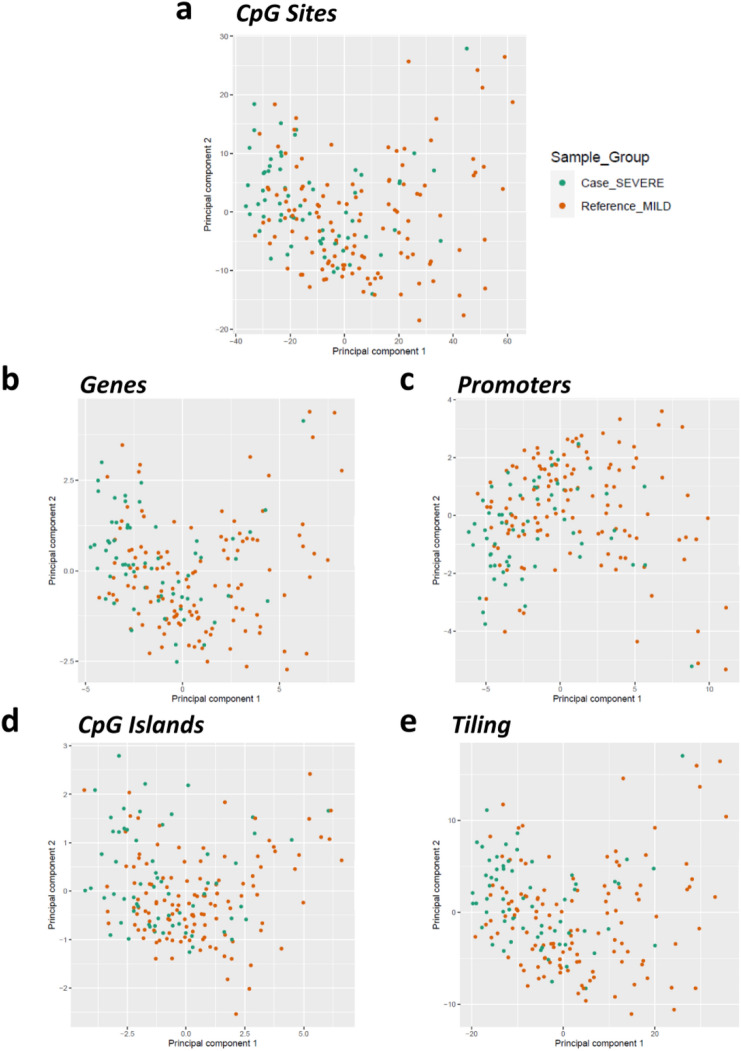
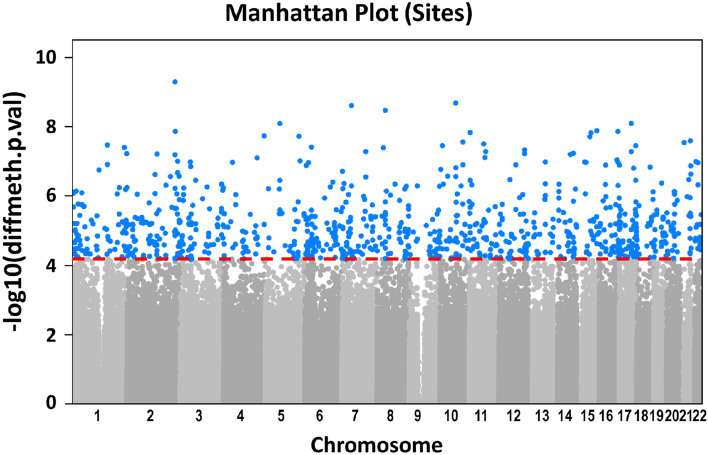
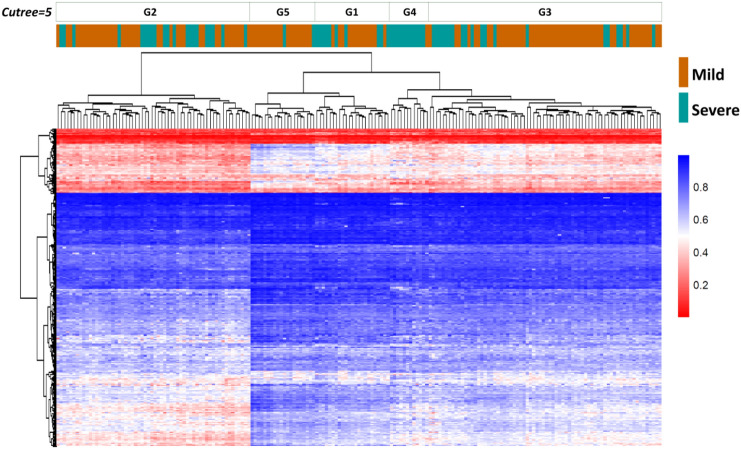
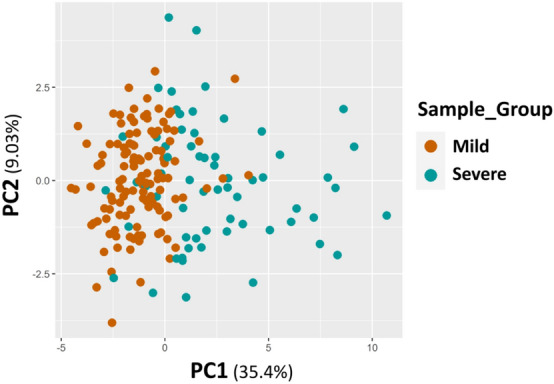
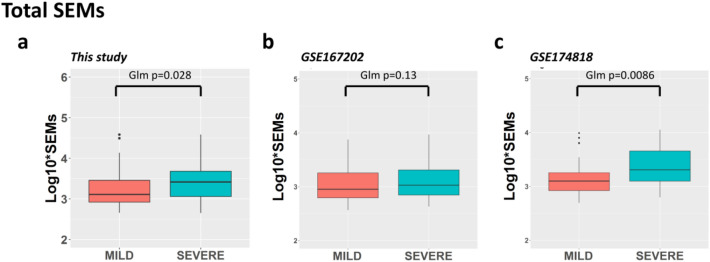
Methods and results: Using the Illumina Infinium Methylation EPIC BeadChip850K, we investigated genome-wide differences in DNA methylation in an Italian Cohort of patients with comorbidities and compared severe (n = 64) and mild (123) prognosis. Results showed that the epigenetic signature, already present at the time of Hospital admission, can significantly predict risk of severe outcomes. Further analyses provided evidence of an association between age acceleration and a severe prognosis after COVID-19 infection. The burden of Stochastic Epigenetic Mutation (SEMs) has been significantly increased in patients with poor prognosis. Results have been replicated in silico considering COVID-19 negative subjects and available previously published datasets.

Conclusions: Using original methylation data and taking advantage of already published datasets, we confirmed in the blood that epigenetics is actively involved in immune response after COVID-19 infection, allowing the identification of a specific signature able to discriminate the disease evolution. Furthermore, the study showed that epigenetic drift and age acceleration are associated with severe prognosis. All these findings prove that host epigenetics undergoes notable and specific rearrangements to respond to COVID-19 infection which can be used for a personalized, timely, and targeted management of COVID-19 patients during the first stages of hospitalization.

Keywords: COVID signature; COVID-19; DNA methylation; EWAS; Epigenetic drift; Epigenetics; SARS-CoV-2; Stochastic epigenetic mutation.


Conflict of interest statement

The authors declare no conflicts of interest.

Figures

Fig. 1
Fig. 1
Scatter plots of principal component analysis (PCA). Scatter plot distribution of samples along with the first two principal components at a sites, b genes, c promoters, d CpG islands, and e tiling (5 kb fixed regions)
Fig. 2
Fig. 2
Manhattan Plot. Manhattan plot showing the distribution of p-values of differentially methylated CpG sites. The ordinate axis represents the negative log10 of the unadjusted p-value of methylation differences between “severe” and control “mild” groups while the abscissa axis is the location of differentially methylated points concerning chromosomes. Dots in blue color represent the 880 significant differentially methylated CpG sites. The dashed red line represents the threshold of significance (False Discovery Rate)
Fig. 3
Fig. 3
Unsupervised hierarchical clustering. Heatmap showing unsupervised hierarchical clustering of 187 samples using the 880 differentially methylated CpG sites obtained in differential methylation analysis (RnBeads). The blue color indicates hyper-methylation while red indicates hypo-methylation. Green bars represent “severe” COVID-19 patients. Orange bars represent “mild” patients (used as controls). Cluster analysis was performed using the “complete” clustering method and assuming Euclidean distances
Fig. 4
Fig. 4
Scatter plots of principal component analysis (PCA) on 21 Differentially methylated sites. Scatter plot distribution of the methylation profiles of 187 samples restricted to the 21 CpG sites constituting our COVID-19 signature
Fig. 5
Fig. 5
Boxplots of GrimAge epigenetic clock. Boxplots showing the distribution of AgeAccelGrim measures in “mild” and “severe” patients in a our study, b GSE167202 [10], and c GSE174818 [7]. The thick horizontal line in the box represents the median of the distribution while the box represents the interquartile range. Whiskers are set as the default option for the “ggplot” boxplot function and extend to the most extreme data point, which is no more than 1.5 times the interquartile range from the box. Dots represent outliers (single values exceeding 1.5 interquartile ranges)
Fig. 6
Fig. 6
Boxplots of Stochastic Epigenetic Mutations (SEMs). Boxplots showing the distribution of SEMs in “mild” and “severe” patients in a our study, b GSE167202, and c GSE174818. The left panel shows the non-transformed SEMs values while in the panel on the right the log10 transformed SEMs values. The thick horizontal line in the box represents the median of the distribution while the box represents the interquartile range. Whiskers are the default option for the “ggplot2” boxplot function and extend to the most extreme data point, which is no more than 1.5 times the interquartile range from the box. Dots represent outliers (single values exceeding 1.5 interquartile ranges)

References

    1. Coronaviridae Study Group of the International Committee on Taxonomy of V The species severe acute respiratory syndrome-related coronavirus: classifying 2019-nCoV and naming it SARS-CoV-2. Nat Microbiol. 2020;5(4):536–44. doi: 10.1038/s41564-020-0695-z. - DOI - PMC - PubMed
    1. Wu Z, McGoogan JM. Characteristics of and important lessons from the coronavirus disease 2019 (COVID-19) outbreak in China: summary of a report of 72314 cases from the Chinese center for disease control and prevention. JAMA. 2020;323(13):1239–42. doi: 10.1001/jama.2020.2648. - DOI - PubMed
    1. Berlin DA, Gulick RM, Martinez FJ. Severe covid-19. N Engl J Med. 2020;383(25):2451–60. doi: 10.1056/NEJMcp2009575. - DOI - PubMed
    1. Marini JJ, Gattinoni L. Management of covid-19 respiratory distress. JAMA. 2020;323(22):2329–30. doi: 10.1001/jama.2020.6825. - DOI - PubMed
    1. Li X, Xu S, Yu M, Wang K, Tao Y, Zhou Y, et al. Risk factors for severity and mortality in adult COVID-19 inpatients in Wuhan. J Allergy Clin Immunol. 2020;146(1):110–8. doi: 10.1016/j.jaci.2020.04.006. - DOI - PMC - PubMed