. 2023 Feb 27;58(4):306-319.e5.
doi: 10.1016/j.devcel.2023.01.008. Epub 2023 Feb 16.

Runx1 controls auditory sensory neuron diversity in mice

Affiliations

Runx1 controls auditory sensory neuron diversity in mice

Brikha R Shrestha et al. Dev Cell. .

Abstract

Sound stimulus is encoded in mice by three molecularly and physiologically diverse subtypes of sensory neurons, called Ia, Ib, and Ic spiral ganglion neurons (SGNs). Here, we show that the transcription factor Runx1 controls SGN subtype composition in the murine cochlea. Runx1 is enriched in Ib/Ic precursors by late embryogenesis. Upon the loss of Runx1 from embryonic SGNs, more SGNs take on Ia rather than Ib or Ic identities. This conversion was more complete for genes linked to neuronal function than to connectivity. Accordingly, synapses in the Ib/Ic location acquired Ia properties. Suprathreshold SGN responses to sound were enhanced in Runx1CKO mice, confirming the expansion of neurons with Ia-like functional properties. Runx1 deletion after birth also redirected Ib/Ic SGNs toward Ia identity, indicating that SGN identities are plastic postnatally. Altogether, these findings show that diverse neuronal identities essential for normal auditory stimulus coding arise hierarchically and remain malleable during postnatal development.

Keywords: Runx1; auditory; cochlea; diversity; neuronal; neuronal identity; plasticity; spiral ganglion neurons.


Conflict of interest statement

Declaration of interests The authors declare no competing interests.

Figures
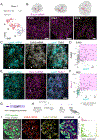
Figure 1:
Figure 1:. Runx1 expression dynamics in SGNs tracks emergence of subtype identities
(A) Runx1 is expressed in Ib and Ic neurons, as shown by t-SNE embedding of Type I SGN scRNA-seq profiles from data in Shrestha et al. (2018). (B-F) Runx1, Calb2, and Lypd1 expression was assessed across development by RNAscope on mid-modiolar sections through cochleae of bhlhe22-Cre/+;Ai14/+ mice. B,C,E show highmagnification views of spiral ganglia as depicted in schematics in B. (B) Runx1 expression in SGNs is broad at E14.5 (left) and more restricted at E16.5 (middle). By E18.5 (right), cells with high and low levels of Runx1 can be clearly distinguished. (C,D) The SGN subtype-specific markers Calb2 and Lypd1 exhibit restricted expression by E18.5, with the number of fluorescent puncta per SGN quantified in D. Although the Calb2 gradient is weak, Lypd1 expression is highly variable, with distinct Lypd1ON and Lypd1OFF cells (white and red arrows, respectively, C). However, some Lypd1ON neurons co-express Calb2 (purple arrow, C; magenta box, D), suggesting incomplete segregation at this stage. (E, F) At birth, Runx1 expression remains segregated and co-varies with Lypd1, quantified in F. Like mature Ic SGNS, neurons with high Runx1 expression tend to be Lypd1ON (purple arrows, E; magenta box, F, Pearson’s correlation coefficient, r=0.63). Lypd1OFF neurons express either low or no Runx1 (red arrows, E; teal box, F), which is observed normally in mature Ib and Ia SGNs, respectively. (G-H) Fate mapping of Runx1+ cells was achieved using Runx1CreER knock-in mice, which express CreER recombinase under regulation of the endogenous Runx1 promoter (G). Tamoxifen was injected at E15.5 and SGN fate was assessed at P25 by RNAscope (H). (I) Many cells that were Runx1+ embryonically went on to become Ic (Lypd1ON, red arrows) or Ib SGNs (Lypd1OFF with low Calb2 expression, purple arrows). A small subset (white arrow) acquired Ia identities (high Calb2). HuD immunostaining (gray) marks all SGN somata. J) Scatterplot based on normalized Calb2 and Lypd1 levels in YFP+ SGNs, as pictured in I. Marginal histograms show distribution of SGNs across Calb2 (red) and Lypd1 (yellow) expression levels. Dotted lines in B, C, E, and I represent outlines hand-drawn based on expression of bhlhe22Cre-induced tdTomato (B,C,E) or YFP (I) in SGN somata. Scale bars: 10 microns
Figure 2:
Figure 2:. SGN subtype composition is altered upon loss of Runx1 expression
(A) Our workflow for FACS-based enrichment and scRNA-seq analysis of SGNs with bhlhe22Cre-induced tdTomato. (B,C) Two-dimensional embedding and unsupervised clustering of neuronal profiles from control animals revealed clusters corresponding to Ia, Ib, Ic and Type II SGNs, identified by markers shown in feature plots (C). (D) Three Type I SGN clusters were also identified in Runx1CKO mice, shown in a cropped and transformed UMAP plot that excludes Type II SGNs and offsets the two genotypes for easier visualization (see Fig. S1E). (E) Neuronal census was drastically different, with more Ia SGNs in Runx1CKO animals (76.6% vs 26.4% in Control) and fewer Ib (13.6% vs 40.2%) and Ic (9.7% vs 33.4%) SGNs. (F) The expanded pool of Ia SGNs in Runx1CKO mice expressed Ia markers (high Calb2, Rxrg, Cacna1b, B3gat1) without any change in Type I (Epha4) vs. Type II (Cilp) markers. Cells in Ib and Ic clusters in the Runx1CKO group did not acquire Ia markers, indicating that gain of Ia-like profiles at the expense of Ib and Ic profiles is the key outcome of Runx1 loss. (G) Assessment of gene expression across the entire pool of SGNs agnostic to their identity revealed that markers known to be Ia-enriched were expressed in more Runx1CKO mutant cells (green) compared to controls (blue). Conversely, Ib/Ic-enriched genes were underrepresented. (H) Cell density in the spiral ganglion was statistically identical between control and Runx1CKO groups (t-test, p=0.42). (I) RNAscope-based evaluation of SGN subtype identities revealed flattened Calb2 gradients and drastic reduction of Lypd1, with SGN somata visualized by HuD immunostaining. (J) K-means clustering of RNAscope-based molecular profiles yielded Calb2HI Lypd1LOW (green), Calb2LOW Lypd1LOW (magenta) and Calb2LOW Lypd1HI (blue) SGN subgroups. A support vector machine (SVM)-based classifier (inset in J) was generated using SGN profiles from control animals and used to predict the identities of Runx1CKO SGNs. (K) This analysis revealed severe reduction in the census of Ic-like Calb2LOW Lypd1HI SGN profiles (blue) and expansion of Ia-like Calb2HI Lypd1LOW (green) identities.
Figure 3:
Figure 3:. Varying influence of Runx1 loss on different gene categories
(A) Feature plots showing examples of Ic-enriched genes expressed ectopically in the Runx1CKO Ia cluster. (B) SGN subtype census determined by a supervised classification scheme designed to detect unresolved or mixed identities. Outer ring represents cell proportions in Runx1CKO and center pie represents those in Control. Ia SGNs are overrepresented in Runx1CKO animals by 118% relative to Control, but 22% of SGNs are of mixed identity. (C) SGN clusters identified using an unsupervised approach were classified a second time using a supervised approach with different gene sets. Rows correspond to the subsets of SGNs that underwent supervised classification and the columns indicate gene subsets used for that analysis. Bottom row (yellow) shows how the classifier performed at detecting synthetically created mixed identities spiked into the training dataset. Supervised classification taking all genes differentially expressed among Ia, Ib, and Ic Control SGNs (leftmost column) showed that the vast majority of mixed identity SGNs are from the Ia cluster in the UMAP plot. Results of supervised classification using gene subsets drawn from different ontological groups are shown in columns 2–5. More Runx1CKO Ia SGNs were assigned Ib (magenta) and Ic (blue) identities when only cell adhesion molecules were used for classification (rightmost column) than when the gene set encoded functionally relevant proteins, ion channels, or chemical synaptic transmission components.
Figure 4:
Figure 4:. Change and stability in synaptic properties with Runx1 loss
(A,B) Ia, Ib, and Ic SGN terminals are arranged along the pillar (p) to modiolar (m) axis of the inner hair cell (IHC). Cochlear wholemounts were immunostained for CtBP2 (magenta) and GluA2 (green) to mark synapses, and for Parvalbumin to mark IHCs (blue). Synapse location was determined by using Imaris to derive global image-centric coordinates (yellow axes in A) for each synaptic element and to determine its position within modiolar or pillar regions, as defined for each IHC after transforming to local IHC-centric coordinates (yellow axes in B, see Methods). Images in B are yz views of maximum intensity projections along the x axis. The projection was clipped to span a single IHC. (C) A modest increase in synapse number was observed in Runx1CKO mice (15.8±3.0) relative to Control (13.4±3.9) (Wilcoxon Rank Sum Test, p=0.006). (D) No change was observed in the proportion of synapses on the modiolar face of IHCs (Control: 0.61±0.19; Runx1CKO: 0.65±0.15; t-test, p=0.26). (E) Kernel density plots depicting distribution of postsynaptic glutamate receptor (GluA2) patch volumes in Control (left) and Runx1CKO (center) groups, separated by modiolar (m, solid line) and pillar (p, dashed line) location; the rightmost plots show the CKO pillar distribution (gray) overlaid with both control distributions. Arrows mark the peak of the distribution for modiolar synapses in CON to highlight rightward shift in the CKO group. (F) Two-dimensional density plots of mean GluA2 volumes on modiolar vs. pillar sides of each IHC. Dotted line depicts line of identity corresponding to equal sizes on modiolar and pillar sides. (G) Comparison of mean modiolar:pillar GluA2 volume ratio of each IHC. Mean ratio in the Control group was well below 1 (0.62±0.08) and the ratio in the Runx1CKO group was significantly higher (0.75±0.06), indicating weakening of the size gradient (Wilcoxon Rank Sum Test, p=0.036). (H) Distribution of presynaptic ribbon volumes in Control and Runx1CKO groups, plotted as in E. Arrows indicate peak of modiolar size distribution in CON to highlight leftward shift in the CKO group. Insets show column charts that compare the width of the density curves at 0.5 probability density (gray line) as a measure of spread in size distribution between modiolar (m) and pillar (p) regions. (I) Two-dimensional density plots of mean ribbon volumes on modiolar vs. pillar sides of each IHC. Dotted line depicts a line of identity corresponding to equal sizes on modiolar and pillar sides. (J) Comparison of mean modiolar:pillar presynaptic ribbon volume ratio of each IHC. Mean ratio in the Control group was above 1 (1.21±0.11), indicating a modiolar-to-pillar gradient. The ratio in the Runx1CKO group was significantly lower and below 1 (0.90±0.04), indicating loss of the size gradient (Wilcoxon Rank Sum Test, p=0.028). C,D,G,J are standard box-and-whisker plots with added colored dots denoting groupwise means.
Figure 5:
Figure 5:. Altered neural response to sound in the cochlea of Runx1CKO mice
Auditory brainstem response (ABR) and distortion product otoacoustic emission (DPOAE) were recorded from Control (blue) and Runx1CKO (magenta) mice. (A) Averaged waveforms of ABRs recorded upon presentation of 16 kHz tone burst at varying sound levels. While SGN responses in peak 1 (arrow) grow as expected with increase in sound level in Control animals, the growth is much larger in the Runx1CKO group. Arrowhead indicates summating potential. (B,C) No difference in ABR (B) or DPOAE (C) thresholds was observed across all sound frequencies tested (Table S4). Plots share the same y-axis labels. (D) Normalized peak 1 amplitude vs. stimulus level plotted for each sound frequency. Plots share the same y-axis. Slopes of the input-output growth functions for the Runx1CKO group were larger by a factor of 1.5 or more compared to the Control group. All plots show mean ± SEM for the respective groups. Results of statistical tests for data in B,C,D can be found in Table S4.
Figure 6:
Figure 6:. Postnatal Runx1 loss redirects SGN subtype identities
(A) Our scRNA-seq workflow for analyzing Runx1+ neurons with (iCKO) or without (iCON) postnatal loss of Runx1. (B) UMAP embedding of scRNA-seq profiles of iCON SGNs revealed three clusters corresponding to Ia, Ib, Ic subtypes, with most neurons located in the Ib and Ic clusters. (C) UMAP embedding of scRNA-seq profiles of SGNs from the iCON (fainter colors) and iCKO (brighter colors) groups revealed that clusters for the two groups largely overlap but differ in terms of cell census. A subset of iCKO cells adjacent to the Ic cluster stands out as a distinct fourth cluster (grey). (D) Proportions of SGN subtypes predicted by a supervised classification approach structured to discern Ia, Ib, Ic or mixed identities; numbers indicate % of SGNs in each group. Loss of Runx1 postnatally resulted in >2.5 fold increase in the proportion of Ia cells at the expense of Ib and Ic identities. In addition, more than a quarter of the SGNs are of mixed identity. (E) UMAP embeddings in which SGNs from the two groups and the clusters they fall in are identified, with clusters for each genotype offset as in Figure 1D. (F) Feature plots show that the expanded pool of Ia SGNs in iCKO (green) express Ia-(top row) and downregulate Ic-specific (bottom) genes. The fourth cluster (grey in E) contains cells that co-express Ia- and Ic-specific genes. (G) Analysis of gene expression patterns without subtype classification indicates that more SGNs express genes associated with the Ia identity in iCKO (green) compared to iCON (blue) SGNs. (H, I) Changes in SGN gene expression patterns were also analyzed by RNAscope on mid-modiolar sections of the P26 cochlea; SGNs visualized by immunostaining for HuD (white) or tdTomato (blue). The Calb2 gradient (red) was shallower among SGNs of iCKO mice (bottom) than in the iCON group (top). Dotted circles highlight tdTomato+ neurons with low Calb2 level in the iCON group but high Calb2 level in the iCKO group. Quantification is shown in a scatterplot of Calb2 and Lypd1 levels in fate-mapped tdTomato+ SGNs from iCON (blue) and iCKO (green) animals (I). Histograms depict changed distributions of Calb2 (top) and Lypd1 (right) expression levels, respectively. Most iCON SGNs (blue) are Lypd1HI Calb2LOW or Lypd1OFF Calb2LOW (i.e., Ic- or Ib-like, respectively). In contrast, those from iCKO animals (green) are Lypd1OFF Calb2LOW or Lypd1OFF Calb2HI (Ib- or Ia-like, respectively). In addition, a subset of cells is Lypd1HI Calb2HI (i.e., of mixed identity). These trends also hold true at the level of individual genes: histograms show shifts toward higher Calb2 expression (red arrow, top) and lower Lypd1 expression (gray arrow, right) among fate-mapped SGNs upon postnatal loss of Runx1. Scale bars in H are 20 μm in the HuD panel (left) and 5μm in the insets (right).

References

    1. Shrestha BR, and Goodrich LV (2019). Wiring the Cochlea for Sound Perception. In The Oxford Handbook of the Auditory Brainstem, Kandler K, ed. (Oxford University Press; ). 10.1093/oxfordhb/9780190849061.013.1. - DOI
    1. Bharadwaj HM, Verhulst S, Shaheen L, Liberman MC, and Shinn-Cunningham BG (2014). Cochlear neuropathy and the coding of supra-threshold sound. Front Syst Neurosci 8. 10.3389/fnsys.2014.00026. - DOI - PMC - PubMed
    1. Rutherford MA, Gersdorff H, and Goutman JD (2021). Encoding sound in the cochlea: from receptor potential to afferent discharge. J Physiol 599, 2527–2557. 10.1113/JP279189. - DOI - PMC - PubMed
    1. Shrestha BR, Chia C, Wu L, Kujawa SG, Liberman MC, and Goodrich L. v (2018). Sensory Neuron Diversity in the Inner Ear Is Shaped by Activity. Cell 174, 1229–1246.e17. 10.1016/j.cell.2018.07.007. - DOI - PMC - PubMed
    1. Petitpré C, Wu H, Sharma A, Tokarska A, Fontanet P, Wang Y, Helmbacher F, Yackle K, Silberberg G, Hadjab S, et al. (2018). Neuronal heterogeneity and stereotyped connectivity in the auditory afferent system. Nat Commun 9, 3691. 10.1038/s41467-018-06033-3. - DOI - PMC - PubMed

Publication types

Substances