. 2023 Mar 15;14(3):237-246.e7.
doi: 10.1016/j.cels.2023.01.003. Epub 2023 Feb 17.

A complete allosteric map of a GTPase switch in its native cellular network

Affiliations

A complete allosteric map of a GTPase switch in its native cellular network

Christopher J P Mathy et al. Cell Syst. .

Abstract

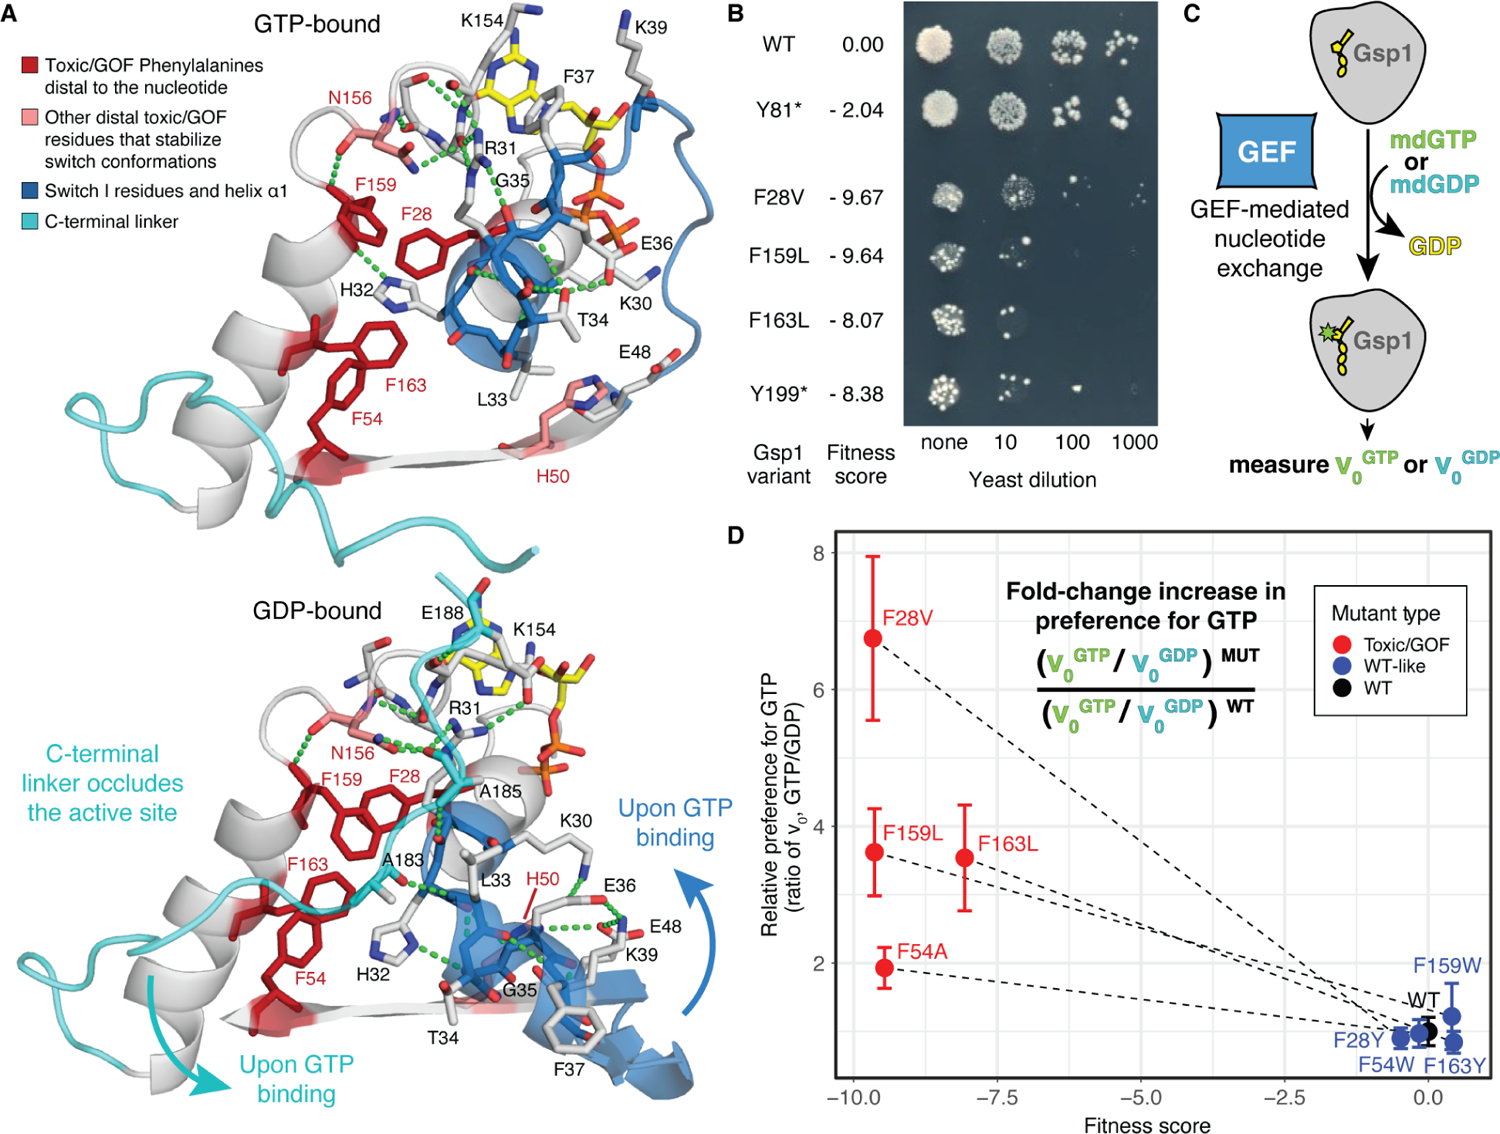
Allosteric regulation is central to protein function in cellular networks. A fundamental open question is whether cellular regulation of allosteric proteins occurs only at a few defined positions or at many sites distributed throughout the structure. Here, we probe the regulation of GTPases-protein switches that control signaling through regulated conformational cycling-at residue-level resolution by deep mutagenesis in the native biological network. For the GTPase Gsp1/Ran, we find that 28% of the 4,315 assayed mutations show pronounced gain-of-function responses. Twenty of the sixty positions enriched for gain-of-function mutations are outside the canonical GTPase active site switch regions. Kinetic analysis shows that these distal sites are allosterically coupled to the active site. We conclude that the GTPase switch mechanism is broadly sensitive to cellular allosteric regulation. Our systematic discovery of new regulatory sites provides a functional map to interrogate and target GTPases controlling many essential biological processes.

Keywords: GTPases; Gsp1; Ran; allostery; cellular regulation; mutational scanning; protein networks.


Conflict of interest statement

Declaration of interests The authors declare no competing interests.

Figures

Figure 1.
Figure 1.. The cellular function of the GTPase Gsp1 is broadly sensitive to mutational perturbations.
(A) All possible single amino acid point mutations are used to exhaustively probe a switch in its native network. (B) Generalizable plasmid swap approach to probe essential genes by mutational mapping. (C) Heatmap showing quantitative fitness scores (log2-transformed changes in variant abundance relative to wild-type) for all Gsp1 mutations. Dot indicates WT synonymous codons; X indicates mutants with low reads in the initial library outgrowth. Conserved G1–5 regions are shown in colors corresponding to structural annotations. see Figure S3. Additional annotated functional regions include the catalytic residue Q71, the GEF interacting region, and the basic patch and acidic tail that interact in the GDP-bound structure (Neuwald et al., 2003). Positions of residues contacting the nucleotide or magnesium cofactor are indicated by yellow bars. Secondary structure assignments for each position in the GTP- and GDP-bound states are shown below. (D) Histogram of scores colored by bin (Methods). Note that 37 of the STOP mutants are toxic/GOF. (E) Distribution of fitness scores ordered by Gsp1 sequence position, colored by mutation type: WT synonymous mutations (green), STOP codon mutations (black), and substitutions (gray).
Figure 2.
Figure 2.. Structural locations of toxic/GOF positions are not exclusive to the active site or the protein core.
(A) Histograms of fitness scores of mutants by structural regions; colors are as in Figure 1D (showing only point mutations, excluding changes that are WT synonymous or to/from STOP; intermediate and beneficial mutations make up the difference to 100%). Fractions are computed within each structural region; n indicates number of mutations. (B) and (C) Two views rotated by 180 degrees of the Gsp1-GTP structure (PDB ID: 3M1I) showing sidechains of toxic/GOF positions in stick and surface representation (excluding the C-terminal extension). (B) Toxic/GOF positions in the GTPase active site shown in blue, other toxic/GOF positions shown in red. Venn diagram below shows overlap of toxic/GOF positions with GTPase active site positions (10 toxic/GOF positions not shown in the structure are in the C-terminal extension). (C) Toxic/GOF core positions shown in red, non-toxic/GOF core positions shown in orange. Venn diagram below shows overlap of toxic/GOF positions with structure core positions.
Figure 3.
Figure 3.. Distal toxic/GOF mutations allosterically alter the balance of the switch states.
(A) Structural depiction of extended networks of interactions in the GTP-bound (top, PDB ID: 3M1I) and GDP-bound states (bottom, PDB ID: 3GJ0). Toxic/GOF mutants characterized in (B) and (D) shown in red. Backbone is colored for the Switch I region (blue) and the C-terminal linker (cyan). The nucleotides are shown in yellow sticks. (B) Plate growth assay showing a dilution series of individual Gsp1 variants expressed together with WT in S. cerevisiae, with corresponding fitness scores from the EMPIRIC assay. (C) FRET-based nucleotide exchange kinetics are measured by adding an excess of mant-labeled fluorescent nucleotide and catalytic amounts of GEF to purified Gsp1 bound to GDP (Methods). (D) Relative change in nucleotide preference for pairs of toxic and wild-type like variants at the Phe residues highlighted in (A), calculated as the ratio of initial rate of exchange to GTP divided by the initial rate of exchange to GDP, normalized to the wild-type ratio. At least four replicates were performed for each variant. Error bars represent the standard deviations of v0 measurements propagated across the division operator (Methods).
Figure 4.
Figure 4.. Allosteric map of the Gsp1 GTPase switch.
(A) Wire representation of Gsp1-GTP (PDB ID: 3M1I, positions 1–180). Toxic/GOF positions are shown in sphere representation. Sphere radius represents number of toxic/GOF mutations at each position. Spheres are colored by functional categories, see (B). The nucleotide and Mg2+cofactor are shown in yellow. (B) Heatmap showing fitness scores (log2-transformed changes in variant abundance relative to wild-type) at toxic/GOF positions ordered by number of toxic/GOF mutations. WT amino acid residue shown below each column. Functional annotations (stars) are shown below and marked in red for positions outside of the active site. (C) Distance of closest sidechain heavy atom at each position to the nucleotide (GTP). Colors are as in (A). Residues not belonging to one of the four categories of functional annotation are indicated by an open circle. (D) Receiver operating characteristic (ROC) curves and area under the curve (AUC) showing the statistical power of Gsp1 fitness scores in classifying an H. sapiens H-Ras mutant as activating, as defined by Ref.. Datasets were trimmed to the 156 sequence positions alignable for Gsp1 and H-Ras (Figure S6). (E) and (F), Overlap of functional sites defined as Gsp1 toxic/GOF and either (E) H-Ras activating or (F) comprising an H-Ras sector defined by statistical coupling analysis (SCA) (Table S1).

References

    1. Motlagh HN, Wrabl JO, Li J, and Hilser VJ (2014). The ensemble nature of allostery. Nature 508, 331–339. - PMC - PubMed
    1. Piazza I, Kochanowski K, Cappelletti V, Fuhrer T, Noor E, Sauer U, and Picotti P (2018). A Map of Protein-Metabolite Interactions Reveals Principles of Chemical Communication. Cell 172, 358–372.e23. - PubMed
    1. Perica T, Mathy CJP, Xu J, Jang GM, Zhang Y, Kaake R, Ollikainen N, Braberg H, Swaney DL, Lambright DG, et al. (2021). Systems-level effects of allosteric perturbations to a model molecular switch. Nature 599, 152–157. - PMC - PubMed
    1. Dokholyan NV (2016). Controlling Allosteric Networks in Proteins. Chem. Rev 116, 6463–6487. - PubMed
    1. Faure AJ, Domingo J, Schmiedel JM, Hidalgo-Carcedo C, Diss G, and Lehner B (2022). Mapping the energetic and allosteric landscapes of protein binding domains. Nature 604, 175–183. - PubMed

Publication types