

Cavitation-induced shock wave behaviour in different liquids
- PMID: 36801674
- PMCID: PMC9975297
- DOI: 10.1016/j.ultsonch.2023.106328
Cavitation-induced shock wave behaviour in different liquids
Abstract
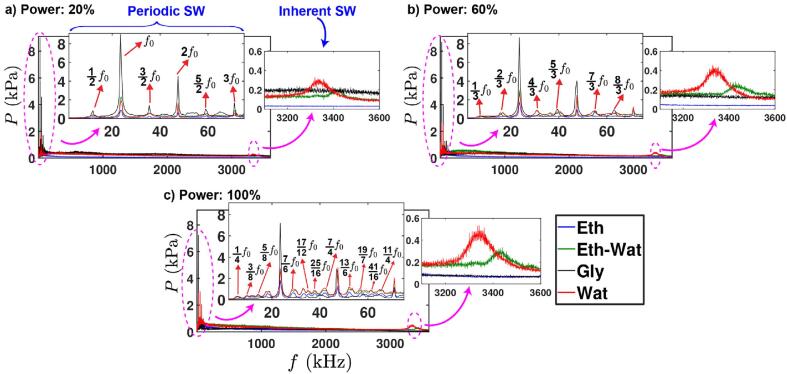
This paper follows our earlier work where a strong high frequency pressure peak has been observed as a consequence of the formation of shock waves due to the collapse of cavitation bubbles in water, excited by an ultrasonic source at 24 kHz. We study here the effects of liquid physical properties on the shock wave characteristics by replacing water as the medium successively with ethanol, glycerol and finally a 1:1 ethanol-water solution. The pressure frequency spectra obtained in our experiments (from more than 1.5 million cavitation collapsing events) show that the expected prominent shockwave pressure peak was barely detected for ethanol and glycerol, particularly at low input powers, but was consistently observed for the 1:1 ethanol-water solution as well as in water, with a slight shift in peak frequency for the solution. We also report two distinct features of shock waves in raising the frequency peak at MHz (inherent) and contributing to the raising of sub-harmonics (periodic). Empirically constructed acoustic pressure maps revealed significantly higher overall pressure amplitudes for the ethanol-water solution than for other liquids. Furthermore, a qualitative analysis revealed that mist-like patterns are developed in ethanol-water solution leading to higher pressures.
Keywords: Bubble cloud; Shock wave; Ultrasonic cavitation.
Copyright © 2023 The Author(s). Published by Elsevier B.V. All rights reserved.
Conflict of interest statement
Declaration of Competing Interest The authors declare that they have no known competing financial interests or personal relationships that could have appeared to influence the work reported in this paper.
Figures


References
-
- L.E. Murr, Shock waves for industrial applications. 1988.
-
- K. Aravindhan, et al. Shock wave as a source of energy to influence on nanomaterials, in: 2017 First International Conference on Recent Advances in Aerospace Engineering (ICRAAE). 2017. IEEE.
-
- Sivakumar A., et al. Effect of shock waves on structural, thermophysical and dielectric properties of glycine phosphate (GPI) crystal. J. Electron. Mater. 2019;48(11):7216–7225.
-
- Aganovic K., et al. Fundamentals of shockwave processing for food. Innov. Food Process. Technol. 2021:395–411.
LinkOut - more resources
Full Text Sources
