. 2023 May:61:102638.
doi: 10.1016/j.redox.2023.102638. Epub 2023 Feb 15.

Ythdf2 promotes pulmonary hypertension by suppressing Hmox1-dependent anti-inflammatory and antioxidant function in alveolar macrophages

Affiliations

Ythdf2 promotes pulmonary hypertension by suppressing Hmox1-dependent anti-inflammatory and antioxidant function in alveolar macrophages

Li Hu et al. Redox Biol. 2023 May.

Abstract

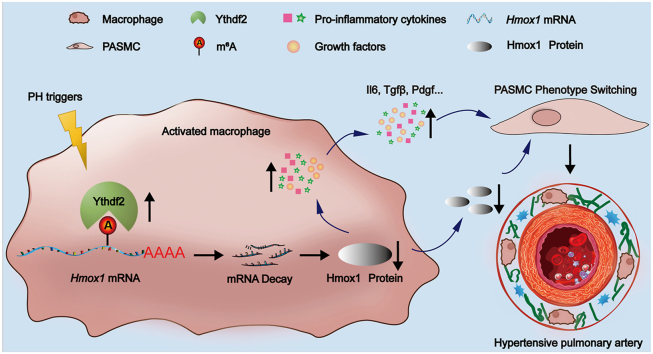
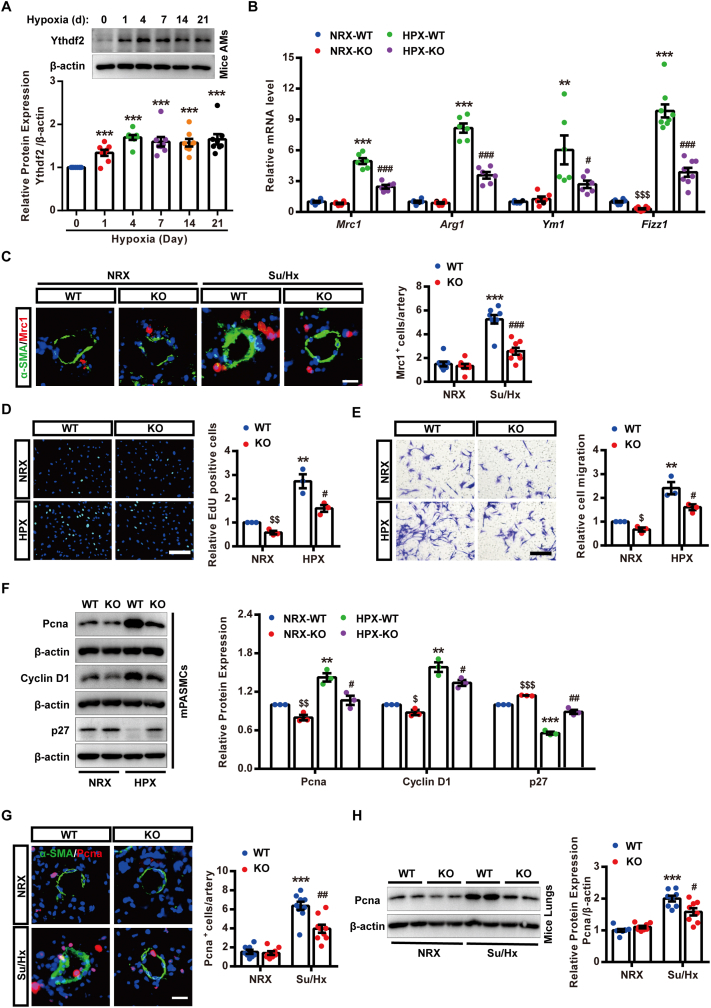
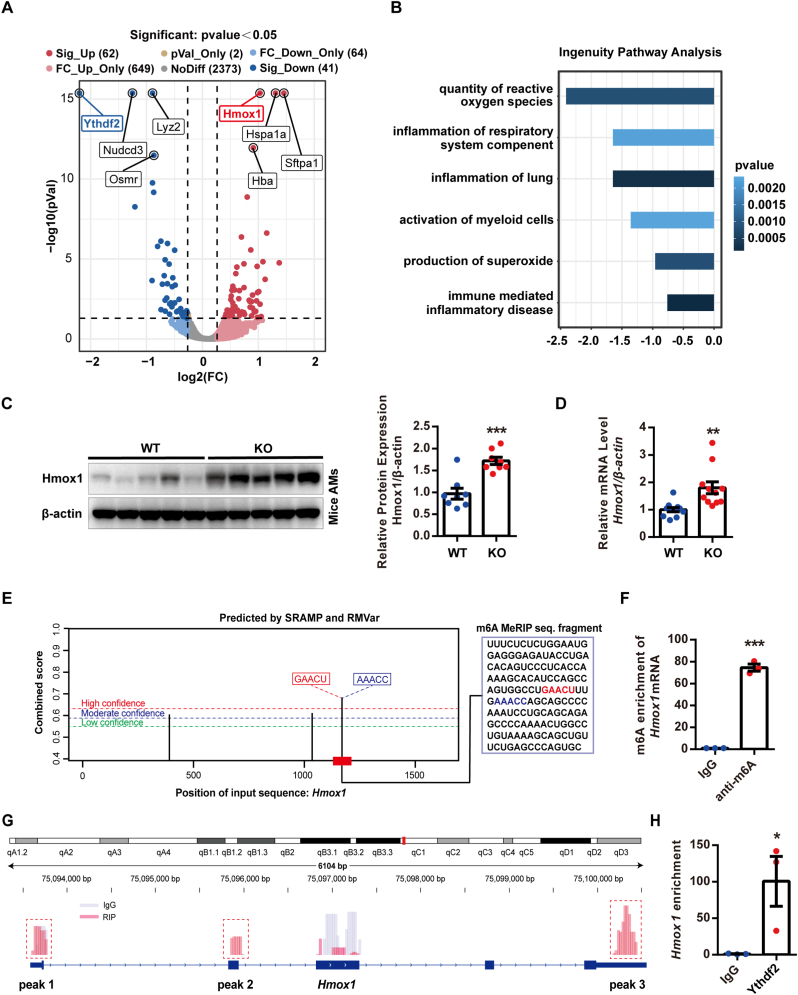
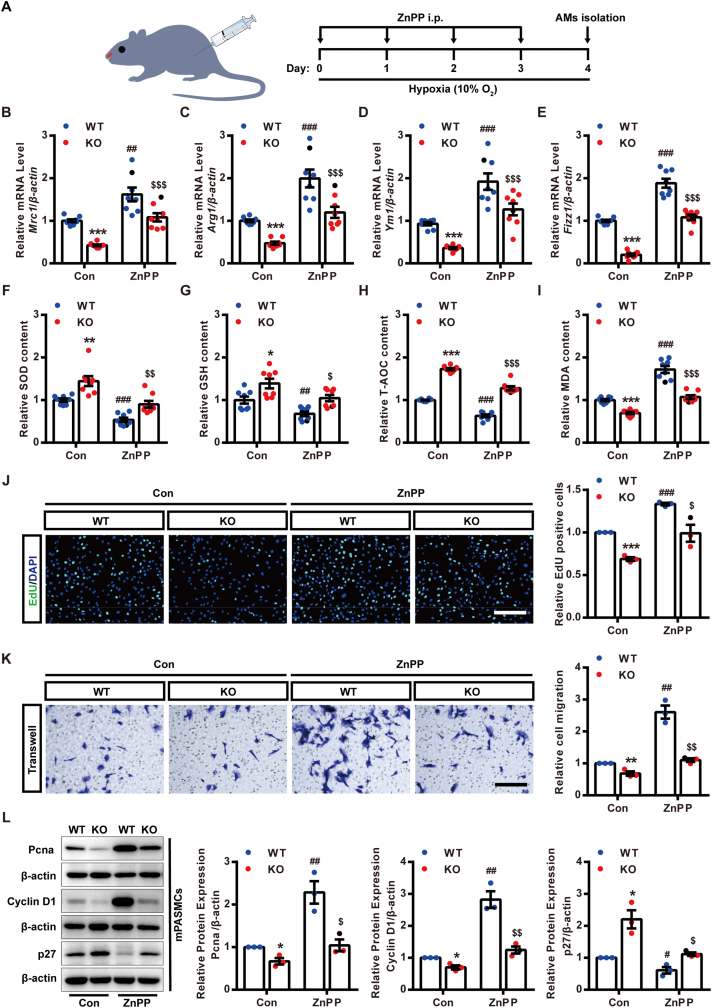
Pulmonary hypertension (PH) is a devastating disease characterized by irreversible pulmonary vascular remodeling (PVR) that causes right ventricular failure and death. The early alternative activation of macrophages is a critical event in the development of PVR and PH, but the underlying mechanisms remain elusive. Previously we have shown that N6-methyladenosine (m6A) modifications of RNA contribute to phenotypic switching of pulmonary artery smooth muscle cells and PH. In the current study, we identify Ythdf2, an m6A reader, as an important regulator of pulmonary inflammation and redox regulation in PH. In a mouse model of PH, the protein expression of Ythdf2 was increased in alveolar macrophages (AMs) during the early stages of hypoxia. Mice with a myeloid specific knockout of Ythdf2 (Ythdf2Lyz2 Cre) were protected from PH with attenuated right ventricular hypertrophy and PVR compared to control mice and this was accompanied by decreased macrophage polarization and oxidative stress. In the absence of Ythdf2, heme oxygenase 1 (Hmox1) mRNA and protein expression were significantly elevated in hypoxic AMs. Mechanistically, Ythdf2 promoted the degradation of Hmox1 mRNA in a m6A dependent manner. Furthermore, an inhibitor of Hmox1 promoted macrophage alternative activation, and reversed the protection from PH seen in Ythdf2Lyz2 Cre mice under hypoxic exposure. Together, our data reveal a novel mechanism linking m6A RNA modification with changes in macrophage phenotype, inflammation and oxidative stress in PH, and identify Hmox1 as a downstream target of Ythdf2, suggesting that Ythdf2 may be a therapeutic target in PH.

Keywords: Alveolar macrophages; Heme oxygenase 1; Inflammation; Oxidant stress; Pulmonary hypertension; Ythdf2.


Conflict of interest statement

Declaration of competing interest The authors declare that they have no known competing financial interests or personal relationships that could have appeared to influence the work reported in this paper.

Figures

Image 1
Graphical abstract
Fig. 1
Fig. 1
Increased Ythdf2 expression in lung macrophages are associated with PH. (A and B) Ythdf2 protein expression levels in lungs of Su/Hx-induced PH mice for indicated weeks (A) or hypoxia treated mice for indicated days (B), n = 6 mice per group. (C–F) Representative immunofluorescence of YTHDF2 (red) and CD68 (green) or F4/80 (green) in lungs of human (C), mouse (D) and rat (E and F), nuclei were counterstained with DAPI (blue), scale bars = 20 μm. (G–I) Representative immunoblots and relative densitometric analysis of Ythdf2 protein expression in AMs of mouse PH model (Su/Hx) and rat PH (MCT and Su/Hx) models normalized to β-actin, n = 8 per group. The data are shown as mean ± SE; **P < 0.01 and ***P < 0.001. Su/Hx = SU5416/hypoxia, AMs = alveolar macrophages. (For interpretation of the references to colour in this figure legend, the reader is referred to the Web version of this article.)
Fig. 2
Fig. 2
Myeloid cell type-specific Ythdf2 deletion prevents development of Su/Hx induced PH in mice. (A) Representative images and quantification of the right ventricular (RV) systolic pressure (RVSP) waves, (B) the ratio of RV to left ventricular (LV) wall plus septum (S) (RV/[LV + S]), (C) representative echocardiographic images and quantification of the velocity time integral (VTI), and the ratio of pulmonary artery accelerate time to ejection time (PAT/PET) in WT and KO mice after 4 weeks of normoxia or Su/Hx treatment. (D) Top, H&E staining and α-SMA (green) immunostaining representative images of lung sections are shown, nuclei were counterstained with DAPI (blue), scale bars = 20 μm. Bottom, quantification of vascular medial thickness and proportion of non, partially, or fully muscularized pulmonary arteries. In A-D, n = 8–9 mice per group. The data are shown as mean ± SE; *P < 0.05, ***P < 0.001 vs WT (NRX) group; #P < 0.05, ##P < 0.01, ###P < 0.001 vs WT (Su/Hx) group. H&E = Hematoxylin and eosin; CSA = cross-sectional area; Su/Hx = SU5416/hypoxia; NRX = normoxia; WT=Ythdf2wildtype; KO=Ythdf2Lyz2 Cre. (For interpretation of the references to colour in this figure legend, the reader is referred to the Web version of this article.)
Fig. 3
Fig. 3
Myeloid Ythdf2 deficiency leads to altered macrophages phenotype and decreased PASMCs proliferation. (A) Ythdf2 protein expression in AMs of hypoxia treated mice for indicated days, n = 8 mice per group. (B) Relative mRNA levels of Mrc1, Arg1, Ym1 and Fizz1 in AMs of WT and KO mice after 4 days of normoxia or hypoxia treatment, n = 6–8 mice per group. (C) Immunofluorescence staining of lung samples from WT and KO mice for α-SMA (green) and Mrc1 (red) after 4 weeks of normoxia or Su/Hx treatment, and Mrc1+ cells were quantified in each pulmonary arteries, scale bars = 20 μm, n = 8–9 mice per group. (D) Representative images and quantification of EdU (green) staining, (E) Transwell assay, and (F) representative immunoblots and relative densitometric analysis of Pcna, Cyclin D1 and p27 protein expression levels in mPASMCs exposed to conditioned media from AMs of WT and KO mice under normoxic or hypoxic conditions treated for 4 days. For D-F, scale bars = 200 μm, and results are representative of 3 separate experiments. (G) Representative immunofluorescence images of lung sections stained with Pcna (red) and α-SMA (green) with cell nuclei labeled with DAPI, scale bars = 20 μm, n = 8–9 mice per group. (H) Protein levels of Pcna in mice lung tissues, n = 8 mice per group. The data are shown as mean ± SE; **P < 0.01, ***P < 0.001, $P < 0.05, $$P < 0.01, $$$P < 0.001 vs WT (NRX) group; #P < 0.05, ##P < 0.01, ###P < 0.001 vs WT (HPX or Su/Hx) group. AMs = alveolar macrophages; HPX = hypoxia; Su/Hx = SU5416/hypoxia; WT=Ythdf2wildtype; KO=Ythdf2Lyz2 Cre; mPASMCs = mouse pulmonary artery smooth muscle cells. (For interpretation of the references to colour in this figure legend, the reader is referred to the Web version of this article.)
Fig. 4
Fig. 4
Hmox1 is a target of m6A modification and Ythdf2 in alveolar macrophages. (A) The volcano plot showing the differentially expressed proteins in AMs of WT and KO mice after 4 days of hypoxia treatment, n = 7 mice per group (significance cutoff P < 0.05). (B) Ingenuity Pathway Analysis of the differentially expressed proteins in (A). (C) Protein levels, (D) and mRNA levels of Hmox1 in AMs of WT and KO mice after 4 days of hypoxia treatment, n = 8–11 mice per group. (E) The potential m6A sites of Hmox1 were predicted by SRAMP (Color lines of green, blue, and red respectively represent low, moderate, high confidence) and RMVar. (F) MeRIP-qPCR was applied to detect the m6A enrichment of Hmox1 mRNA in MH-S cell line. (G) IGV analysis for Ythdf2 binding site of Hmox1 mRNA. (H) RIP analysis of Ythdf2 protein binding to Hmox1 mRNA in MH-S cell line. For E-H, results are representative of 3 separate experiments. The data are shown as mean ± SE; *P < 0.05, **P < 0.01, ***P < 0.001. AMs = alveolar macrophages; MeRIP = m6A RNA immunoprecipitation; SRAMP=Sequence-based RNA Adenosine Methylation site Predictor; RMVar = RNA Modification associated variants; WT=Ythdf2wildtype; KO=Ythdf2Lyz2 Cre. (For interpretation of the references to colour in this figure legend, the reader is referred to the Web version of this article.)
Fig. 5
Fig. 5
Ythdf2 promotes inflammation and oxidative stress by increasing Hmox1 mRNA degradation. (A) Hmox1 protein expression in AMs from hypoxia treated mice for indicated days. (B) The mRNA levels of Hmox1 in AMs isolated from control and hypoxic mice treated for 4 days. (C) ELISA-determined protein concentrations of Hmox1 in the BALF, (D) conditioned media of AMs. (E–I) The content of (E) SOD, (F) GSH, (G) T-AOC and (H) MDA, (I) and mRNA levels of Il10 in AMs from WT and KO mice exposed to normoxia or hypoxia for 4 days. (J) Hmox1 and Ythdf2 protein levels, (K) and mRNA levels in shControl or shYthdf2-lentivirus infected MH-S cells. (L) RT-qPCR analysis of the decay rate of Hmox1 mRNA at the indicated times after Actinomycin D treatment in MH-S cells with or without Ythdf2 silencing. (M) Hmox1 and Ythdf2 protein levels, (N) and mRNA levels in Ythdf2-overexpression adenovirus infected MH-S cells. For A-I, n = 8 mice per group. For J-N, results are representative of 3 separate experiments. The data are shown as mean ± SE; *P < 0.05, **P < 0.01, ***P < 0.001, $$P < 0.01, $$$P < 0.001 vs WT (NRX) or shCon or Vector group; #P < 0.05, ###P < 0.001 vs WT (HPX) group. AMs = alveolar macrophages; BALF = bronchoalveolar lavage fluid; SOD = superoxide dismutase; GSH = glutathione; T-AOC = total antioxidant capacity; MDA = malondialdehyde; NRX = normoxia; HPX = hypoxia; WT=Ythdf2wildtype; KO=Ythdf2Lyz2 Cre.
Fig. 6
Fig. 6
Pharmacological blockade of Hmox1 rescues the anti-inflammatory and anti-oxidant effects of Ythdf2 deficiency in alveolar macrophages. (A) Schematic representation of AMs isolation from mice exposed to hypoxia with ZnPP treatment. (B) Mrc1, (C)Arg1, (D)Ym1 and (E) Fizz1 mRNA levels in AMs from WT and KO mice with or without ZnPP treatment under hypoxia treated for 4 days. (F–I) The content of (F) SOD, (G) GSH, (H) T-AOC, and (I) MDA in AMs from WT and KO mice exposed to hypoxia for 4 days with or without ZnPP treatment. In B–I, n = 8 mice per group. (J) EdU (green) staining, (K) Transwell assay, (L) and immunoblotting of Pcna, Cyclin D1 and p27 in mPASMCs exposed to conditioned media from AMs of WT and KO mice exposed to hypoxia for 4 days with or without ZnPP treatment. For J-K, scale bars = 200 μm, for J-L, results are representative of 3 separate experiments. The data are shown as mean ± SE; *P < 0.05, **P < 0.01, ***P < 0.001, #P < 0.05, ##P < 0.01, ###P < 0.001 vs WT (Con) group; $P < 0.05, $$P < 0.01, $$$P < 0.001 vs KO (Con) group. AMs = alveolar macrophages; ZnPP = Zinc Protoporphyrin; SOD = superoxide dismutase, GSH = glutathione, T-AOC = total antioxidant capacity, MDA = malondialdehyde; WT=Ythdf2wildtype; KO=Ythdf2Lyz2 Cre; mPASMCs = mouse pulmonary artery smooth muscle cells. (For interpretation of the references to colour in this figure legend, the reader is referred to the Web version of this article.)
Fig. 7
Fig. 7
The protective effect of Ythdf2 myeloid deficiency against PH was abrogated by ZnPP treatment in mice. (A) Schematic presentation of experimental protocol for the treatment of WT and KO mice with ZnPP in the Su/Hx-induced PH model. (B) Right ventricular systolic pressure, (C) changes in the right ventricular structure shown as the ratio of the right ventricular (RV) and the left ventricular plus septum (LV + septum) mass, (D) echocardiographic assessment of right ventricular systolic function depicted by velocity time integral (VTI), and the ratio of pulmonary artery accelerate time to ejection time (PAT/PET), in WT and KO mice under Su/Hx exposure with or without ZnPP treatment. (E) Representative images of H&E staining and α-SMA (green) immunohistochemical staining of the distal pulmonary arteries, quantification of medial wall thickness index, and proportion of non, partially, or fully muscularized pulmonary arteries are shown, scale bars = 20 μm. The data are shown as mean ± SE, and n = 8 mice per group; *P < 0.05, **P < 0.01, ***P < 0.001, #P < 0.05, ##P < 0.01 vs WT (Con) group; $P < 0.05, $$P < 0.01, $$$P < 0.001 vs KO (Con) group. Su/Hx = SU5416/hypoxia; WT=Ythdf2wildtype; KO=Ythdf2Lyz2 Cre; ZnPP = Zinc Protoporphyrin. (For interpretation of the references to colour in this figure legend, the reader is referred to the Web version of this article.)
Fig. 8
Fig. 8
A schematic diagram indicates the mechanisms of how Ythdf2 in macrophages promote pulmonary vascular remodeling during PH pathogenesis.

References

    1. Hassoun P.M. Pulmonary arterial hypertension. N. Engl. J. Med. 2021;385(25):2361–2376. - PubMed
    1. Ruopp N.F., Cockrill B.A. Diagnosis and treatment of pulmonary arterial hypertension: a review. JAMA. 2022;327(14):1379–1391. - PubMed
    1. Hashimoto-Kataoka T., et al. Interleukin-6/interleukin-21 signaling axis is critical in the pathogenesis of pulmonary arterial hypertension. Proc. Natl. Acad. Sci. U. S. A. 2015;112(20):E2677–E2686. - PMC - PubMed
    1. Nicolls M.R., Voelkel N.F. The roles of immunity in the prevention and evolution of pulmonary arterial hypertension. Am. J. Respir. Crit. Care Med. 2017;195(10):1292–1299. - PMC - PubMed
    1. Rabinovitch M., et al. Inflammation and immunity in the pathogenesis of pulmonary arterial hypertension. Circ. Res. 2014;115(1):165–175. - PMC - PubMed

Publication types

LinkOut - more resources