. 2023 Feb 17;6(5):e202201770.
doi: 10.26508/lsa.202201770. Print 2023 May.

BRG1 HSA domain interactions with BCL7 proteins are critical for remodeling and gene expression

Affiliations

BRG1 HSA domain interactions with BCL7 proteins are critical for remodeling and gene expression

Nicholas Dietrich et al. Life Sci Alliance. .

Abstract

The SWI/SNF complex remodels chromatin in an ATP-dependent manner through the subunits BRG1 and BRM. Chromatin remodeling alters nucleosome structure to change gene expression; however, aberrant remodeling can result in cancer. We identified BCL7 proteins as critical SWI/SNF members that drive BRG1-dependent gene expression changes. BCL7s have been implicated in B-cell lymphoma, but characterization of their functional role within the SWI/SNF complex has been limited. This study implicates their function alongside BRG1 to drive large-scale changes in gene expression. Mechanistically, the BCL7 proteins bind to the HSA domain of BRG1 and require this domain for binding to chromatin. BRG1 proteins without the HSA domain fail to interact with the BCL7 proteins and have severely reduced chromatin remodeling activity. These results link the HSA domain and the formation of a functional SWI/SNF remodeling complex through the interaction with BCL7 proteins. These data highlight the importance of correct formation of the SWI/SNF complex to drive critical biological functions, as losses of individual accessory members or protein domains can cause loss of complex function.


Conflict of interest statement

The authors declare that they have no conflict of interest.

Figures

Figure 1.
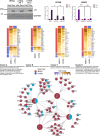
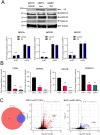
Figure 1.. HSA domain of BRG1 is necessary to drive a cancer- and senescence-associated gene expression profile.
(A) Detection by Western blot of iBRG1 and i∆HSA proteins in SW-13 cells. Whole-cell lysates were probed with anti-V5 antibody (top) or anti-GAPDH (bottom) from stable cell lines treated with 10 μg/ml doxycycline for 24 h. (B) Real-time quantitative PCR (qRT-PCR) was used to determine the gene expression of BRG1 target genes in SW-13, iBRG1, and i∆HSA cells in vehicle- or doxycycline (Dox)-treated conditions. Data are the fold change compared with the vehicle conditions from three biological replicates, and error bars represent the SD. ** represents P < 0.01, *** represents P < 0.001, and **** represents P < 0.0001 (two-way ANOVA). (C) Left: Venn diagram of the overlapping numbers of genes comparing iBRG1 (red) and i∆HSA (blue) cells after 24 h of induction by doxycycline. Right: volcano plots displaying the differentially expressed genes identified in iBRG1 (left, red) or i∆HSA (right, blue) cells treated for 24 h of doxycycline compared with vehicle-treated cells. (D) Real-time quantitative PCR of newly identified target genes of iBRG1 or i∆HSA after 24 h of doxycycline treatment. Data are the fold change compared with the control conditions from three biological replicates, and error bars represent the SD. ** represents P < 0.01, *** represents P < 0.001, and **** represents P < 0.0001 (two-way ANOVA).
Figure S1.
Figure S1.. Top left: Western blot of iBRG1 or i∆HSA proteins in SW-13 cells from the tested iBRG1 cell line and two independently derived i∆HSA cell lines (Alt1 or Alt2).
Whole-cell lysates were probed with anti-V5 antibody (top) or anti-GAPDH (bottom) from stable cell lines treated with 10 μg/ml doxycycline for 24 h. Top right: real-time quantitative PCR (qRT-PCR) was used to determine the gene expression of CRYAB or SPARC in iBRG1 or two independently derived i∆HSA cell lines (Alt1 or Alt2) in vehicle- or doxycycline (Dox)-treated conditions. Data are the fold change compared with the vehicle conditions from three biological replicates, and error bars represent the SD. * represents P < 0.05, ** represents P < 0.01, and **** represents P < 0.0001 (two-way ANOVA). Bottom: pathway analysis of all DEGs identified by RNA-seq in iBRG1 or i∆HSA cells after 24 h of doxycycline treatment. Cluster plots in the center display the genes that make up each pathway with iBRG1 DEGs shown in red and i∆HSA DEGs shown in blue, and co-regulated genes displaying shared red and blue circles. Heatmaps (surrounding) of each pathway cluster and the DEGs found in those pathways. Within the heatmaps, red bars represent DEGs from iBRG1-expressing cells and blue bars represent DEGs from i∆HSA-expressing cells.
Figure S2.
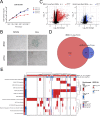
Figure S2.. Long-term BRG1 expression drives senescence and extensive gene expression changes.
(A) Total cells from iBRG1 or i∆HSA cells grown in continuous vehicle or continuous doxycycline (Dox) conditions. Each point represents the average cell number from three biological replicates, and the error bars represent the SD. (B) Senescence-associated beta-galactosidase staining from iBRG1 or i∆HSA cells after 14 d of continuous vehicle or doxycycline treatment. Scale bar is equivalent to 100 μm. (C) Volcano plots displaying the differentially expressed genes identified in iBRG1 (left, red) or i∆HSA (right, blue) treated for 14 d of continuous doxycycline compared with vehicle-treated cells. (D) Venn diagram of the overlaps between DEGs identified after 14 d of continuous doxycycline treatment of iBRG1 (orange) or i∆HSA (purple) cells. (E) Pathway analysis of all DEGs identified by RNA-seq in iBRG1 or i∆HSA cells after 14 d of continuous doxycycline treatment compared with vehicle treatment. The pathways are listed on the left, with the P-value of enrichment next to the pathway names in shades of red (iBRG1) or blue (i∆HSA). Above is the colored representation of the genes (listed at the bottom) of whether the gene was a hit in iBRG1 (red) or i∆HSA (blue) cells. Within the heatmap, the colors represent if that gene is a DEG in the pathway and the cell line (iBRG1/red, i∆HSA/blue, and iBRG1 + i∆HSA/purple).
Figure S3.
Figure S3.. Long-term BRG1 expression drives senescence.
Top: additional replicates of senescence-associated β-galactosidase staining from iBRG1 or i∆HSA cells after 14 d of continuous vehicle- or Dox-treated conditions. Bottom: pathway analysis of all DEGs identified by RNA-seq in iBRG1 or i∆HSA cells after 14 d of continuous doxycycline treatment compared with vehicle treatment. Scale bar is equivalent to 100 μm.
Figure 2.
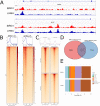
Figure 2.. Loss of the HSA domain does not alter binding of BRG1 to transcriptional start sites.
(A) CUT&RUN coverage of iBRG1 (red) or i∆HSA (blue) at SRPX2 and MYOF, two genes regulated by iBRG1 expression after 24 h. (B) Heatmaps and metaplots of iBRG1 or i∆HSA CUT&RUN signal in a 6-kb window around all transcriptional start sites, and they are scaled to represent all gene bodies. (C) Heatmaps and metaplots of iBRG1 or i∆HSA CUT&RUN signal at called iBRG1 or i∆HSA CUT&RUN peaks. (D) Venn diagram of overlaps between iBRG1 and i∆HSA CUT&RUN peaks. (E) Annotation of genomic regions of iBRG1 and i∆HSA CUT&RUN peaks.
Figure 3.
Figure 3.. BRG1 requires the HSA domain to alter chromatin accessibility.
(A) Top left: table of peaks and DACs identified from ATAC-seq in SW-13, iBRG1, or i∆HSA cells. Top right: Venn diagram of DACs identified in iBRG1 or i∆HSA cells comparing Dox with vehicle conditions. Bottom: heatmap of DACs identified by ATAC-seq and the genomic locations in SW-13, iBRG1, or i∆HSA cells. (B) Top: percent distributions of each sample peak at genomic location types. Bottom: percent distribution of each sample peaks at annotated chromatin states. (C) Top: metaplot profile of ATAC-seq coverage from SW-13, iBRG1, or i∆HSA cells after doxycycline treatment at DACs identified from iBRG1-expressing cells alone and i∆HSA-expressing cells alone, or shared between iBRG1- and i∆HSA-expressing cells. Bottom: heatmap of ATAC-seq coverage at DACs described in the metaplot, scaled so that each window is the same physical size independent of the number of rows. (D) Metaplot and heatmap of iBRG1 or i∆HSA at all peaks from iBRG1-expressing cells or i∆HSA-expressing cells. (E) ATAC-seq coverage of all samples at CRYAB, CSF1, SRPX2, or SPARC. (F) Left top: Venn diagrams of iBRG1 Dox ATAC-seq peaks and iBRG1 CUT&RUN peaks. Left bottom: Venn diagrams of i∆HSA Dox ATAC-seq peaks and i∆HSA CUT&RUN peaks. Right: heatmaps and metaplots of SW-13, iBRG1, or i∆HSA ATAC-seq coverage at iBRG1 or i∆HSA CUT&RUN peaks.
Figure 4.
Figure 4.. HSA mutant interacts with a subset of the SWI/SNF complex members bound by WT BRG1 and is necessary for increased BCL7 protein levels.
(A) Co-immunoprecipitation–mass spectrometry data comparing the SWI/SNF complex members identified between the iBRG1 line and the i∆HSA cell line. The SWI/SNF complex protein name is found in the first column, followed by the percent of the protein covered by the mass spectrometry experiment, the number of unique peptides identified and the MS score, and the average spectral counts from each protein pulled down by the V5 antibody used to detect iBRG1 or i∆HSA in the second column. Each column represents the average from three biological replicates. The proteins are colored from blue to white by spectrum average with white being the lowest (zero) and blue being the highest. The protein names highlighted in purple and crossed out were not found in the i∆HSA pulldown. (B) Co-immunoprecipitation of SWI/SNF proteins from iBRG1 or i∆HSA cells after 24 h of doxycycline treatment. The top rows indicate the 5% input, or the antibody used for the immunoprecipitation (IgG, V5, BCL7B, or BAF53a), and the labels on the right indicate the antibody used for detection on the immunoblot (top: V5; bottom: BAF53a). (C) Co-immunoprecipitation displaying the interaction between BCL7C and BRG1 in iBRG1 or i∆HSA cells after 24 h of doxycycline treatment. The top rows indicate the 5% input, or the antibody used for the immunoprecipitation (top: V5; bottom: BCL7C), and the label on the right indicates the antibody used for detection on the immunoblot (V5). (D) Co-immunoprecipitation displaying the interaction between BAF155 and iBRG1 or i∆HSA. The top rows indicate the 5% input, or the antibody used for the immunoprecipitation (IgG, V5, BAF45b, or BAF155), and the label on the right indicates the antibody used for the detection on the immunoblot (V5 or BAF155). (E) Co-immunoprecipitation displaying interaction between GLTSCR1L and BAF45b with iBRG1 or i∆HSA. The top rows indicate the 5% input, or the antibody used for the immunoprecipitation (IgG, V5, BAF45b, or GLTSCR1L), and the label on the right indicates the antibody used for the detection on the immunoblot (V5 or GLTSCR1L). (F) Immunoblot detection of BRG1, BCL7A, BCL7B, and tubulin (left) or BRG1, BCL7C, and GAPDH (right) protein levels with increasing levels of iBRG1 or i∆HSA expression by doxycycline treatment. Each blot contains equivalent levels of protein per lane, and the levels of doxycycline used for 24 h increase from left to right. (G) Differential salt extraction of BRG1 in iBRG1 or i∆HSA cells after 24 h of doxycycline treatment. Left is the immunodetection of BRG1 or i∆HSA in doxycycline-treated conditions. Right is the average fraction of the total protein extracted in each salt concentration in iBRG1 or i∆HSA cells from two replicates. Error bars represent the SD. (H) Differential salt extraction of BCL7C in iBRG1 or i∆HSA cells after 24 h of doxycycline treatment. Left is the immunodetection of BRG1 or i∆HSA in doxycycline-treated conditions. Right is the average fraction of the total protein extracted in each salt concentration in iBRG1 or i∆HSA cells from two replicates. Error bars represent the SD. (I) Differential salt extraction of BAF53a in iBRG1 or i∆HSA cells after 24 h of doxycycline treatment. Left is the immunodetection of BRG1 or i∆HSA in doxycycline-treated conditions. Right is the average fraction of the total protein extracted in each salt concentration in iBRG1 or i∆HSA cells. Error bars represent the SD. (J) Differential salt extraction of BAF155 in iBRG1 or i∆HSA cells after 24 h of doxycycline treatment. Left is the immunodetection of BRG1 or i∆HSA in doxycycline-treated conditions. Right is the average fraction of the total protein extracted in each salt concentration in iBRG1 or i∆HSA cells. Error bars represent the SD. Source data are available for this figure.
Figure S4.
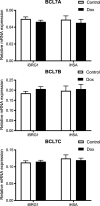
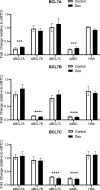
Figure S4.. RNA levels of BCL7A, BCL7B, and BCL7C are not affected by iBRG1 or i∆HSA expression.
Real-time quantitative PCR of BCL7A (top), BCL7B (middle), or BCL7C (bottom) in iBRG1 or i∆HSA cells after 24 h of treatment by doxycycline (tet) or vehicle.
Figure 5.
Figure 5.. BCL7 proteins are necessary for gene expression changes driven by BRG1.
(A) Top: immunoblot detection of BRG1-V5, tubulin, BCL7A, BCL7B, or BCL7C in iBRG1 cells with and without knockdown of BCL7A, BCL7B, and BCL7C by siRNA. Left is vehicle-treated iBRG1 cells, center left is iBRG1 cells after 24 h of doxycycline treatment, center is iBRG1 cells after 24 h of doxycycline treatment, and right is iBRG1 cells after 24 h of doxycycline treatment and BCL7A, BCL7B, and BCL7C combined knockdown. Bottom: real-time quantitative PCR of BCL7A, BCL7B, or BCL7C expression in iBRG1 cells after knockdown of BCL7A, BCL7B, and BCL7C or in i∆HSA cells with or without doxycycline treatment. (B) Real-time quantitative PCR of BRG1 target genes (CD44, CDKN1A, CRYAB, or SPARC) after knockdown in iBRG1 cells of GFP (negative control) or BCL7A + BCL7B + BCL7C followed by 24 h of doxycycline treatment. Data are the fold change compared with the control conditions in each siRNA or cell line condition from three biological replicates, and error bars represent the SD. * represents P < 0.05, ** represents P < 0.01, and *** represents P < 0.001, when compared to siNTC conditions (Welch’s t test). (C) Left: Venn diagram of DEGs identified by RNA-seq after knockdown BCL7A + BCL7B + BCL7C or a non-template control in iBRG1 cells after 24 h of induction by doxycycline. Right: volcano plots of DEGs identified by RNA-seq in iBRG1 cells after knockdown of a non-template control (left, red) or of BCL7A + BCL7B + BCL7C (right, blue).
Figure S5.
Figure S5.. mRNAs of BCL7A (top), BCL7B (middle), and BCL7C (bottom) are specifically reduced by siRNAs targeting each individual gene or all genes together.
Real-time quantitative PCR of BCL7A, BCL7B, or BCL7C after knockdown in iBRG1 cells after siRNA knockdown targeting each gene or all genes together, or in i∆HSA cells after 24 h of doxycycline treatment or treatment by vehicle. Data are the fold change compared with the control conditions in iBRG1 cells from three biological replicates, and error bars represent the SD. *** represents P < 0.01, and **** represents P < 0.001 (Welch’s t test).

Similar articles

Cited by

References

    1. Alpsoy A, Dykhuizen EC (2018) Glioma tumor suppressor candidate region gene 1 (GLTSCR1) and its paralog GLTSCR1-like form SWI/SNF chromatin remodeling subcomplexes. J Biol Chem 293: 3892–3903. 10.1074/jbc.RA117.001065 - DOI - PMC - PubMed
    1. Baliñas-Gavira C, Rodríguez MI, Andrades A, Cuadros M, Álvarez-Pérez JC, Álvarez-Prado ÁF, Yébenes VGd, Sánchez-Hernández S, Fernández-Vigo E, Muñoz J, et al. (2020) Frequent mutations in the amino-terminal domain of BCL7A impair its tumor suppressor role in DLBCL. Leukemia 34: 2722–2735. 10.1038/s41375-020-0919-5 - DOI - PubMed
    1. Benjamini Y, Hochberg Y (1995) Controlling the false discovery rate: A practical and powerful approach to multiple testing. J R Stat Soc Ser B (Methodological) 57: 289–300. 10.1111/j.2517-6161.1995.tb02031.x - DOI
    1. Buenrostro JD, Giresi PG, Zaba LC, Chang HY, Greenleaf WJ (2013) Transposition of native chromatin for fast and sensitive epigenomic profiling of open chromatin, DNA-binding proteins and nucleosome position. Nat Methods 10: 1213–1218. 10.1038/nmeth.2688 - DOI - PMC - PubMed
    1. Campisi J (1997) Aging and cancer: The double-edged sword of replicative senescence. J Am Geriatr Soc 45: 482–488. 10.1111/j.1532-5415.1997.tb05175.x - DOI - PubMed

Publication types

MeSH terms

Substances