. 2023 Mar 29;43(13):2362-2380.
doi: 10.1523/JNEUROSCI.1492-22.2023. Epub 2023 Feb 17.

Neural Substrates of Body Ownership and Agency during Voluntary Movement

Affiliations

Neural Substrates of Body Ownership and Agency during Voluntary Movement

Zakaryah Abdulkarim et al. J Neurosci. .

Abstract

Body ownership and the sense of agency are two central aspects of bodily self-consciousness. While multiple neuroimaging studies have investigated the neural correlates of body ownership and agency separately, few studies have investigated the relationship between these two aspects during voluntary movement when such experiences naturally combine. By eliciting the moving rubber hand illusion with active or passive finger movements during functional magnetic resonance imaging, we isolated activations reflecting the sense of body ownership and agency, respectively, as well as their interaction, and assessed their overlap and anatomic segregation. We found that perceived hand ownership was associated with activity in premotor, posterior parietal, and cerebellar regions, whereas the sense of agency over the movements of the hand was related to activity in the dorsal premotor cortex and superior temporal cortex. Moreover, one section of the dorsal premotor cortex showed overlapping activity for ownership and agency, and somatosensory cortical activity reflected the interaction of ownership and agency with higher activity when both agency and ownership were experienced. We further found that activations previously attributed to agency in the left insular cortex and right temporoparietal junction reflected the synchrony or asynchrony of visuoproprioceptive stimuli rather than agency. Collectively, these results reveal the neural bases of agency and ownership during voluntary movement. Although the neural representations of these two experiences are largely distinct, there are interactions and functional neuroanatomical overlap during their combination, which has bearing on theories on bodily self-consciousness.SIGNIFICANCE STATEMENT How does the brain generate the sense of being in control of bodily movement (agency) and the sense that body parts belong to one's body (body ownership)? Using fMRI and a bodily illusion triggered by movement, we found that agency is associated with activity in premotor cortex and temporal cortex, and body ownership with activity in premotor, posterior parietal, and cerebellar regions. The activations reflecting the two sensations were largely distinct, but there was overlap in premotor cortex and an interaction in somatosensory cortex. These findings advance our understanding of the neural bases of and interplay between agency and body ownership during voluntary movement, which has implications for the development of advanced controllable prosthetic limbs that feel like real limbs.

Keywords: fMRI; multisensory integration; rubber hand illusion; somatosensation; voluntary action.


Figures

Figure 1.
Figure 1.
A, A montage of what the participants would see lying inside the MR scanner. The white semiopaque field illustrates the dark cloth that was used to cover the participant's real right hand from view. The participant's hand and the rubber hand are seen resting on a small table. The index finger of the rubber hand as well as the participant's hand are placed inside a plastic ring, which is connected to the two most lateral vertical rods seen in B–E. B–E, Illustration of the levers of the moving rubber hand illusion setup under the table that moved the index finger of the participant and the rubber hand. In B, the levers are in a relaxed position with the index finger of the rubber hand and the participant's hand resting on the table. In C, both the participant's index finger and the index finger of the rubber hand are lifted off the table. The two levers are connected to each other through a pin. In this configuration, the participants could lift their index finger, which would simultaneously lift the index finger of the rubber hand (active synchronous conditions), or the experimenter could push the index finger of the participant up by pressing on the rod underneath the participant's index finger (as seen in the image; passive synchronous condition). D, E, The two fingers have been decoupled by removing the pin holding the two levers together. In this configuration, the index finger of the rubber hand and the participant's hand could be moved independently by the experimenter, causing delayed movements (∼0.5 s) of the index of the rubber hand in the asynchronous conditions (active and passive asynchronous conditions).
Figure 2.
Figure 2.
A, Schematic illustration of the design matrix for the 2 × 2 × 2 factorial giving rise to eight unique conditions. B, All eight unique conditions and their acronyms used in this article. Each letter indicates the movement type (active or passive), the timing of the movements (synchronous or asynchronous), and the orientation of the rubber hand relative to the participant's hand (congruent or incongruent), and is followed by a subscripted letter indicating which factor the letter belongs to. M, Movement type; T, timing; O, orientation.
Figure 3.
Figure 3.
Schematic illustration of the fMRI block design. Each stimulus block consisted of one of the eight conditions with 45 s of continuous finger tapping, either actively or passively. Between each block, there was a 5 s rest baseline. After every four blocks, there was a 30 s rest condition. Four of the eight conditions were repeated four times in each run since the congruent and incongruent conditions were split into separate runs. The participants received auditory instructions at the beginning and end of each block that consisted of a 1-s-long prerecorded voice saying, “tap finger” or “relax.”
Figure 4.
Figure 4.
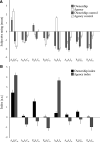
A, The results from the behavioral experiment. These results show a double dissociation between the sense of body ownership and sense of agency in our full factorial design. The AMSTCO condition displayed high ratings for both sense of body ownership and sense of agency. The PMSTCO condition showed high ownership ratings and low agency ratings, whereas the AMSTIO condition showed high agency ratings and low ownership ratings. Bars represent mean ratings, and error bars indicate the SEM. B, Ownership and agency indices calculated by subtracting the pooled ownership and agency control ratings from the pooled ownership and agency ratings, respectively. Bars indicate the means, and error bars indicate the SEM.
Figure 5.
Figure 5.
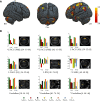
A, Overview of the brain regions that display activation reflecting the sense of body ownership over the rubber hand defined by the contrast [(PMSTCO – PMATCO) – (PMSTIO – PMATIO)] + [(AMSTCO – AMATCO) – (AMSTIO – AMATIO)]. For display purposes only, the activations are projected onto a three-dimensional rendering of a standard brain with a threshold of p < 0.005 (uncorrected for multiple comparisons, k ≥ 5). RH, Right hemisphere; LH, left hemisphere; Occ, occipital view; CS, central sulcus. B, Bar charts displaying the parameter estimates (a.u.) and SEs for the major peaks of activation. The coordinates are given in MNI space. The peaks are displayed in representative sections indicated by a dotted white circle on an activation map (p < 0.005, uncorrected for display purposes). L, Left; R, right; PrCG, precentral gyrus; PoCG, postcentral gyrus; IPS, intraparietal sulcus; SMG, supramarginal gyrus. Asterisks indicate activation peaks that survive small-volume correction (*p < 0.05, corrected; **p < 0.01); the peaks without an asterisk did not survive correction and are reported in Table 2 with their uncorrected p value. All peaks from the contrast are reported in Extended Data Table 5-1. Condition key: first letter A or P (active or passive) with subscript M (movement); second letter S or A (synchronous or asynchronous) with subscript T (timing); and third letter C or I (congruent or incongruent) with subscript O (orientation).
Figure 6.
Figure 6.
Correlation between behavioral ownership ratings (x-axis) and parameter estimates from the ownership contrast (y-axis; in a.u.) in the left precentral sulcus (PrCS; −24, −12, 70), left postcentral gyrus (PoCG; −24, −40, 68), left postcentral sulcus (PoCS; −22, −38, 70), and left cerebellum (−26, −46, −26). Pearson's r and p values are given in each respective correlation plot. The peaks are displayed as activation maps (p < 0.005, uncorrected) on representative sections of an average anatomic section and are indicated with a dotted white line.
Figure 7.
Figure 7.
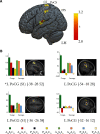
A, Overview of the brain regions that display activation reflecting the sense of agency defined by the contrast [(AMSTCO – PMSTCO) – (AMATCO – PMATCO)] + [(AMSTIO – PMSTIO) – (AMATIO – PMATIO)]. For display purposes only, the activations are projected onto a three-dimensional render of a standard brain with a threshold of p < 0.005 (uncorrected for multiple comparisons, k ≥ 5). RH, Right hemisphere; LH, left hemisphere; STS, superior temporal sulcus; CS, central sulcus. B, Bar charts displaying the parameter estimates (in a.u.) and SEs for the major peaks of activation. The coordinates are given in MNI space. The peaks are displayed in representative sections indicated by a dotted white circle (p < 0.005, uncorrected for display purposes). L, Left; R, right; PrCG, precentral gyrus; PoCG, postcentral gyrus; IPS, intraparietal sulcus; STG, superior temporal gyrus. *Activation peaks that survive small-volume correction (p < 0.05, corrected); the peaks without an asterisk did not survive correction and are reported in Table 2 with their uncorrected p value. All peaks from the contrast are reported in Extended Data Table 7-1.
Figure 8.
Figure 8.
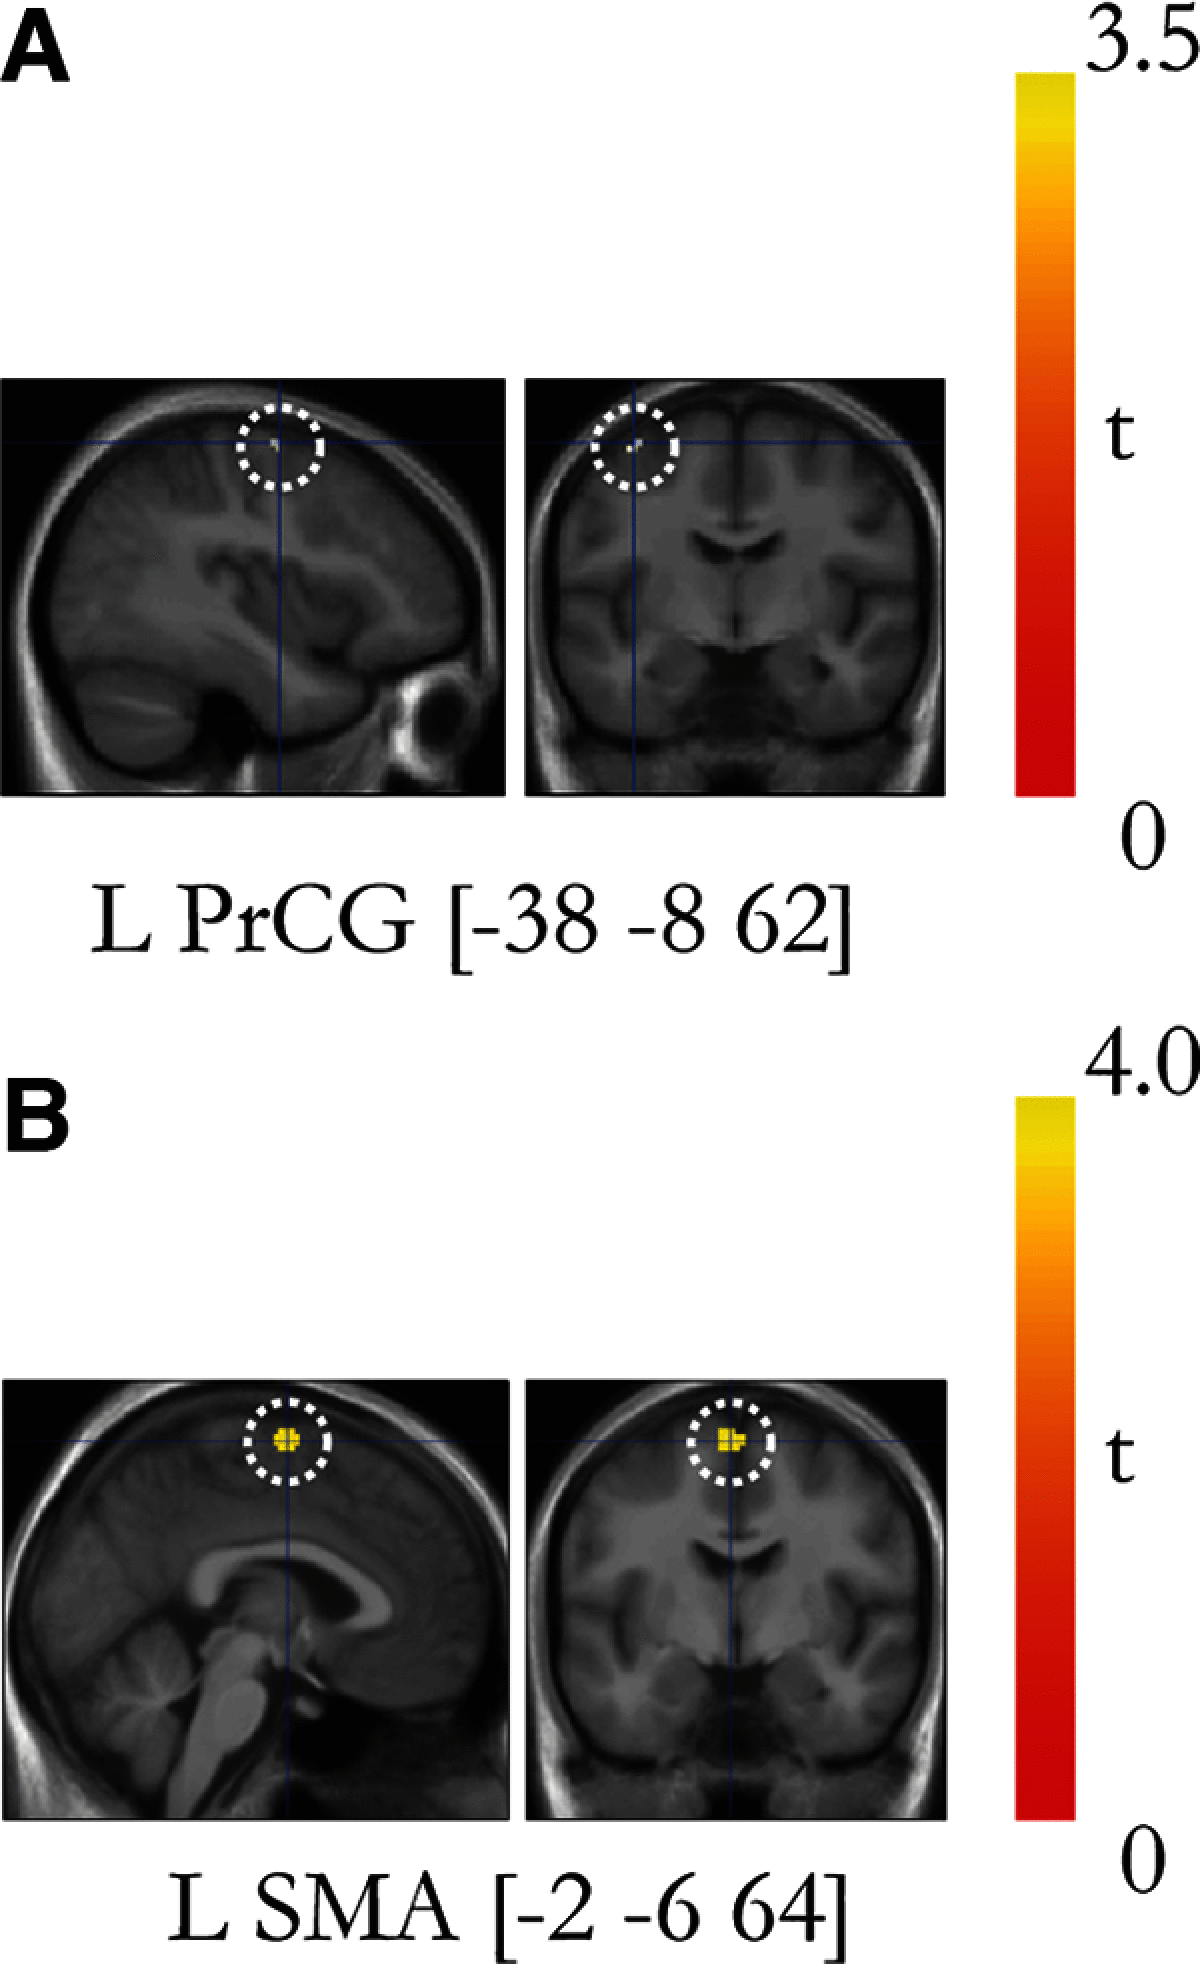
A, Conjunction analysis between the agency contrast and ownership contrast revealed overlapping activation in the left PMd. The significant activation peak (p < 0.05, corrected) is displayed on a representative section (p < 0.005, uncorrected) and is indicated with a dotted white line. B, PPI analysis of regions displaying increased connectivity with the seed region in the left postcentral gyrus (−38, −28, 52). The left SMA displays a task-specific increase in connectivity with the left postcentral gyrus (SMA; t = 3.56; p = 0.001, uncorrected). The peak is displayed as part of an activation map (p < 0.005, uncorrected) and is indicated with a dotted white line. The activation maps are presented on representative sagittal and coronal sections of a mean anatomic MRI image made up of all participants' structural brain scans.
Figure 9.
Figure 9.
A, Overview of the brain regions that display activation reflecting the unique combination of agency and body ownership as defined by the contrast [(AMSTCO – PMSTCO) – (AMATCO – PMATCO)] – [(AMSTIO – PMSTIO) – (AMATIO – PMATIO)]. For display purposes only, the activations are projected onto a three-dimensional rendering of a standard brain with a threshold of p < 0.005 (uncorrected for multiple comparisons, k ≥ 5). RH, Right hemisphere; LH, left hemisphere; IPS, intraparietal sulcus; PoCS, postcentral sulcus; CS, central sulcus. B, Bar charts displaying the parameter estimates (in a.u.) and SEs for the major peaks of activation. The coordinates are given in MNI space. The peaks are displayed in representative sections indicated by a dotted white circle on an activation map (p < 0.005, uncorrected for display purposes). L, left; R, right; PoCG, postcentral gyrus. *Activation peaks that survive small-volume correction (p < 0.05 corrected); the peaks without an asterisk did not survive small-volume correction and are reported in Table 2 with their uncorrected p value. All peaks from the contrast are reported in Extended Data Table 9-1. Condition key: first letter A or P (active or passive) with subscript M (movement); second letter S or A (synchronous or asynchronous) with subscript T (timing); third letter C or I (congruent or incongruent) with subscript O (orientation).
Figure 10.
Figure 10.
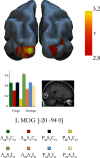
To investigate which brain regions are associated with the sense of agency of external objects as opposed to bodily objects, we defined a contrast that was the inverse of the three-way interaction [(AMSTCO – PMSTCO) – (AMATCO – PMATCO)] – [(AMSTIO – PMSTIO) – (AMATIO – PMATIO)]. The results show activation in the left middle occipital gyrus (p < 0.001, uncorrected; did not survive correction for multiple comparisons) and right middle occipital gyrus (p = 0.002, uncorrected). The coordinates are given in MNI space. L, left; R, right; MOG, middle occipital gyrus. The peak is displayed in a representative section and indicated by a dotted white circle on an activation map (p < 0.005, uncorrected for display purposes; k ≥ 5). The bar chart represents the parameter estimates (in a.u.) for the peak.
Figure 11.
Figure 11.
A, Activation in the right angular gyrus represented by the main effect of asynchrony: (AMATCO + PMATCO + AMATIO + PMATIO) – (AMSTCO + PMSTCO + PMSTIO + AMSTIO). B, Activation in the left insular cortex represented by the main effect of synchrony: (AMSTCO + PMSTCO + PMSTIO + AMSTIO) – (AMATCO + PMATCO + AMATIO + PMATIO). The coordinates are given in MNI space. The peak is displayed in a representative section and is indicated by a dotted white circle on an activation map (p < 0.005, uncorrected for display purposes).
Figure 12.
Figure 12.
Main effect of movement type (active or passive). Using the contrast (AMSTCO + AMATCO + AMSTIO + AMATIO) – (PMSTCO + PMATCO + PMSTIO + PMATIO), we compared all active movement conditions to all passive conditions (regardless of ownership or agency; yellow–red color scale for activation; top row). Active movement was associated with significant activations in the left supplementary motor area (−4, −4, 58; t = 4.98; p < 0.001 uncorrected), left precentral gyrus (PMd; −42, −10, 60; t = 7.82; p < 0.001, FDR corrected; data not shown), left precentral gyrus (M1; −40, −18, 56; t = 9.20; p < 0.011, FDR corrected; data not shown), right cerebellum (lobule VI; 20, −50, −24; t = 9.23; p < 0.001, FDR corrected; data not shown), left thalamus (−14, −22, 4; t = 5.90; p = 0.026, FDR corrected; data not shown), and right angular gyrus (34, −50, 24; t = 5.79; p = 0.033, FDR corrected; data not shown). We also compared all passive movement conditions to all active movement conditions, (PMSTCO + PMATCO + PMSTIO + PMATIO) – (AMSTCO + AMATCO + AMSTIO + AMATIO). Passive movements were associated with a relative increase in neural activity compared with active movements in the bilateral medial frontal cortex (only right shown in section: 10, 44, −2; t = 5.8; p < 0.001, uncorrected; left medial frontal cortex: −6, 46, −2; t = 5.18; p < 0.001; blue–green color scale for activation). The peaks are displayed in a representative section and are indicated by a dotted white circle on an activation map (p < 0.005, uncorrected for display purposes). All peaks from the contrast are reported in Extended Data Table 12-1. RH, Right hemisphere; LH, left hemisphere; SFG, superior frontal gyrus; MFG, medial frontal gyrus.
Figure 13.
Figure 13.
The number and frequency of taps across conditions. The bars represent the mean number and frequency of taps for all conditions for the period excluding the illusion onset times (see Materials and Methods). Error bars indicate the SEMs. The analysis of the frequencies of taps revealed no significant main effects and no significant interactions, and there were no differences in frequencies across conditions. The exact values for each condition are given in Extended Data Table 13-1.

Similar articles

Cited by

References

    1. Abdulkarim Z, Ehrsson HH (2016) No causal link between changes in hand position sense and feeling of limb ownership in the rubber hand illusion. Atten Percept Psychophys 78:707–720. 10.3758/s13414-015-1016-0 - DOI - PMC - PubMed
    1. Abe M, Hanakawa T (2009) Functional coupling underlying motor and cognitive functions of the dorsal premotor cortex. Behav Brain Res 198:13–23. 10.1016/j.bbr.2008.10.046 - DOI - PubMed
    1. Angel RW, Malenka RC (1982) Velocity-dependent suppression of cutaneous sensitivity during movement. Exp Neurol 77:266–274. 10.1016/0014-4886(82)90244-8 - DOI - PubMed
    1. Bengtsson SL, Ullén F, Ehrsson HH, Hashimoto T, Kito T, Naito E, Forssberg H, Sadato N (2009) Listening to rhythms activates motor and premotor cortices. Cortex 45:62–71. 10.1016/j.cortex.2008.07.002 - DOI - PubMed
    1. Bergouignan L, Nyberg L, Ehrsson HH (2014) Out-of-body–induced hippocampal amnesia. Proc Natl Acad Sci U S A 111:4421–4426. 10.1073/pnas.1318801111 - DOI - PMC - PubMed

Publication types

LinkOut - more resources