

Similarities and differences between multivariate patterns of cognitive and socio-cognitive deficits in schizophrenia, bipolar disorder and related risk
- PMID: 36801866
- PMCID: PMC9938280
- DOI: 10.1038/s41537-023-00337-0
Similarities and differences between multivariate patterns of cognitive and socio-cognitive deficits in schizophrenia, bipolar disorder and related risk
Abstract
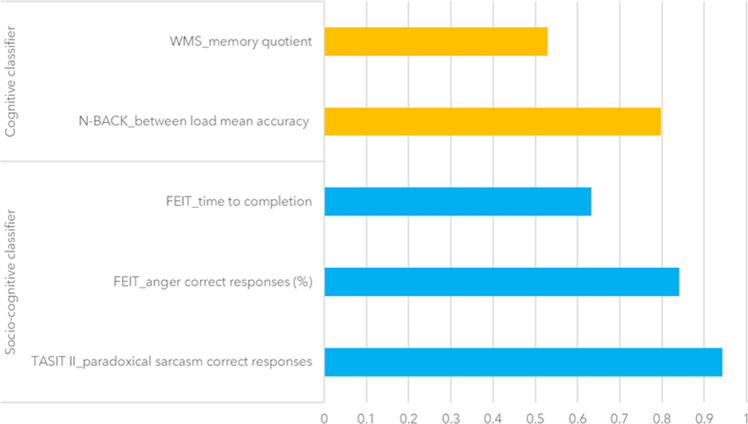
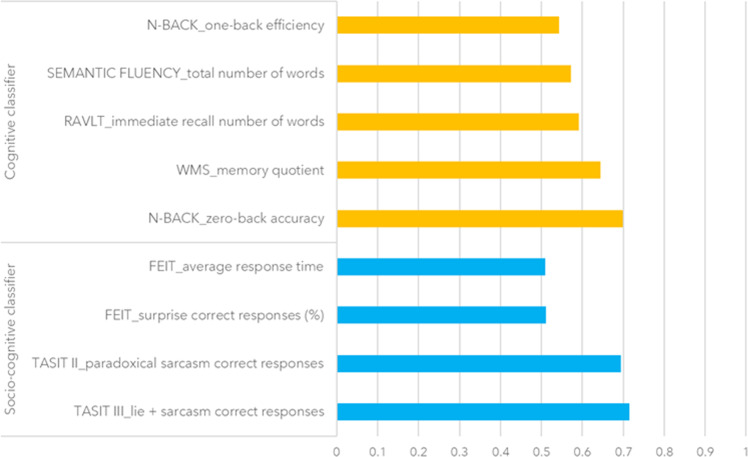
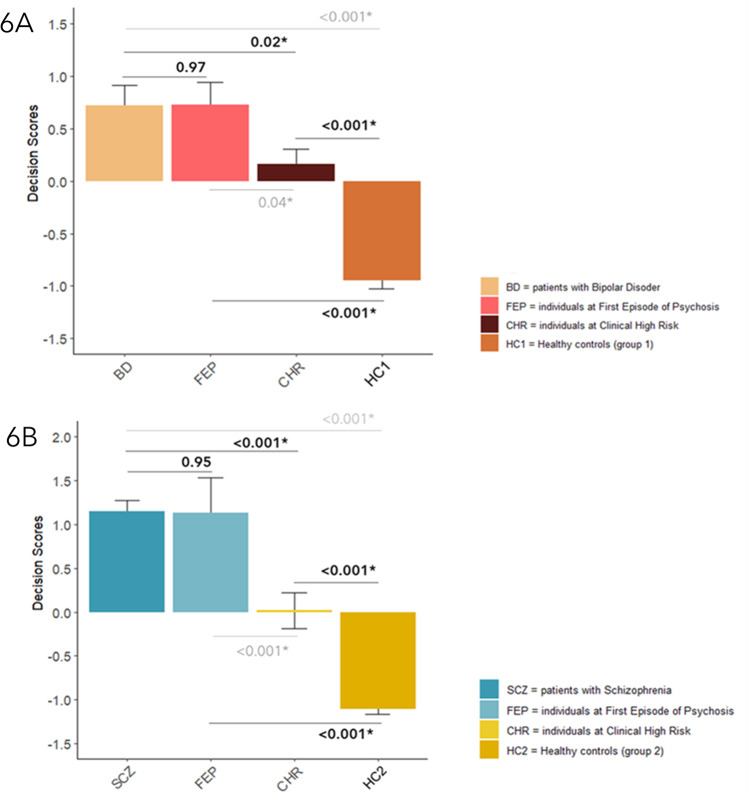
Cognition and social cognition anomalies in patients with bipolar disorder (BD) and schizophrenia (SCZ) have been largely documented, but the degree of overlap between the two disorders remains unclear in this regard. We used machine learning to generate and combine two classifiers based on cognitive and socio-cognitive variables, thus delivering unimodal and multimodal signatures aimed at discriminating BD and SCZ from two independent groups of Healthy Controls (HC1 and HC2 respectively). Multimodal signatures discriminated well between patients and controls in both the HC1-BD and HC2-SCZ cohorts. Although specific disease-related deficits were characterized, the HC1 vs. BD signature successfully discriminated HC2 from SCZ, and vice-versa. Such combined signatures allowed to identify also individuals at First Episode of Psychosis (FEP), but not subjects at Clinical High Risk (CHR), which were classified neither as patients nor as HC. These findings suggest that both trans-diagnostic and disease-specific cognitive and socio-cognitive deficits characterize SCZ and BD. Anomalous patterns in these domains are also relevant to early stages of disease and offer novel insights for personalized rehabilitative programs.
© 2023. The Author(s).
Conflict of interest statement
A.B. reported receiving grants and personal fees from Lundbeck and receiving personal fees from Janssen and from Otsuka during the conduct of the study. G.B. reported receiving personal fees from Lundbeck outside the submitted work. All other authors declare no biomedical financial interests and no potential conflicts of interest. This paper reflects only the authors’ views. The funding bodies had no role in study design, data collection, and analysis, decision to publish, or preparation of the manuscript.
Figures


Similar articles
-
Neurocognitive Functioning in Schizophrenia and Bipolar Disorder: Clarifying Concepts of Diagnostic Dichotomy vs. Continuum.Front Psychiatry. 2013 Dec 5;4:162. doi: 10.3389/fpsyt.2013.00162. eCollection 2013. Front Psychiatry. 2013. PMID: 24367337 Free PMC article.
-
Cognitive deficits in bipolar disorders: Implications for emotion.Clin Psychol Rev. 2018 Feb;59:126-136. doi: 10.1016/j.cpr.2017.11.006. Epub 2017 Nov 21. Clin Psychol Rev. 2018. PMID: 29195773 Free PMC article. Review.
-
Neurocognitive Endophenotypes of Schizophrenia and Bipolar Disorder and Possible Associations with FKBP Variant rs3800373.Med Arch. 2018 Nov;72(5):352-356. doi: 10.5455/medarh.2018.72.352-356. Med Arch. 2018. PMID: 30524168 Free PMC article.
-
Genome-wide analysis reveals genetic overlap between alcohol use behaviours, schizophrenia and bipolar disorder and identifies novel shared risk loci.Addiction. 2022 Mar;117(3):600-610. doi: 10.1111/add.15680. Epub 2021 Oct 3. Addiction. 2022. PMID: 34472679
-
The Risk for Schizophrenia-Bipolar Spectrum: Does the Apple Fall Close to the Tree? A Narrative Review.Int J Environ Res Public Health. 2023 Aug 7;20(15):6540. doi: 10.3390/ijerph20156540. Int J Environ Res Public Health. 2023. PMID: 37569080 Free PMC article. Review.
Cited by
-
Advances in the understanding of the pathophysiology of schizophrenia and bipolar disorder through induced pluripotent stem cell models.J Psychiatry Neurosci. 2024 Mar 15;49(2):E109-E125. doi: 10.1503/jpn.230112. Print 2024 Jan-Feb. J Psychiatry Neurosci. 2024. PMID: 38490647 Free PMC article. Review.
-
Diagnostic value of regional homogeneity and fractional amplitude of low-frequency fluctuations in the classification of schizophrenia and bipolar disorders.Eur Arch Psychiatry Clin Neurosci. 2025 Apr;275(3):799-812. doi: 10.1007/s00406-024-01838-4. Epub 2024 Jun 25. Eur Arch Psychiatry Clin Neurosci. 2025. PMID: 38914853 Free PMC article.
-
Variations of blood D-serine and D-aspartate homeostasis track psychosis stages.Schizophrenia (Heidelb). 2024 Dec 19;10(1):115. doi: 10.1038/s41537-024-00537-2. Schizophrenia (Heidelb). 2024. PMID: 39702391 Free PMC article.
-
Leveraging stacked classifiers for exploring the role of hedonic processing between major depressive disorder and schizophrenia.Psychol Med. 2025 Jul 23;55:e211. doi: 10.1017/S0033291725101207. Psychol Med. 2025. PMID: 40696513 Free PMC article.
-
Revealing differential psychotic symptoms in schizophrenia and bipolar I disorder by manifold learning and network analyses.Transl Psychiatry. 2025 Jun 6;15(1):194. doi: 10.1038/s41398-025-03403-6. Transl Psychiatry. 2025. PMID: 40481013 Free PMC article.
References
-
- American Psychiatric Association. Diagnostic and statistical manual of mental disorders (5th ed.). 10.1176/appi.books.9780890425596 (2013).
-
- Lake C. Schizophrenia and bipolar disorder: No dichotomy, a continuum, or one disease? Psychiatr. Ann. 2010;40:129–131.. doi: 10.3928/00485713-20100303-02. - DOI
LinkOut - more resources
Full Text Sources
Research Materials
