Clinical Trial
. 2023 Feb 18;14(1):926.
doi: 10.1038/s41467-023-36497-x.

An open label, non-randomized study assessing a prebiotic fiber intervention in a small cohort of Parkinson's disease participants

Affiliations
Clinical Trial

An open label, non-randomized study assessing a prebiotic fiber intervention in a small cohort of Parkinson's disease participants

Deborah A Hall et al. Nat Commun. .

Abstract

A pro-inflammatory intestinal microbiome is characteristic of Parkinson's disease (PD). Prebiotic fibers change the microbiome and this study sought to understand the utility of prebiotic fibers for use in PD patients. The first experiments demonstrate that fermentation of PD patient stool with prebiotic fibers increased the production of beneficial metabolites (short chain fatty acids, SCFA) and changed the microbiota demonstrating the capacity of PD microbiota to respond favorably to prebiotics. Subsequently, an open-label, non-randomized study was conducted in newly diagnosed, non-medicated (n = 10) and treated PD participants (n = 10) wherein the impact of 10 days of prebiotic intervention was evaluated. Outcomes demonstrate that the prebiotic intervention was well tolerated (primary outcome) and safe (secondary outcome) in PD participants and was associated with beneficial biological changes in the microbiota, SCFA, inflammation, and neurofilament light chain. Exploratory analyses indicate effects on clinically relevant outcomes. This proof-of-concept study offers the scientific rationale for placebo-controlled trials using prebiotic fibers in PD patients. ClinicalTrials.gov Identifier: NCT04512599.


Conflict of interest statement

The prebiotic bar was provided by BetterBiotics Inc which is co-owned by Drs. Keshavarzian, Hamaker, and Sedghi. A provisional patent is pending for the prebiotic mixture used in the bar (Patent Applicant: Purdue Research Foundation, Inventors: Drs. Hamaker, Cantu-Jungles, Keshavarzian, Application Number: 69548-02, Status: Pending, Patent covers the use of prebiotics to improve health). Drs. Keshavarzian, Hamaker, Sedghi, and Cantu-Jungles were not involved in subject recruitment, subject assessments, or statistical analysis of the data. The remaining authors declare no competing interests.

Figures
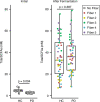
Fig. 1
Fig. 1. Fermentation of prebiotic fibers with human stool increases short-chain fatty acid (SCFA) production.
Stool obtained from PD patients had a lower concentration of total SCFA than stool obtained from healthy controls (HC) (left panel, Student’s t test: P = 0.004, n = 10 biologically independent samples/group). Fermentation of stool with different fibers (Fibers 1–5, 12 h stool fermentation) increased total SCFA production in stool obtained from both HC and PD patients (right panel, Student’s t test: P = 0.387, n = 10 biologically independent samples/fiber/group). Fiber 1: fructooligosaccharides (FOS), Fiber 2: glucan, Fiber 3: pectin, Fiber 4: sorghum arabinoxylan and Fiber 5: a mixture of 25% of each of FOS, glucan, pectin, sorghum arabinoxylan. For each box-and-whisker plot, the central horizontal line indicates the median, the bottom and top of edges of the box indicate the 25th and 75th percentiles (respectively), and the top and bottom whiskers indicate the 10th and 90th percentiles (respectively). Each point represents a biologically independent sample. A two-tailed Student’s t test was used for analysis. Source data are provided as a Source Data File.
Fig. 2
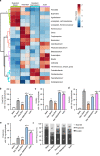
Fig. 2. Fermentation of human stool with prebiotics alters microbial community structure and increases the production of SCFA.
A stool slurry was incubated with fiber (24 h stool fermentation). Three experimental replicates per treatment were conducted, two of which were used for microbiota sequencing (each represented as a separate column). a Microbial community structure was assessed using DNA-based 16 S rRNA gene amplicon sequencing (n = 2 biologically independent samples). Hierarchical clustering of the 25 most abundant genera are visualized (heatmap represents log2 relative abundance). Hierarchical clustering was performed using Euclidean distances and the Ward algorithm, and clusters of taxa were associated with fiber types. Data are presented as Z-scores of relative abundances normalized within each row. be Short-chain fatty acid-production (mM) during 24 h stool fermentation including total SCFA, acetate, butyrate, and propionate (n = 3 biologically independent samples in each group). Error bars represent standard deviation from the mean. One-way ANOVA followed by Tukey’s post hoc test was used for analysis, with P values adjusted for multiple comparisons: a = significant vs blank, b = significant vs resistant starch, c = significant vs rice bran, d = significant vs resistant maltodextrin (significance P < 0.05, P values for each comparison are reported in Supplementary Table S1). f Proportions of each short-chain fatty acid (as a percent of total SCFA) produced during the 24 h stool fermentation (n = 3 biologically independent samples). Source data are provided as a Source Data File. Res. Starch   resistant starch, Res. Maltodextrin   resistant maltodextrin.
Fig. 3
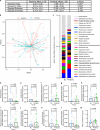
Fig. 3. Characterization of PD participant stool microbiome at baseline and after the prebiotic intervention.
a Diversity indices, including Shannon Index, Simpson’s Index, Species Richness, and Pielou’s evenness were calculated at the taxonomic level of species (n = 19 biologically independent samples assessed at baseline and after prebiotic intervention). Mean index score and standard deviation (SD) are displayed. b Visualization of microbial community structure at baseline and after prebiotic intervention was performed using nonmetric multidimensional scaling (NMDS) at the taxonomic level of species (n = 19 biologically independent samples assessed at baseline and after the prebiotic intervention). Symbols representing each PD participant (P1–P20) were connected to a centroid representing the mean value of each group: baseline (red) or after prebiotic intervention (blue). A dotted line connects each subject at baseline and after the prebiotic intervention. c Mean relative abundance of microbial species (>1% relative abundance) at baseline and after the prebiotic intervention. Bold taxa indicate a significant difference (q < 0.05) between baseline and after prebiotic intervention assessed using a two-tailed, Wilcoxon signed-rank test and corrected for multiple comparisons using the Benjamini–Hochberg method. The prebiotic intervention: d, e decreased relative abundance of putative pro-inflammatory bacteria from the phylum Proteobacteria and the species Escherichia coli; fj increased relative abundance of putative beneficial SCFA-producing bacterial species including Fusicatenibacter saccharivorans, Parabacteroides merdae, Faecalibacterium prausnitzii, Bifidobacterium adolescentis, Ruminococcus bicirculans; kl decreased the relative abundance of Ruminococcus bromii and Ruminococcus torques; and m increased levels of plasma SCFA. A two-tailed, Wilcoxon signed-rank test was used for analysis. Bar height represents the group mean and individual samples are indicated. n = 19 (al) and n = 18 (m) biologically independent samples assessed at baseline and after the prebiotic intervention. Group means and standard deviations are shown in Supplementary Table 4 and source data are provided as a Source Data File. BL baseline, Prebiotic after the 10-day prebiotic intervention.
Fig. 4
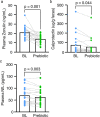
Fig. 4. Ten days of the prebiotic intervention had effects on biological outcomes.
Ten days of the prebiotic intervention: a reduced plasma zonulin n = 20, b reduced stool calprotectin n = 20, and c reduced plasma neurofilament (NfL) n = 19. Bar height represents the group mean and individual points are indicated for each group, biological independent samples assessed at baseline and after the prebiotic intervention. A two-tailed, Paired t- test was used for analysis. Group means and standard deviations are shown in Table 3, and source data are provided as a Source Data File.

Similar articles

Cited by

References

    1. Zheng D, Liwinski T, Elinav E. Interaction between microbiota and immunity in health and disease. Cell Res. 2020;30:492–506. doi: 10.1038/s41422-020-0332-7. - DOI - PMC - PubMed
    1. Bullich C, Keshavarzian A, Garssen J, Kraneveld A, Perez-Pardo P. Gut vibes in Parkinson’s disease: the microbiota-gut-brain axis. Mov. Disord. Clin. Pr. 2019;6:639–651. doi: 10.1002/mdc3.12840. - DOI - PMC - PubMed
    1. Park J, Kim CH. Regulation of common neurological disorders by gut microbial metabolites. Exp. Mol. Med. 2021;53:1821–1833. doi: 10.1038/s12276-021-00703-x. - DOI - PMC - PubMed
    1. Castillo-Alvarez F, Marzo-Sola ME. Role of the gut microbiota in the development of various neurological diseases. Neurologia. 2019;37:492–498. - PubMed
    1. Keshavarzian A, Engen P, Bonvegna S, Cilia R. The gut microbiome in Parkinson’s disease: a culprit or a bystander? Prog. Brain Res. 2020;252:357–450. doi: 10.1016/bs.pbr.2020.01.004. - DOI - PubMed

Publication types

Associated data