. 2023 Feb 28;120(9):e2216399120.
doi: 10.1073/pnas.2216399120. Epub 2023 Feb 21.

Robust machine learning segmentation for large-scale analysis of heterogeneous clinical brain MRI datasets

Affiliations

Robust machine learning segmentation for large-scale analysis of heterogeneous clinical brain MRI datasets

Benjamin Billot et al. Proc Natl Acad Sci U S A. .

Abstract

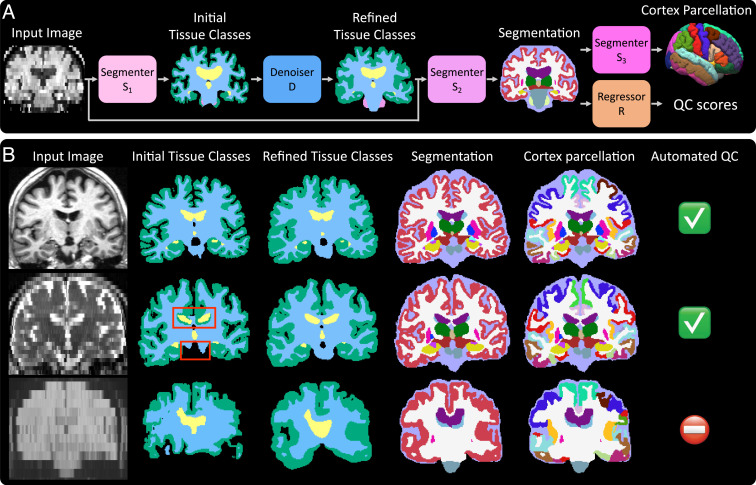
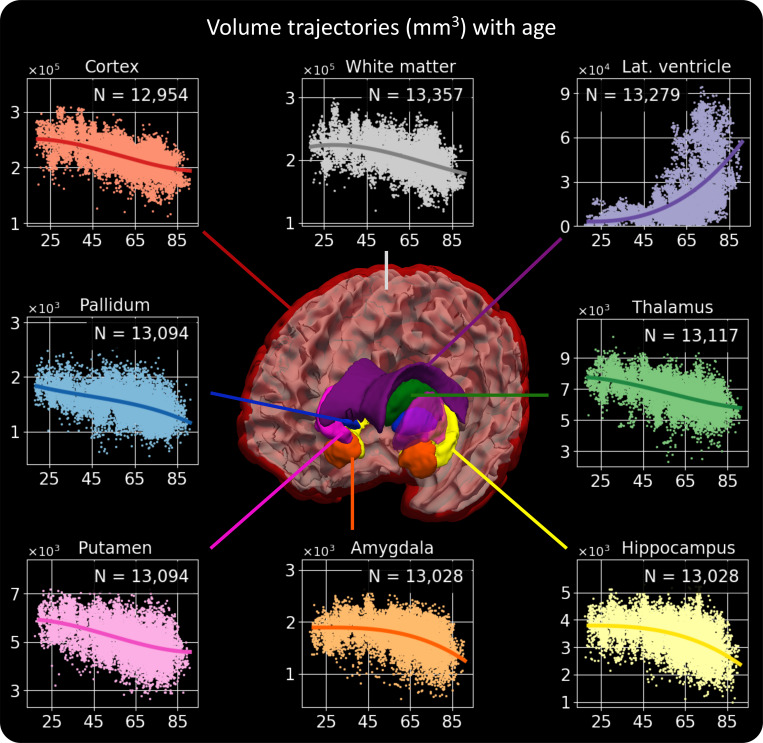
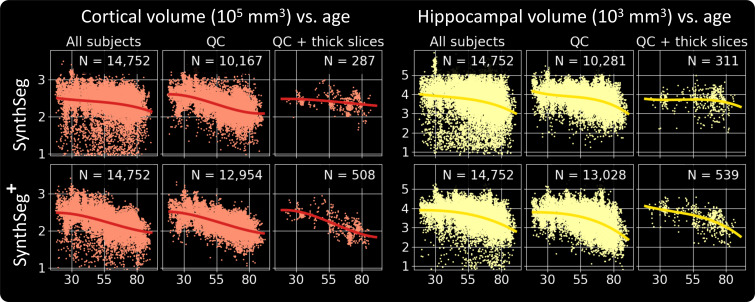
Every year, millions of brain MRI scans are acquired in hospitals, which is a figure considerably larger than the size of any research dataset. Therefore, the ability to analyze such scans could transform neuroimaging research. Yet, their potential remains untapped since no automated algorithm is robust enough to cope with the high variability in clinical acquisitions (MR contrasts, resolutions, orientations, artifacts, and subject populations). Here, we present SynthSeg+, an AI segmentation suite that enables robust analysis of heterogeneous clinical datasets. In addition to whole-brain segmentation, SynthSeg+ also performs cortical parcellation, intracranial volume estimation, and automated detection of faulty segmentations (mainly caused by scans of very low quality). We demonstrate SynthSeg+ in seven experiments, including an aging study on 14,000 scans, where it accurately replicates atrophy patterns observed on data of much higher quality. SynthSeg+ is publicly released as a ready-to-use tool to unlock the potential of quantitative morphometry.

Keywords: clinical brain MRI; deep learning; domain-agnostic; segmentation.


Conflict of interest statement

The authors declare no competing interest.

Figures

Fig. 1.
Fig. 1.
Overview of SynthSeg+. (A) Inference pipeline. All modules are implemented as CNNs. (B) Outputs of the intermediate modules for three representative cases. On the first row, all modules obtain accurate results. On the second row, the denoiser corrects mistakes in the initial tissue classes (red boxes), ultimately leading to a good segmentation. Third, the very low tissue contrast of the image leads to a poor segmentation, but the automated QC correctly identifies it as unusable for subsequent analyses.
Fig. 2.
Fig. 2.
Segmentations obtained by all tested methods. (A) Comparison between whole-brain segmentations produced by SynthSeg+ and SynthSeg. Here, we show the results obtained for three cases, where SynthSeg, respectively, exhibits large (“big fail”), moderate (“mild fail”), and no errors (“pass”). Yellow arrows point at notable mistakes. SynthSeg+ produces excellent results given the low SNR, poor tissue contrast, or low resolution of the input scans. (B) Segmentations obtained on the same scans by three variants of our method. Note that appending D substantially smooths segmentations.
Fig. 3.
Fig. 3.
Dice scores for whole-brain segmentation (A and B) and cortical parcellation (C and D). For (A) and (C), we evaluate the competing methods on 500 heterogeneous clinical scans, presented based on a visual QC of SynthSeg segmentations. The results in (B) and (D) are obtained on scans of four MRI modalities at decreasing resolutions. For each dataset, the best method is marked with * or ** if statistically better than the others at a 5% or 1% level (one-sided Bonferroni-corrected Wilcoxon signed-rank test).
Fig. 4.
Fig. 4.
Scatter plot of ICVs predicted by SynthSeg+ and FreeSurfer (3) on the 500 clinical scans. Orange points depict 1-mm T1-weighted acquisitions (N = 62), while the other scans are in green. The gray dashed line marks where abscissa is equal to ordinate. The Pearson correlation coefficient between the two methods is 0.910 when considering all scans, and 0.906 for T1-weighted scans only (P < 10−9 in both cases).
Fig. 5.
Fig. 5.
Volume trajectories obtained by processing 14,752 heterogeneous clinical scans with SynthSeg+. For each brain region, the value of N indicates the number of volumes considered to build the plot, i.e., the number of segmentations that passed the automated QC for this structure. We emphasize that the obtained results are remarkably similar to recent studies, which exclusively employed scans of much higher quality (–41).
Fig. 6.
Fig. 6.
Cortical and hippocampal volume trajectories obtained by SynthSeg and SynthSeg+ in three different scenarios: using all available scans, keeping only those which passed the automated QC and simulating the case where we only have access to scans acquired at low resolution (here with a slice thickness of more than 6.5 mm). We highlight that SynthSeg+ is much more robust than SynthSeg since it outputs far fewer outliers, and accurately detects atrophy patterns even for scans at very low resolutions.

References

    1. Ashburner J., Friston K., Unified segmentation. NeuroImage 26, 39–51 (2005). - PubMed
    1. Jenkinson M., Beckmann C., Behrens T., Woolrich M., Smith S., FSL. Neuroimage 62, 782–790 (2012). - PubMed
    1. Fischl B., FreeSurfer. NeuroImage 62, 774–781 (2012). - PMC - PubMed
    1. Oren O., Kebebew E., Ioannidis J., Curbing unnecessary and wasted diagnostic imaging. JAMA 321, 245–246 (2019). - PubMed
    1. Hibar D., et al. , Common genetic variants influence human subcortical brain structures. Nature 520, 224–229 (2015). - PMC - PubMed

Publication types

MeSH terms