. 2023 Feb 28;120(9):e2220120120.
doi: 10.1073/pnas.2220120120. Epub 2023 Feb 21.

Type III interferon drives thymic B cell activation and regulatory T cell generation

Affiliations

Type III interferon drives thymic B cell activation and regulatory T cell generation

Ryan J Martinez et al. Proc Natl Acad Sci U S A. .

Abstract

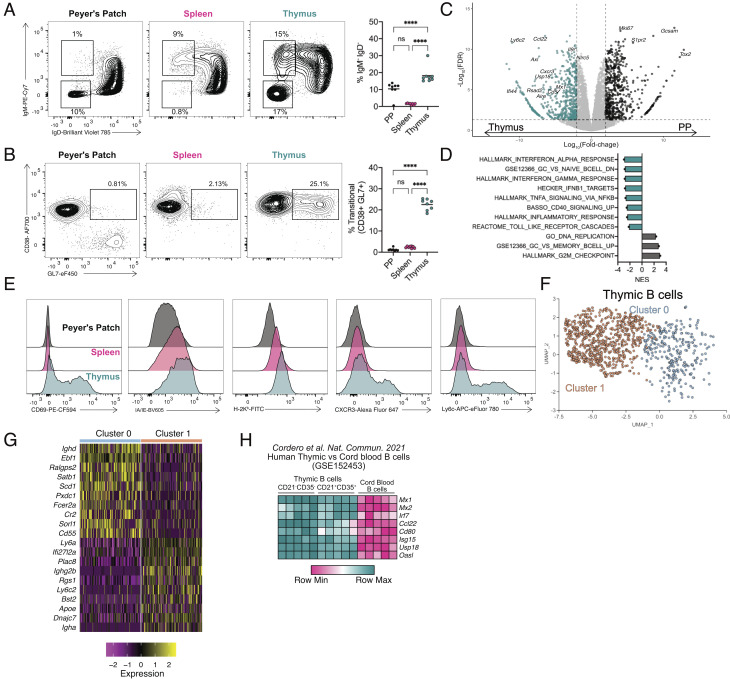
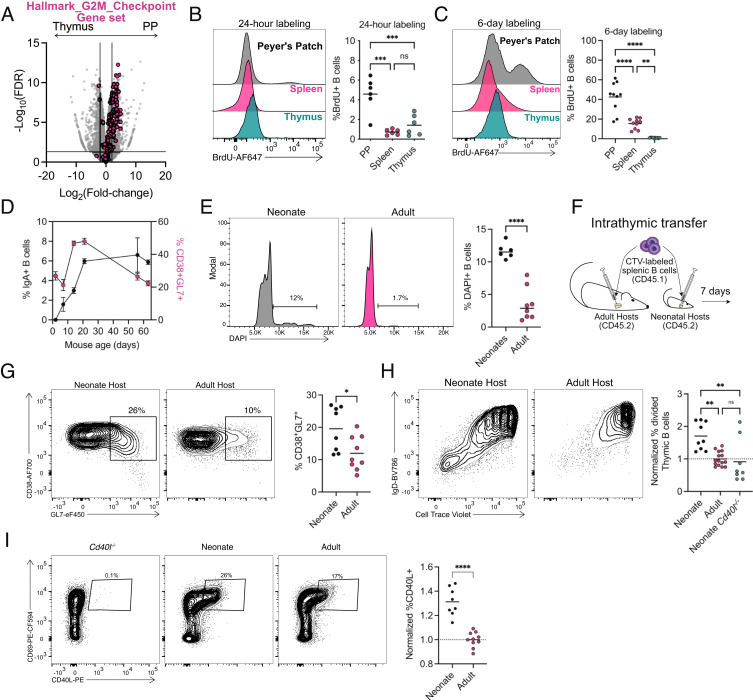
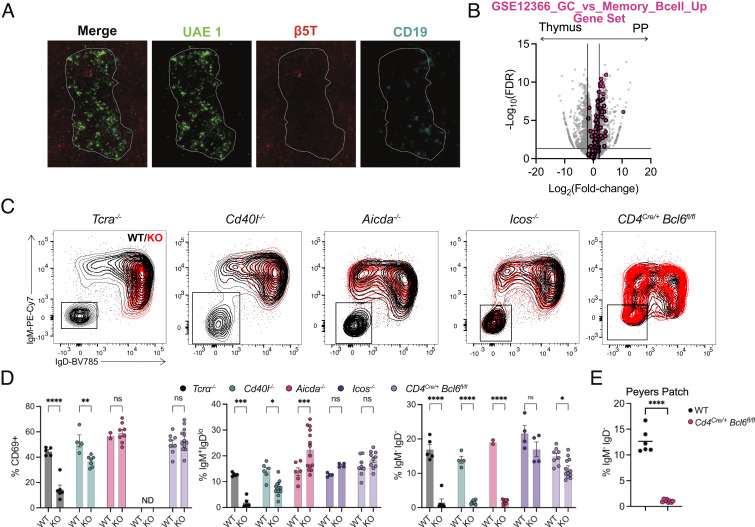
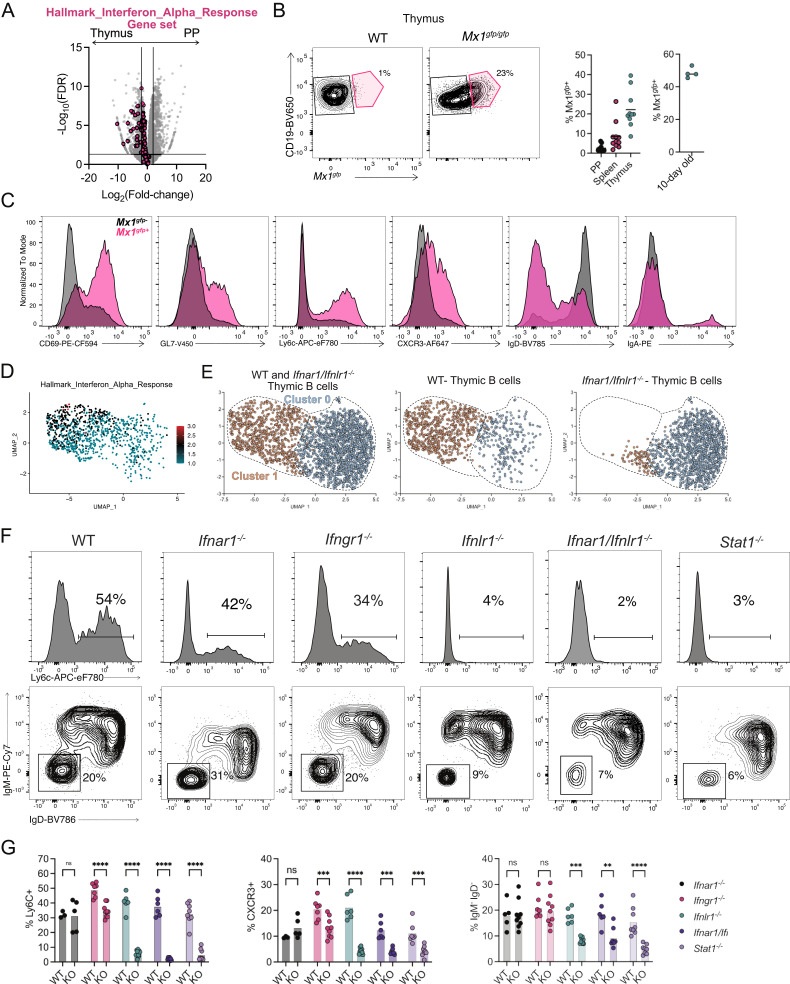
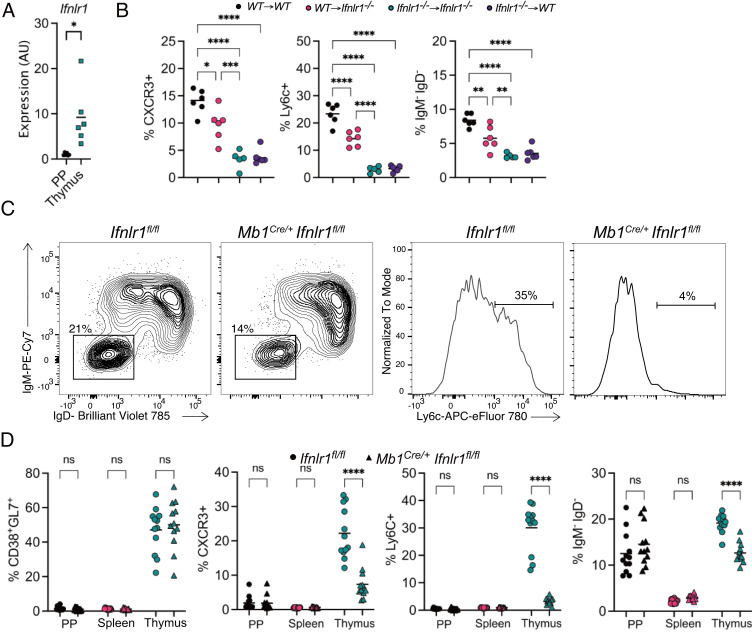
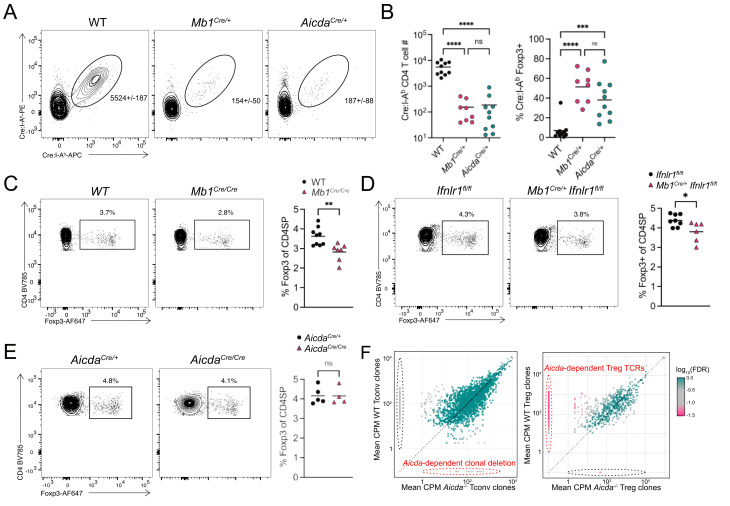
The activation of thymic B cells is critical for their licensing as antigen presenting cells and resulting ability to mediate T cell central tolerance. The processes leading to licensing are still not fully understood. By comparing thymic B cells to activated Peyer's patch B cells at steady state, we found that thymic B cell activation starts during the neonatal period and is characterized by TCR/CD40-dependent activation, followed by immunoglobulin class switch recombination (CSR) without forming germinal centers. Transcriptional analysis also demonstrated a strong interferon signature, which was not apparent in the periphery. Thymic B cell activation and CSR were primarily dependent on type III IFN signaling, and loss of type III IFN receptor in thymic B cells resulted in reduced thymocyte regulatory T cell (Treg) development. Finally, from TCR deep sequencing, we estimate that licensed B cells induce development of a substantial fraction of the Treg cell repertoire. Together, these findings reveal the importance of steady-state type III IFN in generating licensed thymic B cells that induce T cell tolerance to activated B cells.

Keywords: Treg cell selection; central tolerance; thymic B cells; type III IFN.


Conflict of interest statement

The authors declare no competing interest.

Figures

Fig. 1.
Fig. 1.
Class-switched thymic B cells exhibit a unique phenotype. (A) Flow cytometry of B cells from Peyer’s patch (Left), spleen (Middle), and thymus (Right) showing IgM and IgD expression, with number adjacent to outlined areas identifying proportion of isotype class-switched (IgMIgD) and activated IgM+IgDlo B cells. Graph on right shows quantification of isotype class-switched B cells (IgMIgD). (B) Flow cytometry of total B cells from the Peyer’s patch (Left), spleen (Middle), and thymus (Right) showing CD38 and GL7 expression with number adjacent to outlined areas identifying proportion of activated memory B cell precursors. Graph on Right shows quantification of activated memory B cell precursors (CD38+GL7+). (C) Volcano plot representation of RNA-Seq data comparing isotype class-switched thymic and PP B cells showing Log2 fold-change by -Log10 FDR. Significantly up-regulated genes (FDR <= 0.05) are identified in the thymus (blue, FC < −2) and PP (black, FC > 2). (D) Gene set enrichment analysis normalized enhancement score (NES) for ranked RNA-Seq data. Negative NES are pathways overrepresented in thymic B cells; positive NES pathways overrepresented in PP B cells. (E) Flow cytometry histograms for CD69, I-A/I-E, H2-Kb, CXCR3, and Ly6C expression of B cells in the PP (black, Top), spleen (pink, Middle), and thymus (blue, Bottom). (F) Uniform Manifold Approximation and Projection (UMAP) plot for thymic B cells. (G) Heatmap representation of top 10 differentially expressed genes in subsampled thymic B cells from cluster 0 and 1. (H) Heatmap representation of log2-transformed counts per-million (CPM) of individual ISG mRNA in CD21CD35 and CD21+CD35+ thymic B cells compared with cord blood B cells. Each symbol (A and B) represents an individual mouse; small horizontal lines indicate the group mean. *P ≤ 0.05, **P ≤ 0.01, ***P ≤ 0.001, and ****P ≤ 0.0001 (A and B One-way ANOVA with Tukey’s multiple comparisons test).
Fig. 2.
Fig. 2.
Increased CD40L expression drives a burst of B cell licensing in early life. (A) Volcano plot representation of RNA-Seq data comparing isotype class-switched thymic and PP B cells (gray) with overlaid “Hallmark_G2M_Checkpoint” gene set (pink). (B) Flow cytometry histogram measuring BrdU incorporation after 24-h labeling (2-mg intraperitoneal injection) of B cells in the PP (black, Top), spleen (pink, Middle), and thymus (blue, Bottom). Graph of right shows quantification of BrdU-positive B cell after 24 h of labeling. (C) Flow cytometry histogram measuring BrdU incorporation after 6 d of labeling (0.8 mg/mL in drinking water) of B cells in the PP (black, Top), spleen (pink, Middle) and thymus (blue, Bottom). Graph on right shows quantification of BrdU-positive B cell after 6 d of labeling. (D) Time course of thymic B cell IgA isotype CSR (black, left axis) and CD38+GL7+ (pink, right axis) activation. Points represent mean (±SEM). (E) Flow cytometry histogram measuring DAPI in thymic B cells from neonatal (Left) and adult (Right). Graph on right shows quantification of DAPI-positive B cells. (F) Diagram of intrathymic transfer experiments into adult or neonatal hosts. (G) Flow cytometry of splenic B cells following intrathymic transfer showing CD38 by GL7 expression in neonatal (5 to 7 d old) (Left) and adult (6 to 8 wk old) (Right) host mice. Graph on right shows quantification of transferred CD38+GL7+ B cells. (H) Flow cytometry of splenic B cells following intrathymic transfer showing IgD and Cell Trace Violet (CTV) expression in neonatal (5 to 7 d old) (Left) and adult (6 to 8 wk old) (Right) host mice. Frequency of divided intrathymic transferred donor B cells normalized to the frequency of divided B cells in adult hosts. (I) Flow cytometry of CD4SP thymocytes (CD4+ CD8α- CD25-GITR-CD44-) showing CD40L by CD69 with number adjacent to outlined areas identifying proportion of CD40L+. The graph on right shows the normalized frequency of CD40L+ CD4SP thymocytes to adult CD40L frequency on the right. Each symbol (B, C, E, and GI) represents an individual mouse; small horizontal lines indicate the group mean. *P ≤ 0.05, **P ≤ 0.01, ***P ≤ 0.001 and ****P ≤ 0.0001 (B, C, H One-way ANOVA with Tukey’s multiple comparisons test, E, G, I Two-tailed unpaired Student’s t test).
Fig. 3.
Fig. 3.
Thymic B cell class switching does not require TFH. (A) Immunofluorescence of the thymus showing UAE-1 (green), β5T (red), and CD19 (cyan). Medullary regions are outlined by a white dotted line. (B) Volcano plot representation of RNA-Seq data comparing isotype class-switched thymic and PP B cells (gray) with overlaid “GSE12366_GC_VS_MEMORY_BCELL_UP” gene set (pink). (C) Flow cytometry overlays of thymic B cells showing IgM by IgD from WT (black) and respective knockout mice (TCRα−/−, Aicda−/−, Cd40l−/−, Icos−/−, and CD4Cre/+ Bcl6fl/fl). (D) Quantification of activated B cells (CD69+), isotype class-switched (IgMIgD) and activated IgM+IgDlo thymic B cells. (E) Quantification of isotype class-switched (IgMIgD) B cells in Peyer’s patch of WT and Cd4Cre/+ Bcl6fl/fl mice. Each symbol (D and E) represents an individual mouse; small horizontal lines indicate the group mean ± SEM. *P ≤ 0.05, **P ≤ 0.01, ***P ≤ 0.001 and ****P ≤ 0.0001 [(D) Two-way ANOVA with Sidak’s multiple comparisons test, (E) Two-tailed unpaired Student’s t test].
Fig. 4.
Fig. 4.
Type III IFN drives thymic B cell licensing. (A) Volcano plot representation of RNA-Seq data comparing isotype class-switched thymic and PP B cells (gray) with overlaid “Hallmark_Interferon_Alpha_Response” gene set (pink). (B) Flow cytometry of thymic B cells showing CD19 and Mx1gfpin WT and Mx1gfp/gfp mice with number adjacent to outlined areas identifying proportion of Mx1gfp+ thymic B cells. Graphs on right showing quantification of Mx1gfp+ PP, splenic and thymic B cells in adult mice, and thymic B cells from 10-d-old mice (C) Flow cytometry histogram overlays of Mx1gfp+ (pink) and Mx1gfp− (black) thymic B cells showing expression of CD69, GL7, Ly6C, CXCR3, IgD, and IgA. (D) UMAP plot of thymic B cells with module score identifying cells expressing genes identified in the “Hallmark_Interferon_Alpha_Response” gene set. (E) UMAP plots of thymic B cells derived from WT and Infar1−/−/Inflr1−/− hosts identified by HTO. (F) Flow cytometry histograms showing Ly6C expression (Top) or isotype class-switched (IgMIgD) thymic B cells derived from WT, Ifnar1−/, Ifngr1−/−, Ifnlr1−/−, Ifnar1−/−/Ifnlr1−/−, and Stat1−/− mice. Numbers adjacent to outlined areas identifying the proportion of cells within the gate. (G) Quantification of Ly6C+, CXCR3+, and isotype class-switched (IgMIgD) thymic B cells from WT, Ifnar1−/, Ifngr1−/−, Ifnlr1−/−, Ifnar1−/−/Ifnlr1−/, and Stat1−/− mice. Each symbol (B and G) represents an individual mouse; small horizontal lines indicate the group mean. *P ≤ 0.05, **P ≤ 0.01, ***P ≤ 0.001 and ****P ≤ 0.0001 [(G) Two-way ANOVA with Sidak’s multiple comparisons test].
Fig. 5.
Fig. 5.
Requirement for type III IFN receptor is B cell intrinsic. (A) RT-qPCR of Ifnlr1 in sorted IgMIgD B cells from the PP (black) and thymus (blue) normalized to Gapdh. (B) Proportion of thymic B cells from mixed bone marrow chimeras with the following phenotypes: Ly6C+, CXCR3+, and IgMIgD. (C) Flow cytometry of thymic B cells from Ifnlr1fl/fl and Mb1Cre/+Ifnrl1fl/fl showing isotype class-switched (IgMIgD) (Left) and Ly6C expression (Right). Numbers adjacent to outlined areas identifying the proportion of cells within the gate. (D) Quantification of the proportion of CD38+GL7+, CXCR3+, Ly6C+, and isotype class-switched (IgMIgD) B cells from Ifnlr1fl/fl and Mb1Cre/+Ifnrl1fl/fl mice located in the PP, spleen, or thymus. Each symbol (A, B, and D) represents an individual mouse; small horizontal lines indicate the group mean. *P ≤ 0.05, **P ≤ 0.01, ***P ≤ 0.001 and ****P ≤ 0.0001 [(A) Two-tailed unpaired Student’s t test, (B) One-way ANOVA with Tukey’s multiple comparisons test, (D) Two-way ANOVA with Sidak’s multiple comparisons test].
Fig. 6.
Fig. 6.
Type III IFN signaling in thymic B cells is required for Foxp3+ regulatory T cell selection. (A) Flow cytometry of live CD19 CD11b CD11c F4/80 TCRβ+ CD4+ T cells showing Cre:I-Ab-PE by Cre:I-Ab-APC to identify Cre61–71:I-Ab-specific CD4 T cells. Numbers adjacent to outlined areas identify the average number of cells in the gate ± the SD of all samples. (B) Quantification of the absolute number (Left) and Foxp3+ regulatory T cell frequency (Right) of Cre61–71:I-Ab-specific CD4 T cells 7 d following Cre61–71/CFA subcutaneous immunization. (C) Flow cytometry of CD4SP thymocytes showing Foxp3 by CD4 in WT (C57BL/6) and Mb1Cre/Cremice (Left). Numbers adjacent to outlined areas identify the proportion of cells within the gate. Quantification of the proportion of Foxp3+ regulatory T cells in the CD4SP thymocyte population (Right). (D) Flow cytometry of CD4SP thymocytes showing Foxp3 by CD4 in Ifnlr1fl/fl and Mb1Cre/+Ifnrl1fl/fl mice (Left). Numbers adjacent to outlined areas identify the proportion of cells within the gate. Quantification of the proportion of Foxp3+ regulatory T cells in the CD4SP thymocyte population (Right). (E) Flow cytometry of CD4SP thymocytes showing Foxp3 by CD4 in AicdaCre/− and AicdaCre/Cremice (Left). Numbers adjacent to outlined areas identify the proportion of cells within the gate. Quantification of the proportion of Foxp3+ regulatory T cells in the CD4SP thymocyte population (Right). (F) Comparison of the mean CDR3 clonotype counts per million reads mapped in Tconv (Left) and Treg cells (Right) from WT or AicdaCre/Cre Tcra+/− TclibTg Foxp3eGFP mice (n = 4 mice per genotype). The Log10(FDR) of for each CDR3 peptide counts per million is shown by heatmap, and CDR3 clonotypes with an FDR ≤ 0.05 are represented by square points and CDR3 clonotypes with an FDR >0.05 are represented by circular points. CDR3 clonotypes identified in red dotted ellipses represent clonal deletion (Left) and regulatory T cell generation (Right) dependent upon class-switched B cells. Each symbol (BE) represents an individual mouse; small horizontal lines indicate the group mean. *P ≤ 0.05, **P ≤ 0.01, ***P ≤ 0.001 and ****P ≤ 0.0001 [(CE) Two-tailed unpaired Student’s t test, (A) Two-way ANOVA with Sidak’s multiple comparisons test].

References

    1. Hogquist K. A., Baldwin T. A., Jameson S. C., Central tolerance: Learning self-control in the thymus. Nat. Rev. Immunol. 5, 772–782 (2005). - PubMed
    1. Breed E. R., et al. , Type 2 cytokines in the thymus activate Sirpα+ dendritic cells to promote clonal deletion. Nat. Immunol. 23, 1042–1051 (2022), 10.1038/s41590-022-01218-x. - DOI - PMC - PubMed
    1. Breed E. R., Lee S. T., Hogquist K. A., Directing T cell fate: How thymic antigen presenting cells coordinate thymocyte selection. Semin. Cell Dev. Biol. 84, 2–10 (2018). - PMC - PubMed
    1. Cepeda S., et al. , Age-associated decline in thymic B cell expression of aire and aire-dependent self-antigens. Cell Rep. 22, 1276–1287 (2018). - PMC - PubMed
    1. Yamano T., et al. , Thymic B cells are licensed to present self antigens for central T cell tolerance induction. Immunity 42, 1048–1061 (2015). - PubMed

Publication types

Substances