. 2023 Feb 28;120(9):e2216421120.
doi: 10.1073/pnas.2216421120. Epub 2023 Feb 21.

Intraluminal pressure elevates intracellular calcium and contracts CNS pericytes: Role of voltage-dependent calcium channels

Affiliations

Intraluminal pressure elevates intracellular calcium and contracts CNS pericytes: Role of voltage-dependent calcium channels

Nicholas R Klug et al. Proc Natl Acad Sci U S A. .

Abstract

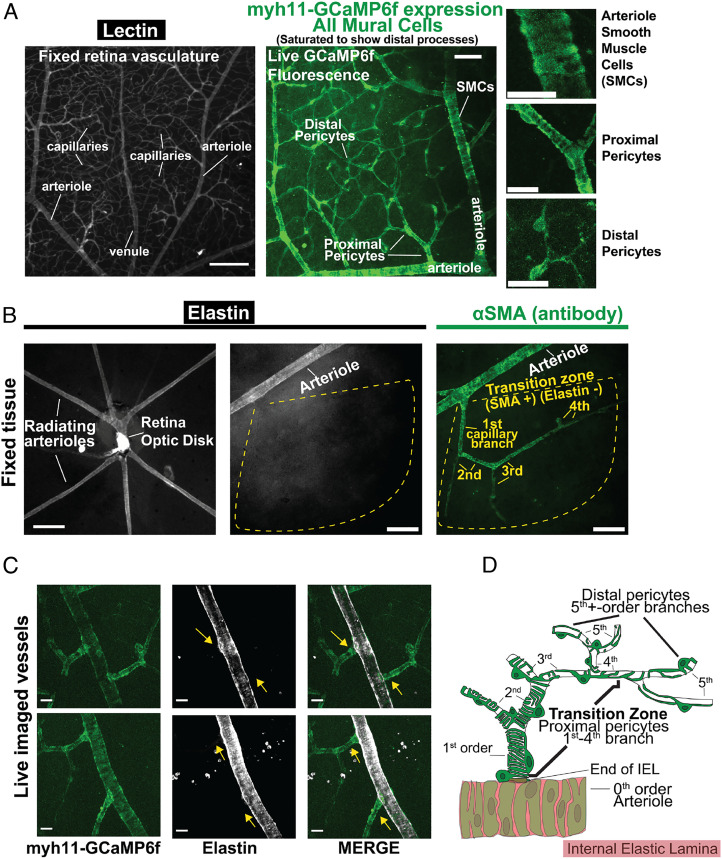
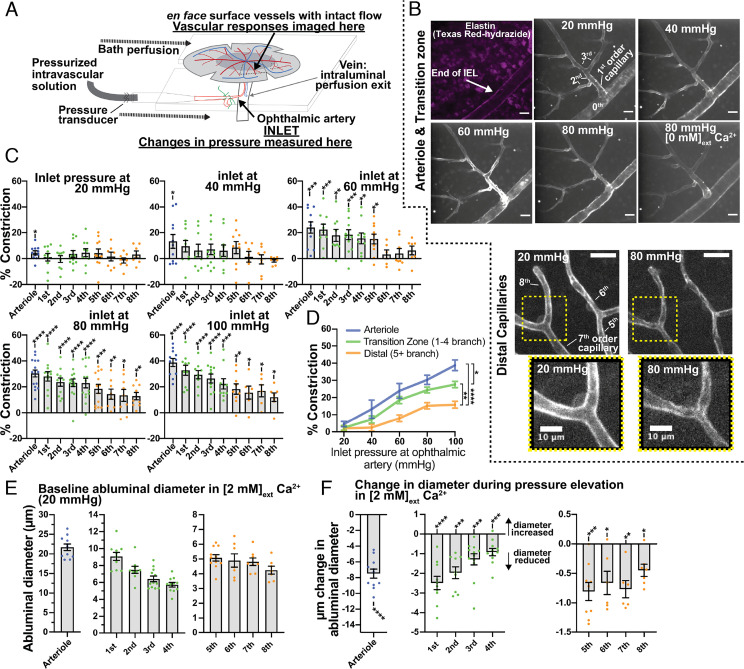
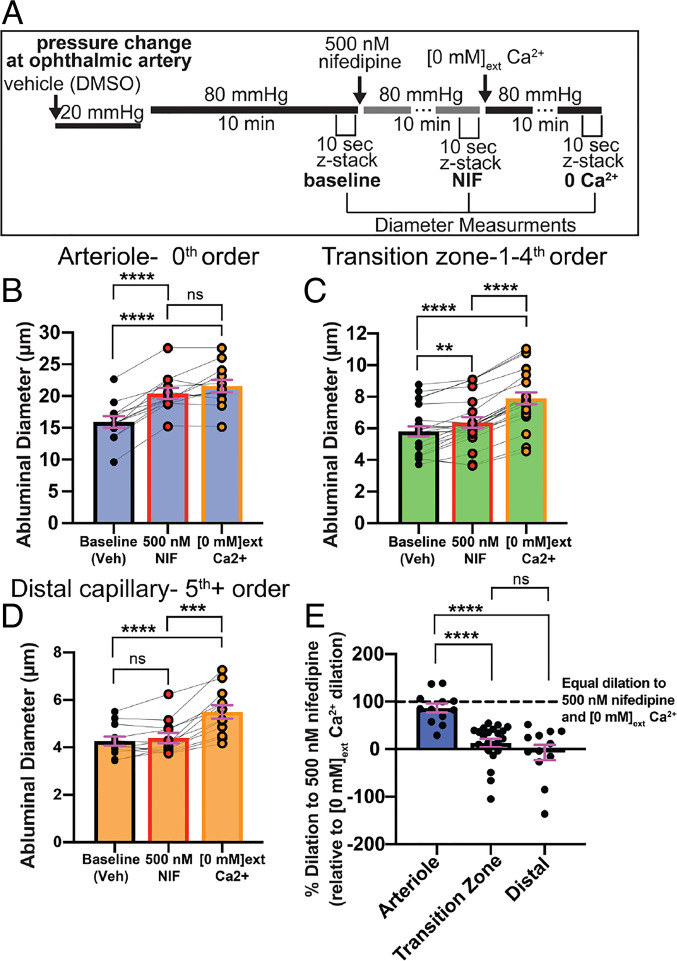
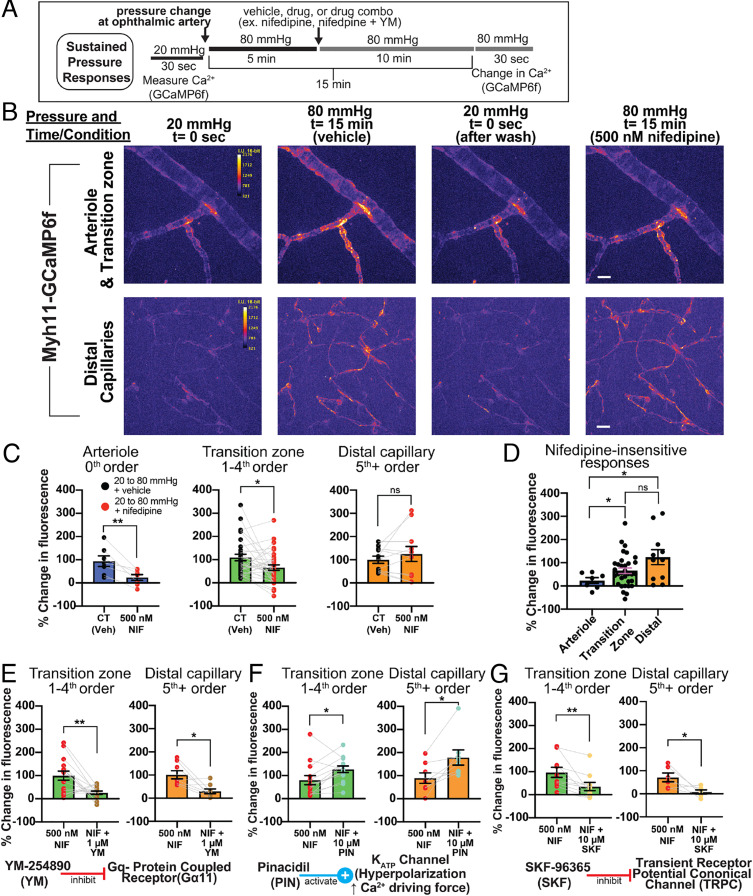
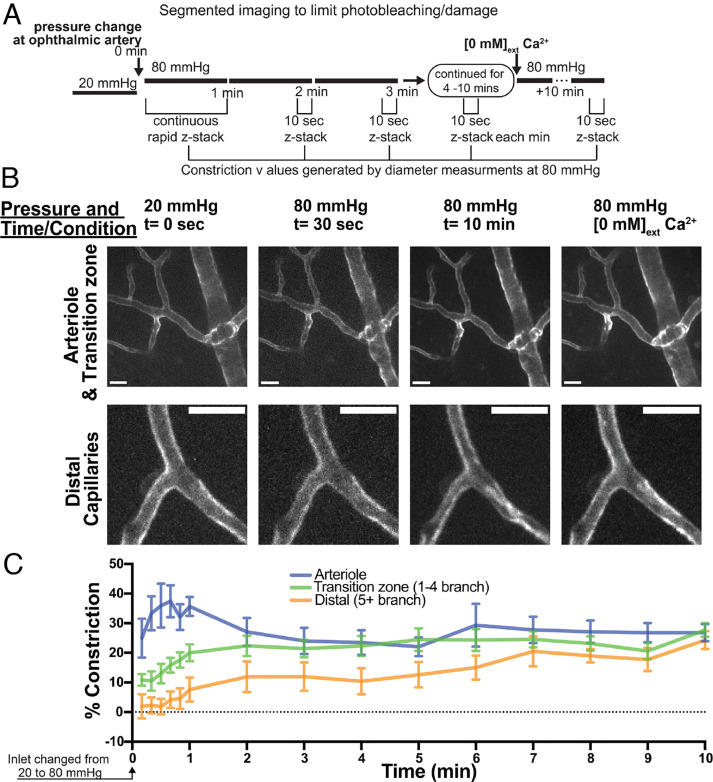
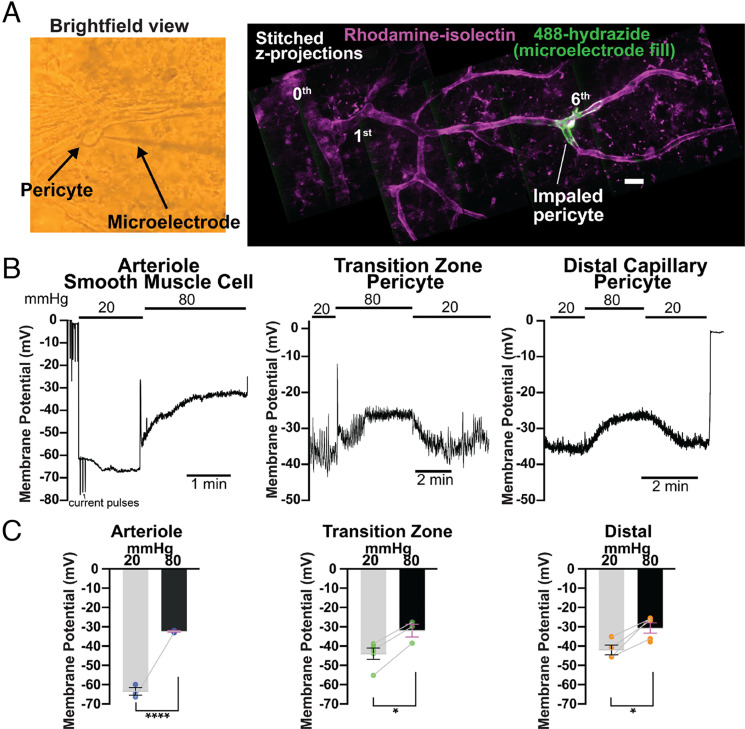
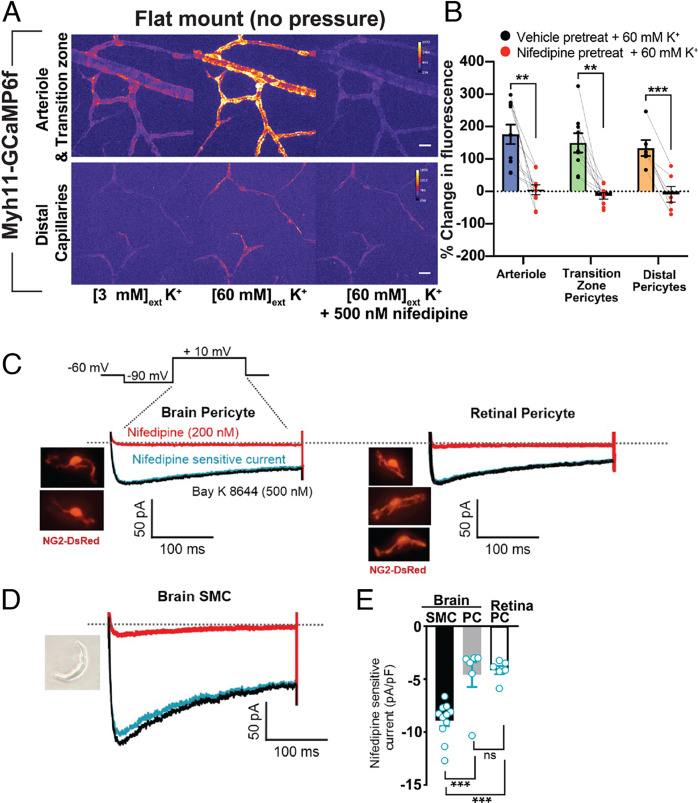
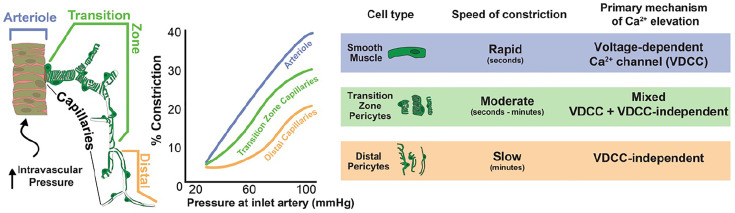
Arteriolar smooth muscle cells (SMCs) and capillary pericytes dynamically regulate blood flow in the central nervous system in the face of fluctuating perfusion pressures. Pressure-induced depolarization and Ca2+ elevation provide a mechanism for regulation of SMC contraction, but whether pericytes participate in pressure-induced changes in blood flow remains unknown. Here, utilizing a pressurized whole-retina preparation, we found that increases in intraluminal pressure in the physiological range induce contraction of both dynamically contractile pericytes in the arteriole-proximate transition zone and distal pericytes of the capillary bed. We found that the contractile response to pressure elevation was slower in distal pericytes than in transition zone pericytes and arteriolar SMCs. Pressure-evoked elevation of cytosolic Ca2+ and contractile responses in SMCs were dependent on voltage-dependent Ca2+ channel (VDCC) activity. In contrast, Ca2+ elevation and contractile responses were partially dependent on VDCC activity in transition zone pericytes and independent of VDCC activity in distal pericytes. In both transition zone and distal pericytes, membrane potential at low inlet pressure (20 mmHg) was approximately -40 mV and was depolarized to approximately -30 mV by an increase in pressure to 80 mmHg. The magnitude of whole-cell VDCC currents in freshly isolated pericytes was approximately half that measured in isolated SMCs. Collectively, these results indicate a loss of VDCC involvement in pressure-induced constriction along the arteriole-capillary continuum. They further suggest that alternative mechanisms and kinetics of Ca2+ elevation, contractility, and blood flow regulation exist in central nervous system capillary networks, distinguishing them from neighboring arterioles.

Keywords: autoregulation; cerebral blood flow; pericytes; vascular tone.


Conflict of interest statement

The authors declare no competing interest.

Figures

Fig. 1.
Fig. 1.
Classification of vascular zones within the retinal vasculature. (A) Left panel, lectin staining of arterioles, capillaries, and venules. Middle panel, demonstration of fluorescence in myh11-GCaMP6f (SMMHC) vessels, showing SMCs (arterioles) and all pericytes (capillaries). Right panels, Insets from Middle panel showing mural cell morphology. [Scale bars, 200 µm (Left panel), 50 µm (Middle panel), and 20 µm (Right Inset panels).] (B) Left panel, low-magnification (10×, 0.1 Numerical Aperture) widefield image of radiating arterioles in a whole-mount retina preparation, visualized by staining for elastin (IEL). Middle and Right panels, 16× (0.8 Numerical Aperture) widefield image of radiating arteriole and proximal capillaries, visualized by staining for elastin (IEL, Middle panel) or αSMA (Right panel). Dotted yellow outline highlighting abrupt loss of elastin (IEL) and continued expression of αSMA in arteriole-proximate capillary branches; first, second, third, and fourth denote capillary branch order. On average, capillaries (vessels lacking an IEL) exhibited αSMA expression (fluorescence intensity > 2 SD above background) up to a branch order of 3.8 ± 0.3 (n = 31 arteriole-capillary segments from five mouse retinas). [Scale bars, 200 µm (Left) and 50 µm (Middle and Right panels).] (C) Representative images of live tissue showing the abrupt loss of the IEL at the point where lateral capillary branches begin (yellow arrows), demonstrated by GCaMP (GFP) fluorescence in vessels from myh11-GCaMP6f mice. (Scale bar, 20 µm.) (D) Schematic depiction of the transition zone comprising approximately the first four capillary segments, showing the banding of individual SMCs wrapping around arteriolar endothelial cells, the abrupt decrease in vessel diameter and loss of IEL at the beginning of the first-order capillary branch, and the transitioning morphology of overlying pericytes from enwrapping to mesh type to thin-strand with progression from first- to fifth- and higher order branches.
Fig. 2.
Fig. 2.
Pressure-induced constriction in arterioles and capillaries. (A) Schematic depiction of the pressurized retina preparation. (B) Top panels: Z-projection of live lectin-stained arterioles and transition zone capillary branches at 20, 40, 60, and 80 mmHg, and 80 mmHg with 0 Ca2+; each image was taken during the final minute of the pressure step. Texas Red hydrazide was added to stain the IEL and verify arteriole and capillary branch orders (first panel). Bottom panels: Z-projection of live lectin-stained distal capillary branches at 20 and 80 mmHg. (C) Percent vascular constriction in arterioles and first- to eighth-order capillary branches, measured at 20 to 100 mmHg in 2 mM external Ca2+ (active diameter) and 20 to 100 mmHg in 0 mM external Ca2+ with 5 mM ethylene glycol-bis (β-aminoethyl ether)-N,N,N′,N′-tetraacetic acid (EGTA) (passive diameter; SI Appendix, Methods). (D) Arteriole and transition zone and distal capillary pressure-constriction curves. (E) Baseline abluminal diameters of arterioles and first- to eighth-order capillary branches at a starting pressure of 20 mmHg. (F) Maximum changes in diameter observed in arterioles and first- to eighth-order capillary branches in [2 mM]ext Ca2+ during elevation of inlet pressure, ranging from 20 to 100 mmHg. Data are presented as individual values and mean ± SEM [n per branch = 6 to 12 from six animals; C, F: *P < 0.05, **P < 0.01, ***P < 0.001, ****P < 0.0001 vs. theoretical mean of zero (no constriction), one sample t test, unmarked comparison are not significant; D: *P < 0.05, **P < 0.01, ***P < 0.001, ****P < 0.0001, two-way ANOVA with Tukey’s multiple comparison test at 100 mmHg]. (Scale bars, 20 µm unless otherwise labeled.)
Fig. 3.
Fig. 3.
Pressure-induced dilation of arterioles and capillaries in the presence of nifedipine and [0 mM] external Ca2+. (A) Experimental parameters for imaging, pressure changes, and drug applications for sustained-pressure experiments. Baseline diameter at 20 mmHg was determined in the presence of vehicle (0.005% dimethyl sulfoxide [DMSO]). (BD) Abluminal vessel diameter in pressure-constricted arterioles (B), transition zone capillaries (C), and distal capillaries (D) at 80 mmHg, with bath application of 500 nM nifedipine and subsequent exposure to [0 mM] external Ca2+ conditions. Data in BD are paired values presented with mean ± SEM (*P < 0.05, **P < 0.01, ***P < 0.001, ****P < 0.0001; one-way ANOVA with Tukey’s multiple comparison test); ns, not significant. (E) Percent nifedipine-specific dilation (relative to [0 mM] external Ca2+ dilation) in arterioles, transition zone capillaries, and distal capillaries (SI Appendix, Methods). Data are individual values presented with mean ± SEM (n per zone = 8 to 24 from five animals; *P < 0.05, **P < 0.01, ***P < 0.001, ****P < 0.0001; Brown–Forsythe and Welch ANOVA with Welch’s correction); ns, not significant.
Fig. 4.
Fig. 4.
Sustained Ca2+ responses to pressure in arterioles and capillaries. (A) Experimental parameters for imaging, pressure changes, and drug applications. Vehicle control, 0.005% for nifedipine alone or 0.1% dimethyl sulfoxide for dual drug treatment. (B) First horizontal panel: representative pseudocolored z-projections of arteriole and transition zone capillary GCaMP6f fluorescence at 20 mmHg, 80 mmHg 15 min after pressure change, 20 mmHg (after initial pressure change, return to baseline), and at 80 mmHg 15 min after pressure change with nifedipine (NIF; 10-min treatment), added at 5 min after pressure change. Second horizontal panel: representative image of pseudocolored z-projection of distal capillary pericyte GCaMP6f fluorescence under identical treatment conditions. (Scale bars, 20 μm.) (C) Pressure-induced (20 to 80 mmHg at ophthalmic artery) changes in Ca2+ (GCaMP6f fluorescence) in arterioles, transition zone capillaries, and distal capillaries with vehicle or 500 nM nifedipine treatment. (D) Comparison of nifedipine-insensitive Ca2+ changes (500 nM nifedipine) in pressure-stimulated arterioles, transition zone pericytes, and distal pericytes. (E) Pressure-induced changes in Ca2+ in transition zone capillaries and distal capillaries with 500 nM nifedipine treatment or nifedipine + 1 µM YM-254890. (F) Pressure-induced changes in Ca2+ in transition zone capillaries and distal capillaries with 500 nM nifedipine treatment or nifedipine + 10 µM pinacidil. (G) Pressure-induced changes in Ca2+ in transition zone capillaries and distal capillaries with 500 nM nifedipine or nifedipine + 10 µM SKF-96365. Data are individual values presented with mean ± SEM (n = 7 to 24 vessel segments from three to five mice; C, E, F, and G: *P < 0.05, **P < 0.01, paired t test; D: *P < 0.05, **P < 0.01; Brown–Forsythe and Welch ANOVA with Welch’s correction); ns, not significant.
Fig. 5.
Fig. 5.
Temporal properties of pressure-induced constriction in arterioles and capillaries. (A) Experimental parameters for pressure change and imaging. (B) Representative images of arterioles, transition zone capillaries, and distal capillaries at 20 mmHg (0 s), at 80 mmHg for 30 s and 10 min, and passively dilated at 80 mmHg. Only vessels with confirmed constriction at the end of 10 min were used for analysis of temporal properties of constriction. (Scale bars, 20 um.) (C) Percent constriction developed in different zones over 10 min following pressure elevation (20 to 80 mmHg). Data are mean ± SEM (n per branch = 5 to 11 from five animals; P < 0.0001 for differences in constriction among the three groups at 1 min, two-way ANOVA with Tukey’s multiple comparison test).
Fig. 6.
Fig. 6.
Pericyte membrane potential responses to changes in pressure. (A) First panel, localization, and identification of pericytes. Pericytes within the pressurized retinal vasculature were first identified by brightfield microscopy and then impaled with microelectrodes. Second panel, hydrazide-filled pericytes, imaged following impalement and membrane potential recordings to confirm pericyte morphology and location (branch order). The vasculature was also stained with rhodamine-isolectin (magenta) to highlight branching structure. (Scale bar, 20 μm.) (B) Membrane potential responses to stepped pressure changes (from 20 to 80 mmHg), recorded from an arteriolar SMC, transition zone (second-order) pericyte, and distal (sixth-order) pericyte. All changes in pressure were measured at the ophthalmic artery. (C) Summary data showing membrane potential in arteriolar SMCs (blue), transition zone pericytes (green), and distal pericytes (orange) at ophthalmic artery pressures of 20 and 80 mmHg. Data are paired and unpaired individual values presented with mean ± SEM [n = 3 SMCs from three mice and n = 3 to 4 pericytes per zone from three to four mice; *P < 0.05, **P < 0.01, ***P < 0.001, ****P < 0.0001, unpaired t test for SMCs and transition zone pericytes (unpaired values at 20 and 80 mmHg for arterioles and two unpaired values at 20 mmHg for transition zone pericytes) and paired t test for distal pericytes].
Fig. 7.
Fig. 7.
Functional expression of VDCCs in pericytes. (A) Representative pseudocolored image of GCaMP6f fluorescence in flat-mount retinal arterioles, transition zone capillaries, and distal capillaries in 3 mM external K+ (normal) 60 mM external K+, or 60 mM external K+ with pretreatment with 500 nM nifedipine. (Scale bars, 20 μm.) (B) Summary data showing Ca2+ levels (change in GCaMP6f fluorescence values) in arterioles and transition zone and distal capillaries in response to a depolarizing (60 mM) concentration of external K+ without (vehicle) and with 500 nM nifedipine pretreatment. Data are paired individual values with mean ± SEM (n = 6 to 10 vessels per zone from four to five animals; *P < 0.05, **P < 0.01, ***P < 0.001, paired t test). (C) Voltage step protocol used for all whole-cell recordings (SI Appendix, Methods). Representative images and current traces from isolated native cerebral and retinal pericytes from NG2-DsRed mice, recorded in the presence of the VDCC agonist Bay K 8644 (500 nM) or antagonist nifedipine (200 nM). Blue trace: subtracted (nifedipine-sensitive) current. (D) Representative image and current traces from isolated cerebral SMC under the same conditions as C. (E) Summary data showing current density for subtracted current conditions in isolated SMCs, brain pericytes, and retinal pericytes. Data are unpaired individual values with mean ± SEM (n = 6 to 11 per cell type from two to three animals; *P < 0.05, **P < 0.01, ***P < 0.001, Brown–Forsythe and Welch ANOVA with Welch’s correction); ns, not significant.
Fig. 8.
Fig. 8.
Pressure-induced constriction along the arteriole-capillary continuum. Schematic illustrates the zonal distribution and morphology of SMCs and pericytes along the arteriole-capillary continuum. Each vascular zone responds differently to increased inlet pressure at the ophthalmic artery. The involvement of VDCCs in pressure-induced constriction is dependent on cell type, with complete or partial involvement in SMCs and transition zone pericytes respectively, and no involvement in distal pericytes.

References

    1. Knot H. J., Nelson M. T., Regulation of arterial diameter and wall [Ca2+] in cerebral arteries of rat by membrane potential and intravascular pressure. J. Physiol. 508, 199–209 (1998). - PMC - PubMed
    1. Nystoriak M. A., et al. , Fundamental increase in pressure-dependent constriction of brain parenchymal arterioles from subarachnoid hemorrhage model rats due to membrane depolarization. Am. J. Physiol. Heart Circ. Physiol. 300, H803–H812 (2011). - PMC - PubMed
    1. Claassen J., et al. , Regulation of cerebral blood flow in humans: Physiology and clinical implications of autoregulation. Physiol. Rev. 101, 1487–1559 (2021). - PMC - PubMed
    1. Gonzales A. L., et al. , Contractile pericytes determine the direction of blood flow at capillary junctions. Proc. Natl. Acad. Sci. U.S.A. 117, 27022–27033 (2020). - PMC - PubMed
    1. Rungta R. L., et al. , Vascular compartmentalization of functional hyperemia from the synapse to the pia. Neuron 99, 362–375.e4 (2018). - PMC - PubMed

Publication types

LinkOut - more resources