. 2023 Feb 28;120(9):e2208792120.
doi: 10.1073/pnas.2208792120. Epub 2023 Feb 21.

Spontaneous nucleation and fast aggregate-dependent proliferation of α-synuclein aggregates within liquid condensates at neutral pH

Affiliations

Spontaneous nucleation and fast aggregate-dependent proliferation of α-synuclein aggregates within liquid condensates at neutral pH

Samuel T Dada et al. Proc Natl Acad Sci U S A. .

Abstract

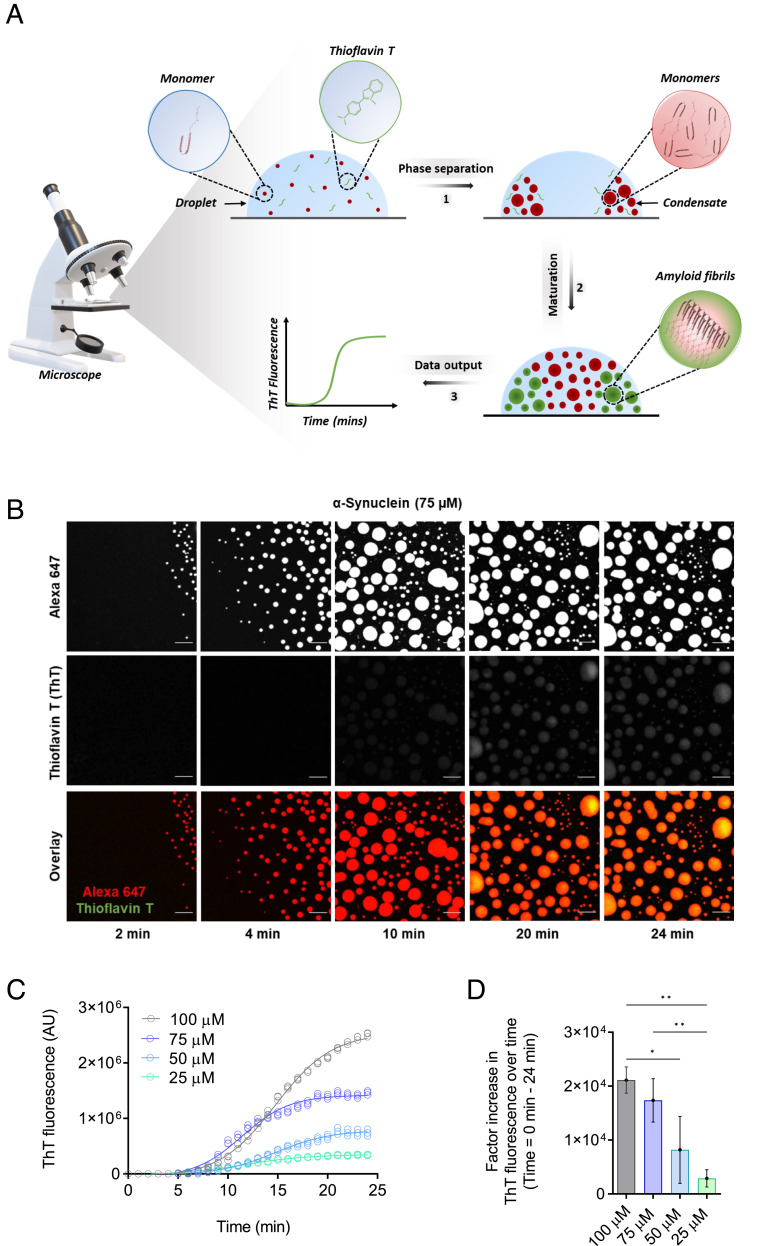
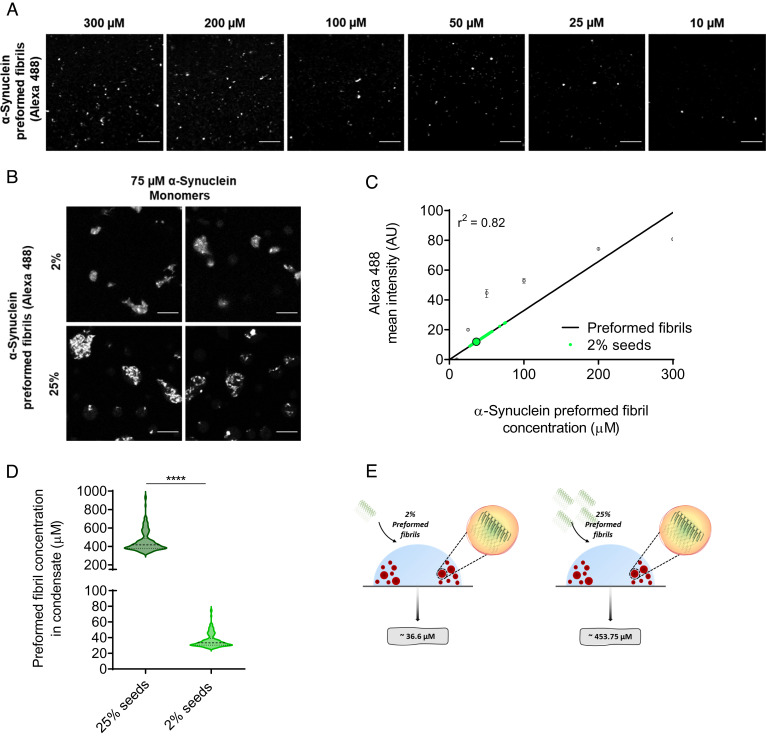
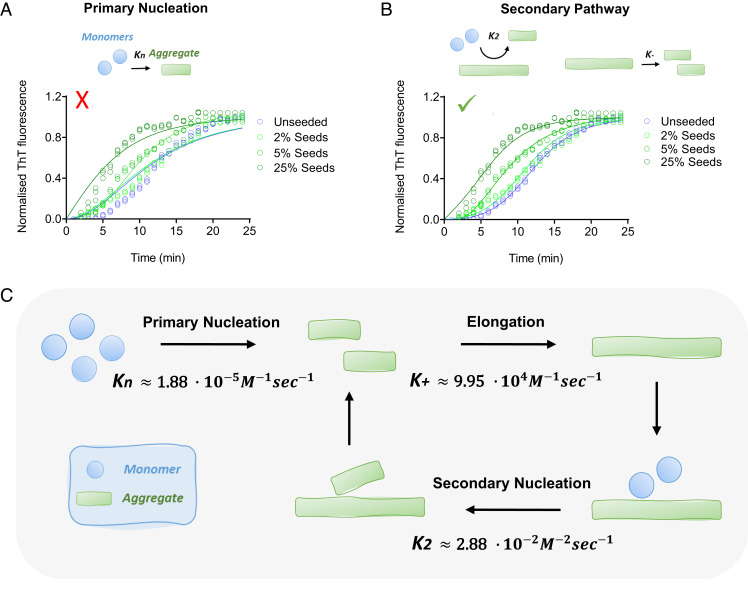
The aggregation of α-synuclein into amyloid fibrils has been under scrutiny in recent years because of its association with Parkinson's disease. This process can be triggered by a lipid-dependent nucleation process, and the resulting aggregates can proliferate through secondary nucleation under acidic pH conditions. It has also been recently reported that the aggregation of α-synuclein may follow an alternative pathway, which takes place within dense liquid condensates formed through phase separation. The microscopic mechanism of this process, however, remains to be clarified. Here, we used fluorescence-based assays to enable a kinetic analysis of the microscopic steps underlying the aggregation process of α-synuclein within liquid condensates. Our analysis shows that at pH 7.4, this process starts with spontaneous primary nucleation followed by rapid aggregate-dependent proliferation. Our results thus reveal the microscopic mechanism of α-synuclein aggregation within condensates through the accurate quantification of the kinetic rate constants for the appearance and proliferation of α-synuclein aggregates at physiological pH.

Keywords: Parkinson’s disease; phase separation; protein condensates.


Conflict of interest statement

The authors declare no competing interest.

Figures

Fig. 1.
Fig. 1.
Development of a ThT-based assay to monitor α-synuclein aggregation within liquid condensates. (A) The assay has three components: 1) the phase separation of α-synuclein into dense liquid droplets (condensates) within dilute liquid droplets, which is monitored using Alexa Fluor 647 fluorescence, 2) the formation of α-synuclein amyloid fibrils over time within the condensates, and 3) the real-time assessment of amyloid formation is performed using ThT fluorescence. (B) Imaging of α-synuclein condensate formation (using Alexa Fluor 647 fluorescence) and aggregation (using ThT fluorescence) over time. In the presence of a crowding agent (10% PEG), α-synuclein monomers (75 μM) form a dense liquid phase surrounded by a dilute liquid phase. In the presence of 20 μM ThT, amyloid-containing condensates can be detected as an increase in the ThT fluorescence signal over time. The images represent an area of the sample that was tracked over time. (The scale bar represents 10 µm.) (C) Quantification of ThT fluorescence over time of the images shown in panel B for 75 μM (blue) α-synuclein. Subsequently, ThT emission for 100 (gray), 50 (cyan), and 25 (turquoise) μM α-synuclein were obtained in the same manner over 24 min. (D) Factor increase in ThT fluorescence intensities across the different concentrations tested (the ThT intensity at 24 min was subtracted by the ThT intensity at 0 min divided by the ThT intensity at 0 min). All experiments were performed in 50 mM Tris-HCl at pH 7.4 in the presence of 10% PEG and 20 μM ThT. The data represent the mean ± SEM of n = 3 individual experiments. One-way ANOVA., *P < 0.1, **P < 0.01.
Fig. 2.
Fig. 2.
The ThT-based aggregation assay is sensitive to changes in the phase separation behavior. (A) Fluorescent images showing α-synuclein condensate formation (using Alexa Fluor 647 fluorescence) and aggregation (using ThT fluorescence) in the presence and absence (control) of 1,6-hexanediol (15% w/v), and 100 mM NaCl. The images suggest that the assay is sensitive to changes in the interactions between α-synuclein monomers as a result of 1,6-hexandiol and NaCl. (The scale bars represent 10 μm.) The images displayed represent an area of the droplet that was tracked over time. (B) Quantification of the ThT emission over time for the images shown in panel A for 75 μM α-synuclein (control) (blue) in the presence of 15% (w/v) (dark purple) and 5% (w/v) (light purple) 1,6-hexanediol over a 24-min period. (C) Factor increase in ThT fluorescence intensities from the data in panel B (the ThT intensity at 24 min was subtracted by the ThT intensity at 0 min divided by the ThT intensity at 0 min). (D) Rate of α-synuclein aggregation for the images in panel A in the presence and absence (blue) of 10 mM (light pink) and 100 mM (pink) NaCl over a 24-min period. (E) Factor increase in ThT fluorescence intensities from data in panel D (the ThT intensity at 24 min was subtracted by the ThT intensity at 0 min divided by the ThT intensity at 0 min). All experiments were performed using 75 µM α-synuclein in 50 mM Tris-HCl at pH 7.4 in the presence of 10% PEG and 20 µM ThT. The data represent mean ± SEM of n = 3 individual experiments. One-way ANOVA., *P < 0.1, **P < 0.01
Fig. 3.
Fig. 3.
The aggregation kinetics of α-synuclein within condensates show a weak concentration dependence. Within condensates, normalized aggregation data at four α-synuclein concentrations (100, 75, 50, and 25 μM), yielded almost no variations between different concentrations (SI Appendix, Fig. S5 A and B). (AC) The concentration required for phase separation of α-synuclein was obtained using a microfluidic device. (A) Representative fluorescence images displaying the timeline of condensate formation within several droplets (assigned a number from 1 to 6) trapped within a microfluidic chamber at 0, 140, 187, and 195 min (Movie S4). (B) Magnified image from panel C showing a droplet at the start (0 min) of the experiment and following initiation of phase separation (140 min). The concentration required for phase separation is obtained from the initial protein concentration and the change in droplet radius from the start (R1) of monitoring the droplet to the point at which phase separation is observed (R2). (The scale bar represents 50 µm.) (C) α-Synuclein concentration at which phase separation was observed within droplets as shown in panels C and D, at different initial protein concentrations (100 (gray), 200 (pink), and 100 (purple) μM) in the presence of 10% PEG, was calculated to be an average of 527, 604, and 538 μM, respectively (SI Appendix, Table S1). (D) Fluorescence images of Alexa Fluor 647 at a range of concentrations (1,000, 500, 200, and 50 μM) and images of monomeric α-synuclein (400, 100, 75, and 50 μM) condensates 10 min from the onset of phase separation. (The scale bar represents 10 µm.) (E) Fluorescence intensity of Alexa Fluor 647 from at a range of 1 to 1,000 μM from images shown in panel D was used to obtain a calibration curve of fluorescence signal for calibration (linear regression, r2 = 0.92). Small circles are the individual condensates measured for each α-synuclein concentration (n > 70 condensates per concentration), and big circles indicate the mean α-synuclein condensate intensity for each concentration [400 (light purple), 100 (gray), 75 (blue), and 50 (cyan) μM, and 4, 1, 0.75, and 0.5 μM for their respective 1% Alexa Fluor 647 protein concentration]. (F) Quantification of the mean fluorescence intensity (left Y axis) for individual condensates at each α-synuclein Alexa Fluor 647 concentrations 10 min from the onset of phase separation, and concentration within liquid droplets of α-synuclein labeled with Alexa Fluor 647 (right Y axis) at a range of bulk concentrations (400, 100, 75, and 50 μM) was estimated to be 335 ± 98, 319 ± 64, 284 ± 48 and 258 ± 34 μM after 10 min from the onset of phase separation (n > 70 condensates per concentration). (G) The concentration at which amyloid formation of α-synuclein was observed using a microfluidic device. Representative fluorescence images displaying the timeline of amyloid formation within droplet (75 μM α-synuclein, 10% PEG and 20 μM ThT) trapped within a microfluidic chamber at 0, 20, 40, and >60 min post protein phase separation (PPS). The α-synuclein concentration at which phase separation was observed within droplets was calculated to be an average of 538 ± 15.9 μM, and the concentration within droplet at which amyloid formation was observed was calculated to be an average of 660 ± 21.4 μM. (The scale bar represents 50 µm.) Data are shown for a representative experiment that was repeated at least three times.
Fig. 4.
Fig. 4.
The addition preformed α-synuclein fibrils bypasses the primary nucleation of α-synuclein within condensates. (A) Schematic diagram illustrating the seeding process within the condensates. In the presence of preformed fibrils (seeds), aggregation is accelerated (2 and 3), whereas in the absence of seeds aggregation is slower (1). Increasing seed concentration results in a reduced lag time. (B) Representative fluorescence imaging displaying condensate formation by α-synuclein monomer (75 μM, labeled with Alexa Fluor 647) in the presence of 2% (1.5 μM) preformed α-synuclein fibrils (labeled with Alexa Fluor 488), 10% PEG in 50 mM Tris-HCl (pH 7.4). At 1 min, the presence of preformed fibrils within the droplet is observed in the dilute liquid phase. Upon the formation of droplets, preformed fibrils are seen to colocalize with condensates thereby accelerating aggregation by propelling the formation of aggregates. The images represent an area of the sample that was tracked over time. (The scale bar represents 10 µm.) (C) 2D and 3D rendered images of different droplets showing that preformed fibrils (labeled with Alexa Fluor 488) are directly recruited into α-synuclein condensates (labeled with Alexa Fluor 647) (Movie S5). (The scale bar represents 10 µm.) (D) Progression of ThT emission as a function of time (24 min) for 75 μM α-synuclein monomers (unseeded) (blue) with the addition of 2% (1.5 μM) (light green) and 25% (18.75 μM) (dark green) preformed fibrils. The data report on the increase in the ThT signal over time (unseeded, 2% seeds, 25% seeds). (E) Relative increase in the raw data values of the ThT fluorescence intensities from time from the onset of phase separation to 24 min post it. All aggregation assays were performed in 50 mM Tris-HCl (pH 7.4) in the presence of 10% PEG and 20 μM ThT. The results are shown as mean ± SEM. One-way ANOVA; ***P ≤ 0.001.
Fig. 5.
Fig. 5.
Determination of the concentration of preformed α-synuclein fibrils within α-synuclein condensates. (A) Fluorescence images of preformed α-synuclein fibrils (labeled with Alexa Fluor 488) at decreasing concentrations (300, 200, 100, 50, 25, and 10 μM). (The scale bar represents 10 µm.) (B) Representative fluorescence imaging displaying colocalization of 2% and 25% preformed fibrils (labeled with Alexa Fluor 488) within α-synuclein condensates (labeled with Alexa Fluor 647) 10 min post phase separation. (The scale bar represents 10 µm.) (C) The data reported in panel A were used for the calibration of the Alexa Fluor 488 fluorescence signal (linear regression, r2 = 0.82). The small circles are the individual condensates (n > 100) measured 10 min from the onset of phase separation and the big circle indicates the mean intensity of all fluorescently labeled preformed α-synuclein fibril within condensates. The Alexa Fluor 488 fluorescence signal of condensates in the assay containing 25% preformed fibrils had a higher intensity than the intensity of 300 μM preformed fibrils used for the calibration curve. (D) The average concentration of 2% (1.5 μM) and 25% (18.75 μM) preformed α-synuclein fibrils (labeled with Alexa Fluor 488) within α-synuclein condensates (75 μM) was estimated as 36 μM (SD = ±9, Min = 27, Max = 75 μM) and 454 μM (SD = ±112, Min = 341, Max = 939 μM), respectively. The results refer to 10 min from the onset of phase separation (n > 100 condensates). (E) Schematic illustrating the total concentration of preformed α-synuclein fibrils within condensates to be approximately 36.3 and 453.75 µM for 2% and 25% seeds, respectively. Data are from a representative experiment repeated three times with similar results. All seeded aggregation experiments were performed in 50 mM Tris-HCl (pH 7.4) and 10% PEG. The results are shown as mean ± SEM. One-way ANOVA; ****P ≤ 0.0001.
Fig. 6.
Fig. 6.
Secondary processes dominate α-synuclein aggregate proliferation within liquid condensates at physiological pH. (A and B) Analysis of the results of the ThT aggregation assay using AmyloFit, with the normalized aggregation curves measured as a function of time from the unperturbed system (blue), as well as in the presence of 2% (light green), 5% (green) and 25% (dark green) seeds. The graphs represent the best fits of different models in which, respectively, primary nucleation (A) and secondary processes (B) are assumed to be the dominant mechanism of aggregation. The mean residual errors were 0.009 (with nc=2) (A) and 0.002 with ( nc=2, n2=1 ) (B). The solid lines represent the best fit to each respective condition. We used m0=30 mM in all fits. For the unseeded assay we used M0=0 , and for the seeded assay we used M0=36.3 , 90.75 and 453.75 μM for 2%, 5% and 25% seeds, respectively. All experiments were performed three times using 75 µM α-synuclein in 50 mM Tris-HCl (pH 7.4) in the presence of 10% PEG and 20 µM ThT. (C) Illustration of the microscopic processes involved in α-synuclein aggregation, in the case when fragmentation is not contributing significantly, using the assay reported in this work. The associated rate constants are also reported. Despite the low values of the rate constants for primary nucleation and secondary nucleation, the aggregation process proceeds rapidly within the dense phase because of the high concentration of α-synuclein.

References

    1. Feigin V. L., et al. , Global, regional, and national burden of neurological disorders, 1990–2016: A systematic analysis for the global burden of disease study 2016. Lancet Neurol. 18, 459–480 (2019). - PMC - PubMed
    1. Balestrino R., Schapira A., Parkinson disease. Eur. J. Neurol. 27, 27–42 (2020). - PubMed
    1. Goedert M., Spillantini M. G., Del Tredici K., Braak H., 100 years of Lewy pathology. Nat. Rev. Neurol. 9, 13 (2013). - PubMed
    1. Shahmoradian S. H., et al. , Lewy pathology in Parkinson’s disease consists of crowded organelles and lipid membranes. Nat. Neurosci. 22, 1099–1109 (2019). - PubMed
    1. Spillantini M. G., et al. , α-synuclein in Lewy bodies. Nature 388, 839–840 (1997). - PubMed

Publication types