. 2023 Feb 20;24(1):29.
doi: 10.1186/s13059-023-02850-y.

siVAE: interpretable deep generative models for single-cell transcriptomes

Affiliations

siVAE: interpretable deep generative models for single-cell transcriptomes

Yongin Choi et al. Genome Biol. .

Abstract

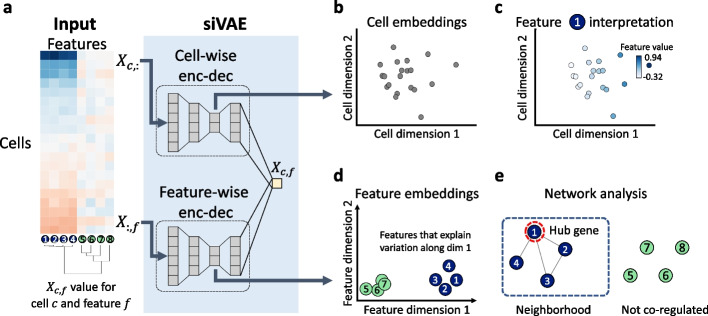
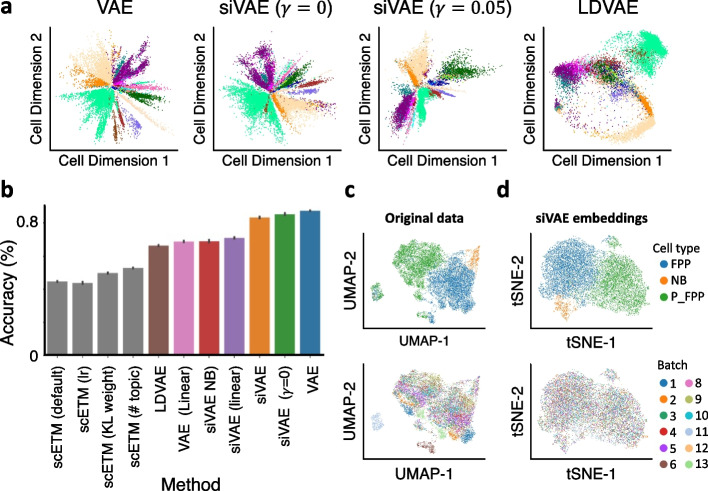
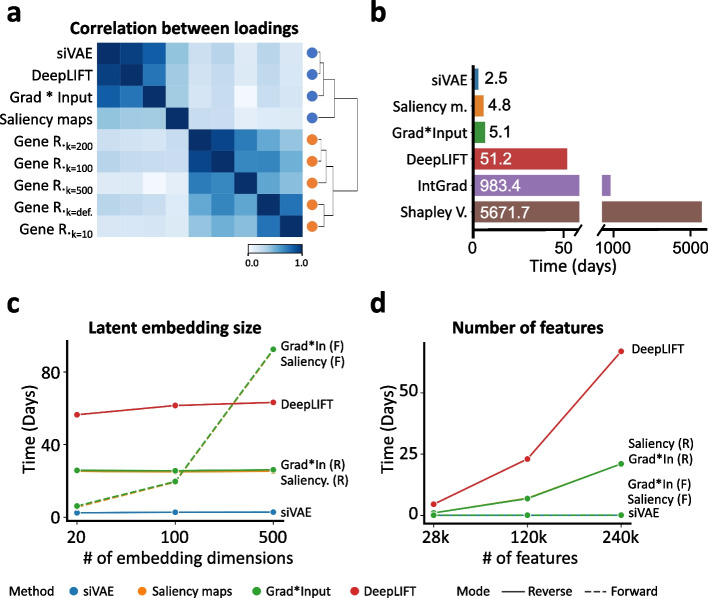
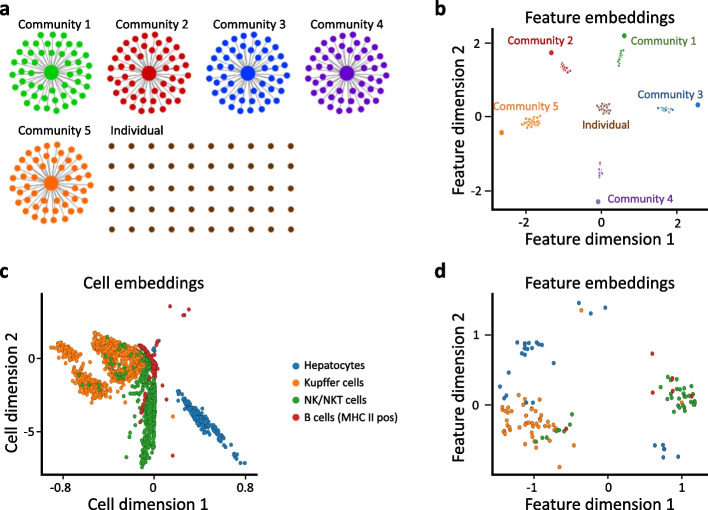
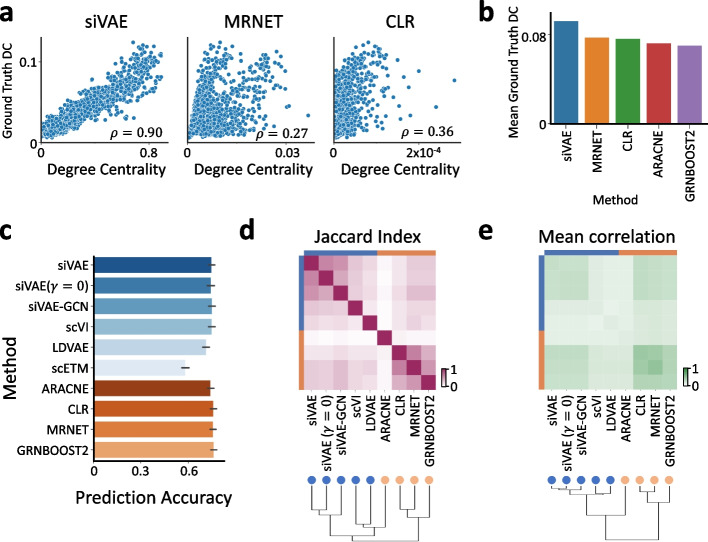
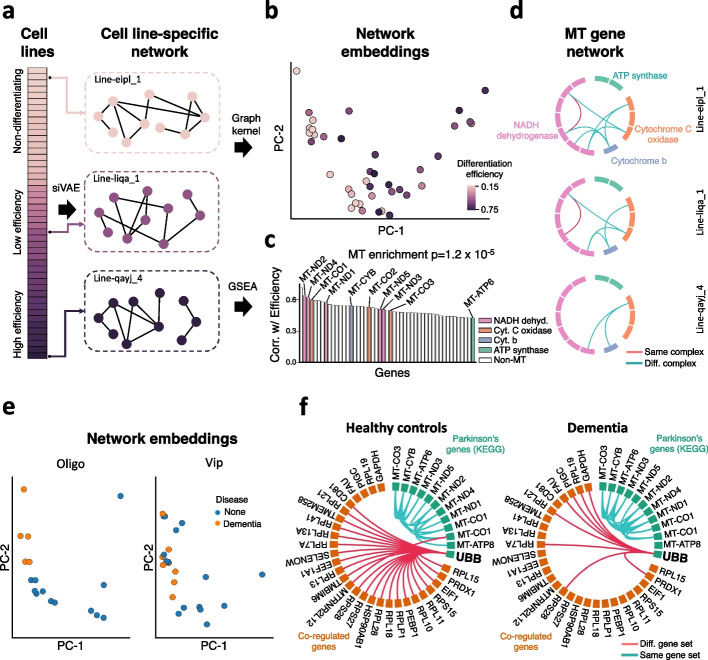
Neural networks such as variational autoencoders (VAE) perform dimensionality reduction for the visualization and analysis of genomic data, but are limited in their interpretability: it is unknown which data features are represented by each embedding dimension. We present siVAE, a VAE that is interpretable by design, thereby enhancing downstream analysis tasks. Through interpretation, siVAE also identifies gene modules and hubs without explicit gene network inference. We use siVAE to identify gene modules whose connectivity is associated with diverse phenotypes such as iPSC neuronal differentiation efficiency and dementia, showcasing the wide applicability of interpretable generative models for genomic data analysis.


Conflict of interest statement

The authors declare that they have no competing interests.

Figures

Fig. 1
Fig. 1
siVAE infers interpretable representations of single-cell genomic data. a The input to siVAE is a cell-by-feature matrix; shown here is a synthetic gene expression matrix of eight genes, four of which are tightly regulated (genes 1–4), and the other four of which vary independently (genes 5–8). siVAE is a neural network consisting of a pair of encoder-decoders, that jointly learn a cell-embedding space and feature embedding space. The cell-wise encoder-decoder acts similarly to a canonical VAE, where the input to the encoder is a single cell c’s measurement across all input features (Xc, :). The cell-wise encoder uses the input cell measurements to compute an approximate posterior distribution over the location of the cell in the cell-embedding space. The feature-wise encoder-decoder takes as input measurements for a single feature f across all input training cells (X:, f), and computes an approximate posterior distribution over the location of the feature in the feature embedding space. The decoders of the cell-wise and feature-wise encoder-decoders combine to output the expression level of feature f in cell c (Xc, f). b,d Visualization of the cell and feature embedding spaces learned from the gene expression matrix in a. Note in d that the embeddings of genes 1, 2, 3, and 4 all have large magnitudes along dimension 1 but not dimension 2, suggesting genes 1, 2, 3, and 4 explain variation in the cell-embedding space along dimension 1. Genes 5, 6, 7, and 8 are located at the origin of the feature embedding space, suggesting they do not co-vary with other features. c The expression patterns of gene 1 are overlaid on the cells in the cell-embedding space. Gene 1 clearly increases in expression when inspecting cells from left to right, consistent with the feature embedding space that shows Gene 1 having large loadings on dimension 1. e A trained siVAE model can be used to identify hubs and gene neighbors in a gene co-expression network, without the need to explicitly infer a co-expression network
Fig. 2
Fig. 2
Accuracy evaluation of cell-embedding spaces. a 2D visualization of the inferred cell-embedding spaces of a canonical VAE, siVAE (γ = 0) (no regularization term), siVAE (γ = 0.05) (default regularization weight), and LDVAE. Each point represents a cell and is colored according to cell type. b Barplot indicating the balanced accuracy of a k-NN (k = 80) classifier predicting the cell type labels of single cells based on their inferred position in the cell-embedding space inferred by various methods trained on the fetal liver atlas dataset. Higher accuracies are interpreted as more accurate inferred cell-embedding spaces. c 2D UMAP visualization of the original NeurDiff dataset, without batch correction. Top row shows annotation based on cell type, and the bottom row shows annotation based on the batch. d Same as c, except visualization is a tSNE visualization of the siVAE-inferred cell-embedding space where siVAE corrects for batch within the model
Fig. 3
Fig. 3
siVAE generates accurate and fast interpretations. a Heatmap indicating the mean pairwise correlation between the interpretations (loadings) of siVAE, Gene Relevance, and three neural net feature attribution methods (saliency maps, grad × input, and DeepLIFT), where correlations have been averaged over each of the 2 embedding dimensions for the fetal liver atlas dataset. b Bar plot indicating the time required to train siVAE, compared to training a canonical VAE and executing one of the feature attribution methods on the LargeBrainAtlas dataset. For feature attribution methods, the run times were extrapolated due to infeasibly long run times; additional experiments demonstrate the feasibility of extrapolation (Additional file 1: Figure S10). c Line plot indicating the time required to train siVAE compared to training a canonical VAE and executing a feature attribution method on the LargeBrainAtlas dataset, when the number of embedding dimensions for siVAE is varied and the number of features is fixed at 28k. d Line plot indicating the time required to train siVAE compared to training a canonical VAE and executing a feature attribution method on the BrainCortex dataset, when the number of features is being varied and the number of embedding dimensions is fixed at 20
Fig. 4
Fig. 4
Co-expressed genes tend to co-localize in the feature embedding space. a The gene co-expression network used to simulate single-cell expression data for this experiment. The network consists of five tightly correlated groups of 50 genes each, along with 50 isolated, disconnected genes. Nodes represent genes, edges represent strong correlations. b Scatterplot of the feature embeddings inferred by siVAE trained on the dataset simulated from the network in a. Each point represents a gene, colored and labeled by the community it belongs to in a. c Scatterplot of the cell-embedding space inferred by siVAE trained on the fetal liver atlas dataset. Each point represents a cell and is colored based on its pre-defined cell type. d Scatterplot of feature embeddings inferred by siVAE trained on the fetal liver atlas dataset. Each point represents a marker gene and is colored based on its prior known association to a cell type
Fig. 5
Fig. 5
siVAE analysis yields insight into the underlying gene co-expression network structure of a cell population. a Scatterplot showing the correlation between ground truth degree centrality and predicted degree centrality based on either siVAE estimates or by computing node degree when a network is inferred using the MRNET or CLR algorithms. Each point represents a gene. b Average ground truth degree centrality of the top 50 genes ranked by predicted degree centrality across different methods. Higher average ground truth degree centrality indicates better concordance between the ground truth and predictions. c Bar plot indicating the prediction accuracy (% of variance explained) of the neighborhood gene sets when predicting each query gene, averaged over the 152 query genes with the highest predicted degree centrality in the fetal liver atlas dataset. Blue bars denote methods based on dimensionality reduction, while orange bars denote methods based on explicit gene regulatory network inference. d Heatmap indicating the pairwise Jaccard index (overlap) between neighborhood genes identified by pairs of methods. e Heatmap indicating the mean pairwise correlation in expression between neighborhood gene sets identified by pairs of methods
Fig. 6
Fig. 6
siVAE identifies gene modules whose connectivity correlates with cell population-level phenotypes. a Schematic illustrating how in experimental designs such as the NeurDiff dataset where there is a population of cells sequenced for each of several iPSC cell lines, then siVAE can be trained on each population separately to implicitly learn a gene co-expression network for each iPSC line. By conceptually ordering the cell lines by an iPSC line phenotype such as differentiation efficiency, siVAE can identify gene modules whose connectivity is correlated with differentiation efficiency. b Using a graph kernel, siVAE models representing different iPSC lines were embedded into a single scatterplot in which each cell line is represented by a single point, and two cell lines are proximal in the scatterplot if their respective gene co-expression networks are globally similar in structure. c Bar plot indicating the Spearman correlation between estimated degree centrality and differentiation efficiency for top correlated genes. Each bar indicates a gene, and the colored bars indicate mitochondrial genes. Each color represents a different mitochondrial complex. d Visualization of edges connecting mitochondrial genes in the siVAE inferred gene network for three selected cell lines. For each cell line, only seven edges between mitochondrial genes are considered for visualization; these seven edges represent those edges that are significantly negatively correlated with differentiation efficiency. e Scatterplot of donor embeddings in the DementiaDataset. Each point represents a donor’s network, and the donor is colored by dementia case-control status. Network embeddings are shown for both oligodendrocytes and Vip interneurons. f Visualization of edges between the KEGG Parkinson’s Disease gene set and their network neighbors, for both cases and controls. The edges were summarized for cases and controls separately by only keeping edges that were present in at least 20% of the donors within each case-control group

References

    1. Wang J, et al. Single-Cell Co-expression Analysis Reveals Distinct Functional Modules, Co-regulation Mechanisms and Clinical Outcomes. PLoS Comput Biol. 2016;12:e1004892. doi: 10.1371/journal.pcbi.1004892. - DOI - PMC - PubMed
    1. Chepelev I, Wei G, Wangsa D, Tang Q, Zhao K. Characterization of genome-wide enhancer-promoter interactions reveals co-expression of interacting genes and modes of higher order chromatin organization. Cell Res. 2012;22:490–503. doi: 10.1038/cr.2012.15. - DOI - PMC - PubMed
    1. Cakir B, et al. Comparison of visualization tools for single-cell RNAseq data. NAR Genomics Bioinforma. 2020;2:lqaa052. doi: 10.1093/nargab/lqaa052. - DOI - PMC - PubMed
    1. Andrews TS, Hemberg M. Identifying cell populations with scRNASeq. Mol Asp Med. 2018;59:114–122. doi: 10.1016/j.mam.2017.07.002. - DOI - PubMed
    1. Saelens W, Cannoodt R, Todorov H, Saeys Y. A comparison of single-cell trajectory inference methods. Nat Biotechnol. 2019;37:547–554. doi: 10.1038/s41587-019-0071-9. - DOI - PubMed

Publication types