. 2023 Feb 21:12:e83442.
doi: 10.7554/eLife.83442.

The landscape of antibody binding affinity in SARS-CoV-2 Omicron BA.1 evolution

Affiliations

The landscape of antibody binding affinity in SARS-CoV-2 Omicron BA.1 evolution

Alief Moulana et al. Elife. .

Abstract

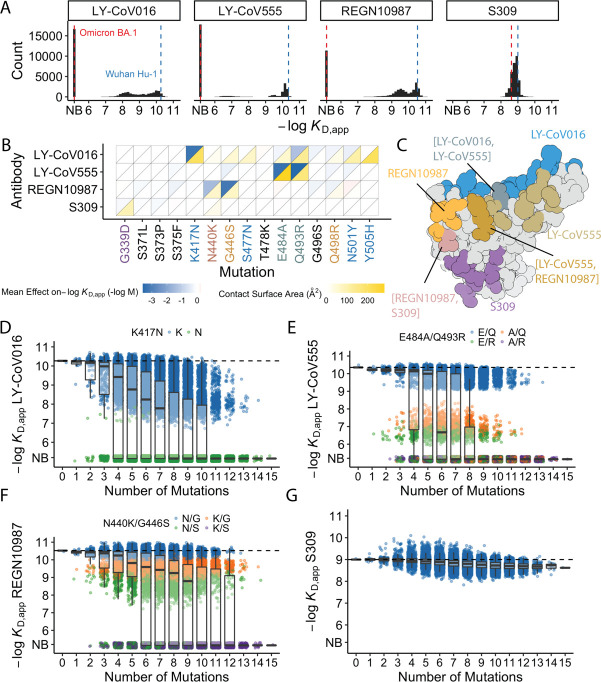
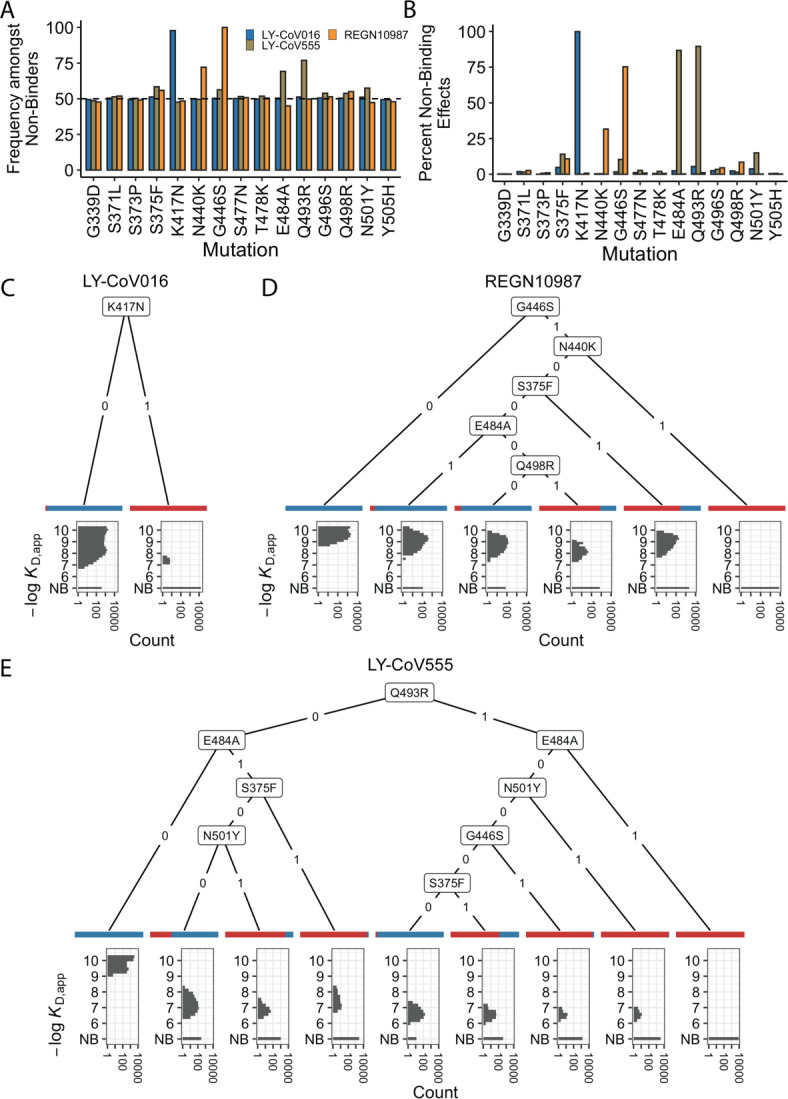
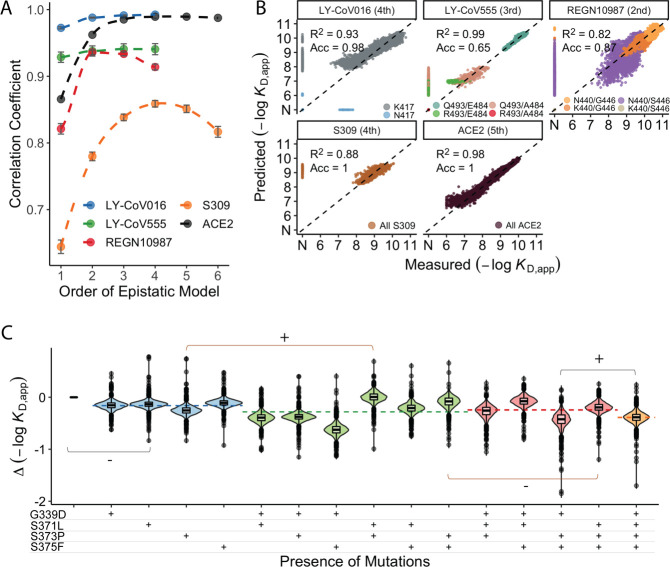
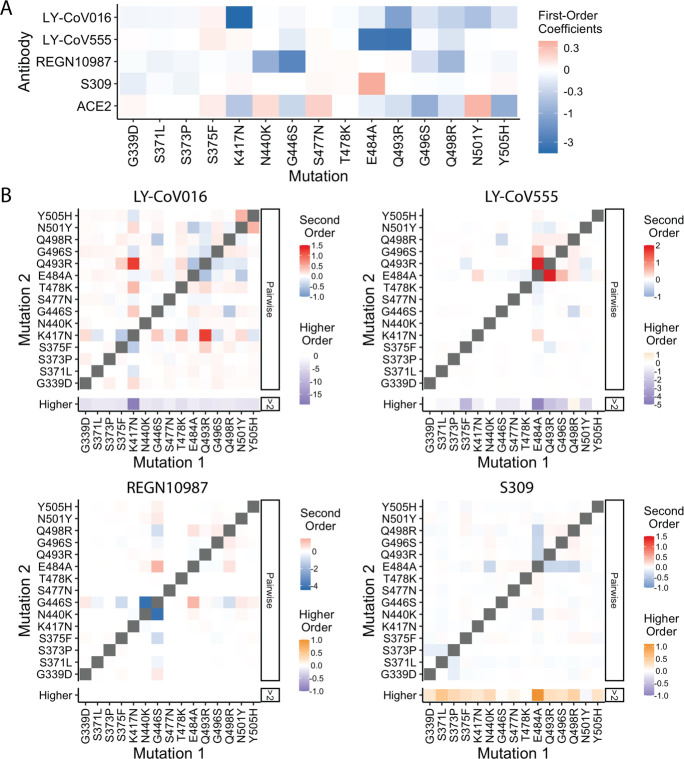
The Omicron BA.1 variant of SARS-CoV-2 escapes convalescent sera and monoclonal antibodies that are effective against earlier strains of the virus. This immune evasion is largely a consequence of mutations in the BA.1 receptor binding domain (RBD), the major antigenic target of SARS-CoV-2. Previous studies have identified several key RBD mutations leading to escape from most antibodies. However, little is known about how these escape mutations interact with each other and with other mutations in the RBD. Here, we systematically map these interactions by measuring the binding affinity of all possible combinations of these 15 RBD mutations (215=32,768 genotypes) to 4 monoclonal antibodies (LY-CoV016, LY-CoV555, REGN10987, and S309) with distinct epitopes. We find that BA.1 can lose affinity to diverse antibodies by acquiring a few large-effect mutations and can reduce affinity to others through several small-effect mutations. However, our results also reveal alternative pathways to antibody escape that does not include every large-effect mutation. Moreover, epistatic interactions are shown to constrain affinity decline in S309 but only modestly shape the affinity landscapes of other antibodies. Together with previous work on the ACE2 affinity landscape, our results suggest that the escape of each antibody is mediated by distinct groups of mutations, whose deleterious effects on ACE2 affinity are compensated by another distinct group of mutations (most notably Q498R and N501Y).

Keywords: S. cerevisiae; SARS-CoV-2; antibody escape; evolutionary biology; fitness landscape; immune evasion; omicron variant.


Conflict of interest statement

AM, TD, JC, AR No competing interests declared, AP, MD has or has recently consulted for Leyden Labs, AG, TS is an inventor on Fred Hutch licensed patents related to viral deep mutational scanning (patent numbers WO2022146484, WO2020006494 and application number US20210147832), JB is an inventor on Fred Hutch licensed patents related to viral deep mutational scanning (patent numbers WO2022146484, WO2020006494 and application number US20210147832). JDB has or has recently consulted for Apriori Bio, Oncorus, Moderna, and Merck

Figures

Figure 1.
Figure 1.. Antibody affinity landscape.
(A) Binding affinities to one antibody from each class (LY-CoV016, LY-CoV555, REGN10987, and S309, from classes 1–4, respectively) across all N=32,768 receptor binding domain (RBD) genotypes tested. Binding affinities are shown as −logKD,app; vertical blue and red dashed lines indicate the −logKD,app for Wuhan Hu-1 and Omicron BA.1, respectively. ‘NB’ denotes non-binding (escape). (B) Mean effect of each mutation on antibody and ACE2 affinity (defined as the change in −logKD,app resulting from mutation averaged across all backgrounds at the other loci) plotted with contact surface area between each residue and each antibody. Mutations are colored by footprint highlighted in (C). (C) Structure of SARS-CoV-2 BA.1 RBD with each antibody footprint annotated (PDB ID 7 KMG, 6WPT, 7C01, and 6XDG). Residues with overlapping footprints are colored and labeled accordingly. (D–G) Distribution of binding affinities to different antibodies grouped by number of Omicron BA.1 mutations. Binding affinity of the Wuhan Hu-1 variant is indicated by horizontal dashed lines. Variants with antibody escape mutations of interest are colored as noted in each key. NB denotes non-binding (escape). In all figures, the boxplots boxes show the spread between the 25th and 75th percentiles, with the median indicated by a horizontal line.
Figure 1—figure supplement 1.
Figure 1—figure supplement 1.. Schematic overview of the Tite-seq method and reproducibility of dissociation constants.
(A) The plasmid library containing receptor binding domain (RBD) sequences is transformed into a standard yeast display strain AWY101. The library is then incubated with soluble, fluorescent monoclonal antibody (mAb; either one of the four mAbs used in the study) and sorted by flow cytometry into bins based on mAb fluorescence. Deep sequencing of each bin results in the mean bin (Bavg) estimate of each RBD variant across varying mAb concentrations to produce a titration curve. Apparent equilibrium dissociation constants are then inferred by fitting Bavg to the mAb concentration. (B) Correlation of −log(KD,app) between the first and second biological replicates, (sample size = 32768).
Figure 1—figure supplement 2.
Figure 1—figure supplement 2.. Distribution of maximum log-fluorescence difference.
To determine whether a genotype is a non-binder, the maximum difference of log fluorescence across concentrations of the genotype is computed. The dashed line represents the threshold below which a genotype with a certain maximum difference is considered non-binding.
Figure 2.
Figure 2.. Escape mutations and genotypes.
(A) Fraction of antibody-escaping genotypes with each mutation. (B) Fraction of variants for which a given mutation confers antibody escape. Effects are colored as in (A). (C–E) Decision trees of escape phenotype for each antibody modeled as a function of the mutations present. Each leaf is annotated by the proportion of the genotypes that escape the corresponding antibody (red: escape and blue: does not) and by corresponding affinity distribution. NB denotes non-binding.
Figure 3.
Figure 3.. Epistastic effects on antibody binding.
(A) Correlation coefficients between the measured values of −log(KD,app) and the model estimate for various orders of epistatic models. Correlations are computed on the hold-out subset averaged over 10-folds of cross-validation. Zoomed-in version for orders 3–6 (sample size n=10) (B) Binding affinities predicted by complete coefficients from the optimum epistasis model are compared to the measured binding affinities for each antibody. Points are colored by mutations present in the genotypes, ‘N’ corresponds to non-binding genotypes. The accuracy measures the quality of the binary classification between binders and non-binders, and the coefficient of determination R² refers to the correlation between inferred and measured binding affinities, excluding non-binders. (C) Effects of mutations G339D, S371L, S373P, and S375F on S309 affinity grouped by the presence of each mutation. Each violin color corresponds to the number of mutations considered. Dashed line color denotes the average effect for each group represented by the violin color. The gray and orange lines indicate cases where the addition of mutation S371L has a positive (+) or negative (−) effect depending on the background (sample size n=2048).
Figure 3—figure supplement 1.
Figure 3—figure supplement 1.. Epistatic coefficients.
(A) First-order effects in fourth order epistatic interaction models. (B) For each antibody, higher-order interaction coefficient of a mutation (shown at bottom of heat map plot) is calculated by summing over all third- and fourth-order interaction coefficients involving the mutation.
Figure 4.
Figure 4.. Trade-offs and comparison with ACE2 affinity.
(A) Distribution of ACE2 binding affinity grouped by number of BA.1 mutations and the number of monoclonal antibodies escaped. The dashed line corresponds to the affinity of the Wuhan strain. (B) ACE2 affinity distribution grouped by antibodies escaped and the presence of compensatory mutations (N501Y and Q498R). The dotted line represents the affinity of the Wuhan strain, while the dashed line shows the average affinity of the genotypes without compensatory mutations that bind all antibodies. (C) Affinities to monoclonal antibodies plotted as a function of the ACE2 affinity for all genotypes. Points are colored by presence of Q498R and N501Y. (D) Mean effect (averaged over all backgrounds at the other loci) of each mutation on antibody affinity and on ACE2 affinity (red-blue colormap) compared to the enrichment of their frequency with Q498R and N501Y (orange colormap). The enrichment score is defined as the normalized frequency a mutation emerged on a branch on which mutations Q498R and N501Y appear divided by the normalized frequency it emerged on any intermediate background between Wuhan and BA.1.

References

    1. Adams RM, Mora T, Walczak AM, Kinney JB. Measuring the sequence-affinity landscape of antibodies with massively parallel titration curves. eLife. 2016;5:e23156. doi: 10.7554/eLife.23156. - DOI - PMC - PubMed
    1. Ao D, Lan T, He X, Liu J, Chen L, Baptista-Hon DT, Zhang K, Wei X. SARS-cov-2 omicron variant: immune escape and vaccine development. MedComm. 2022;3:e126. doi: 10.1002/mco2.126. - DOI - PMC - PubMed
    1. Barnes CO, Jette CA, Abernathy ME, Dam KMA, Esswein SR, Gristick HB, Malyutin AG, Sharaf NG, Huey-Tubman KE, Lee YE, Robbiani DF, Nussenzweig MC, West AP, Bjorkman PJ. SARS-cov-2 neutralizing antibody structures inform therapeutic strategies. Nature. 2020a;588:682–687. doi: 10.1038/s41586-020-2852-1. - DOI - PMC - PubMed
    1. Barnes CO, West AP, Huey-Tubman KE, Hoffmann MAG, Sharaf NG, Hoffman PR, Koranda N, Gristick HB, Gaebler C, Muecksch F, Lorenzi JCC, Finkin S, Hägglöf T, Hurley A, Millard KG, Weisblum Y, Schmidt F, Hatziioannou T, Bieniasz PD, Caskey M, Robbiani DF, Nussenzweig MC, Bjorkman PJ. Structures of human antibodies bound to SARS-cov-2 spike reveal common epitopes and recurrent features of antibodies. Cell. 2020b;182:828–842. doi: 10.1016/j.cell.2020.06.025. - DOI - PMC - PubMed
    1. Borkovec M. Ggplot” visualizations for the “partykit” package. 1.0.0Ggplot. 2019 https://cran.r-project.org/web/packages/ggparty/ggparty.pdf

Publication types