. 2023 Feb 16;186(4):732-747.e16.
doi: 10.1016/j.cell.2023.01.020.

Human hematopoietic stem cell vulnerability to ferroptosis

Affiliations

Human hematopoietic stem cell vulnerability to ferroptosis

Jiawei Zhao et al. Cell. .

Abstract

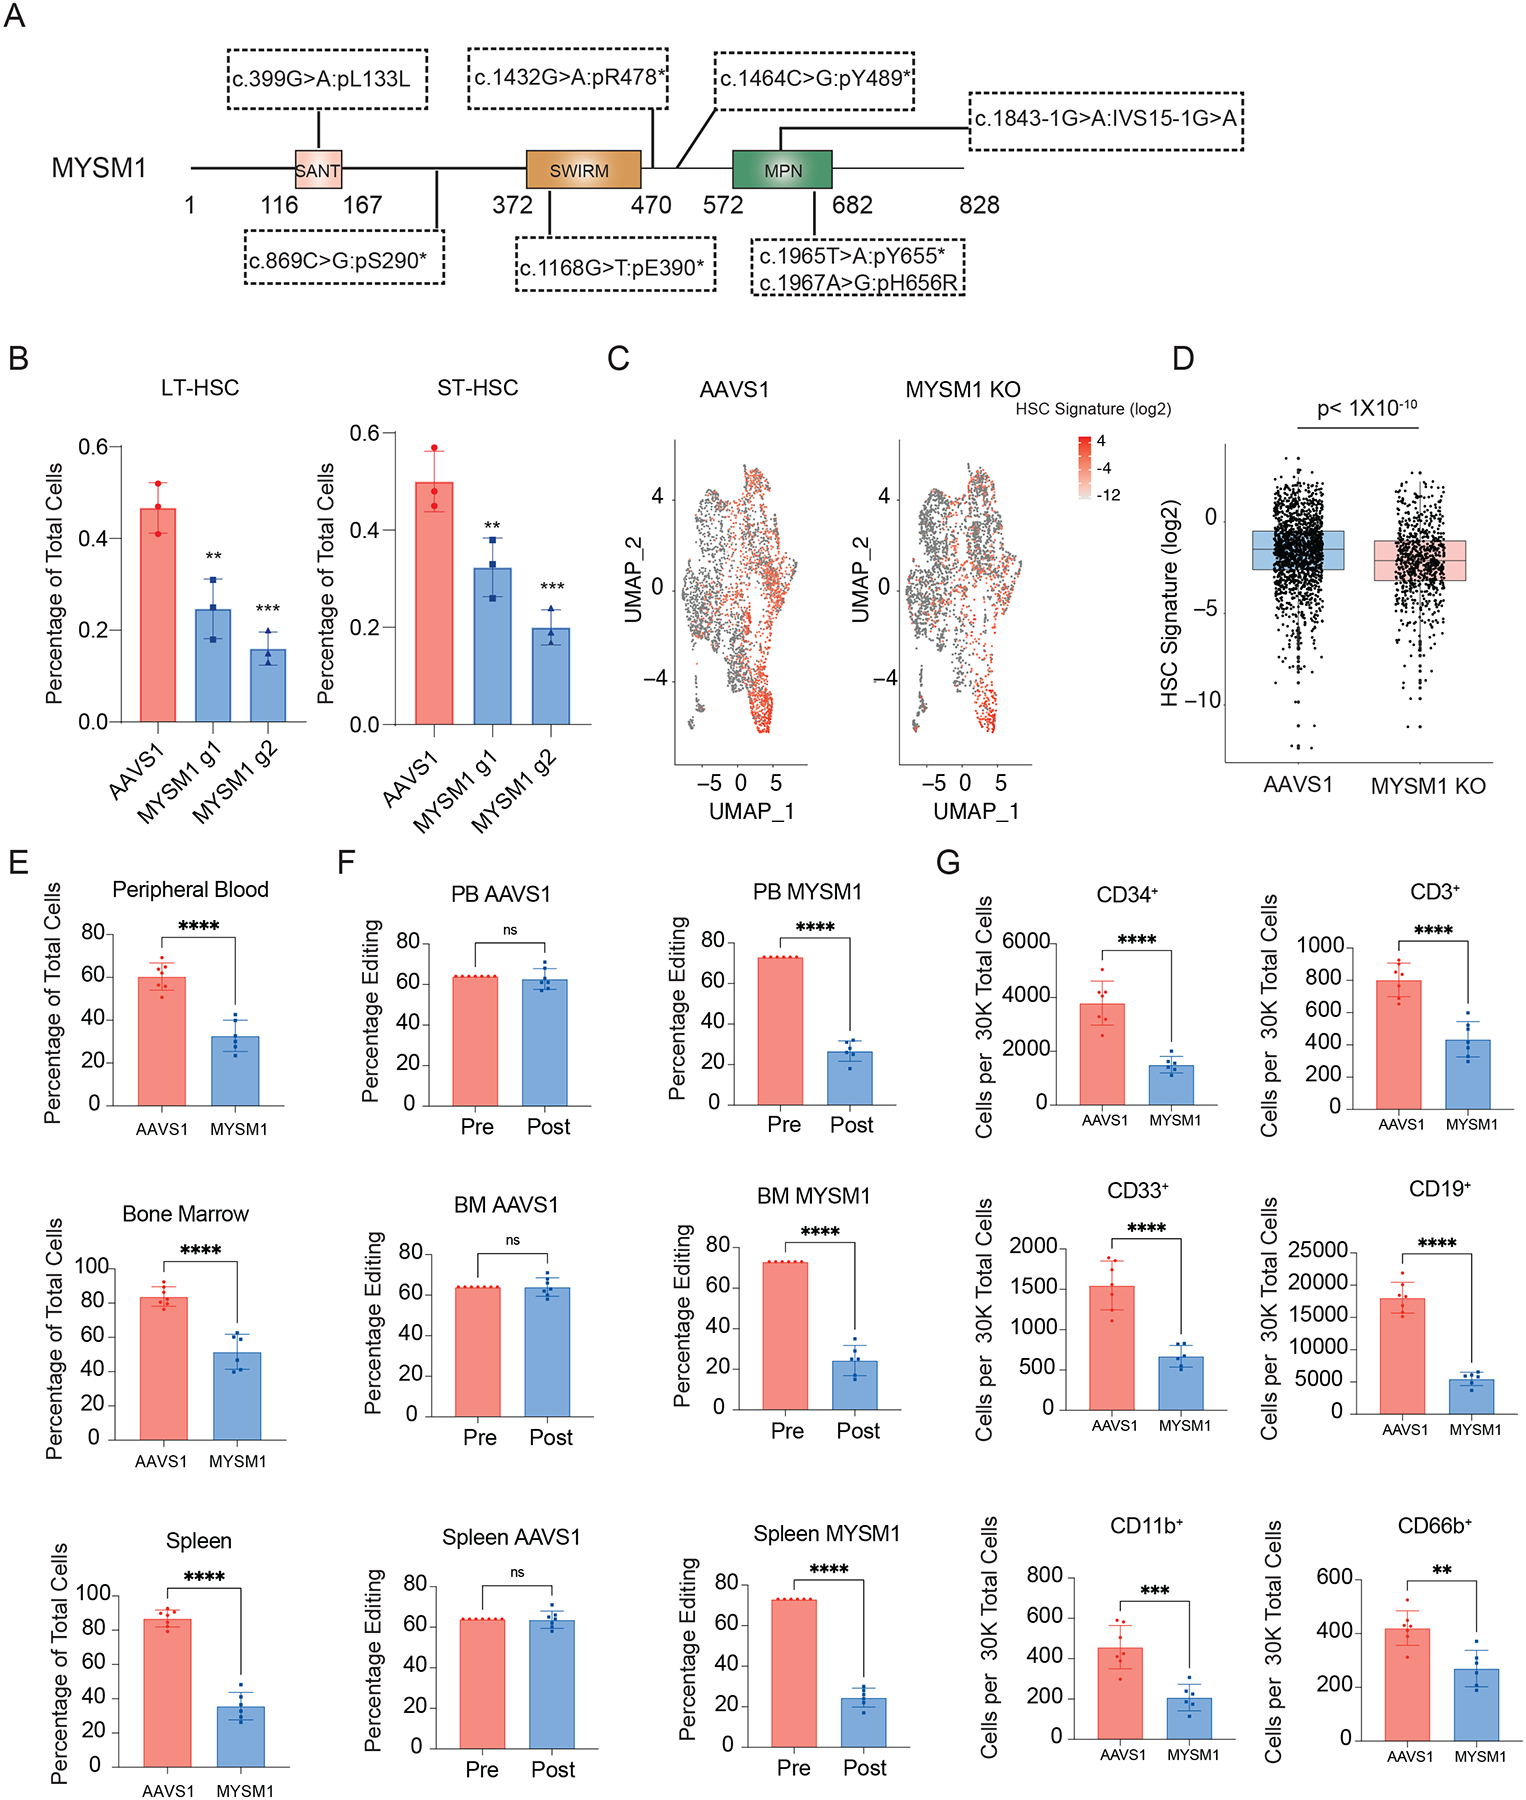
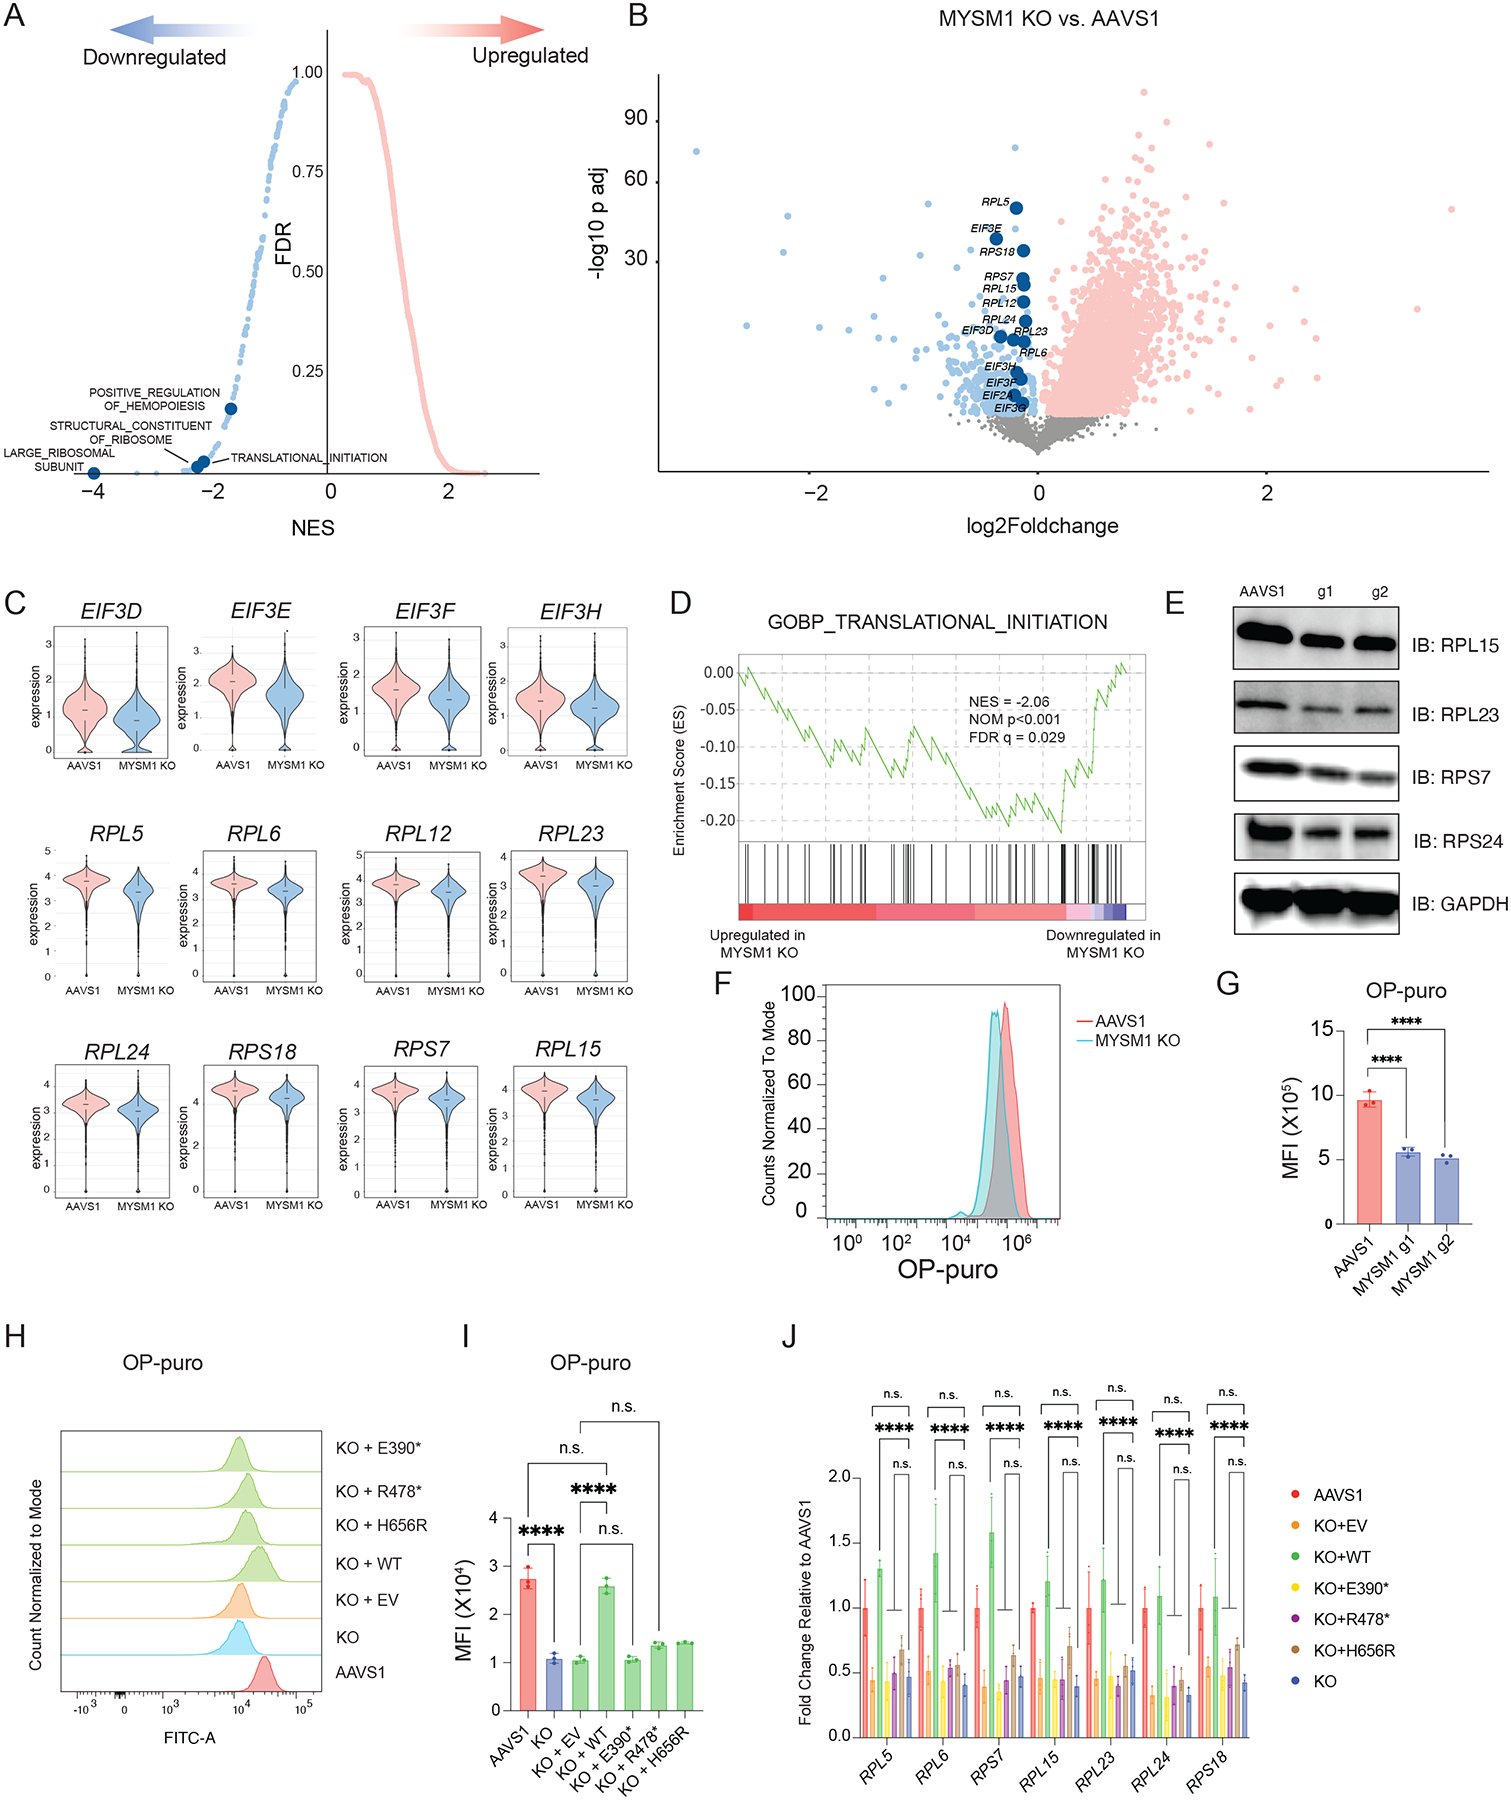
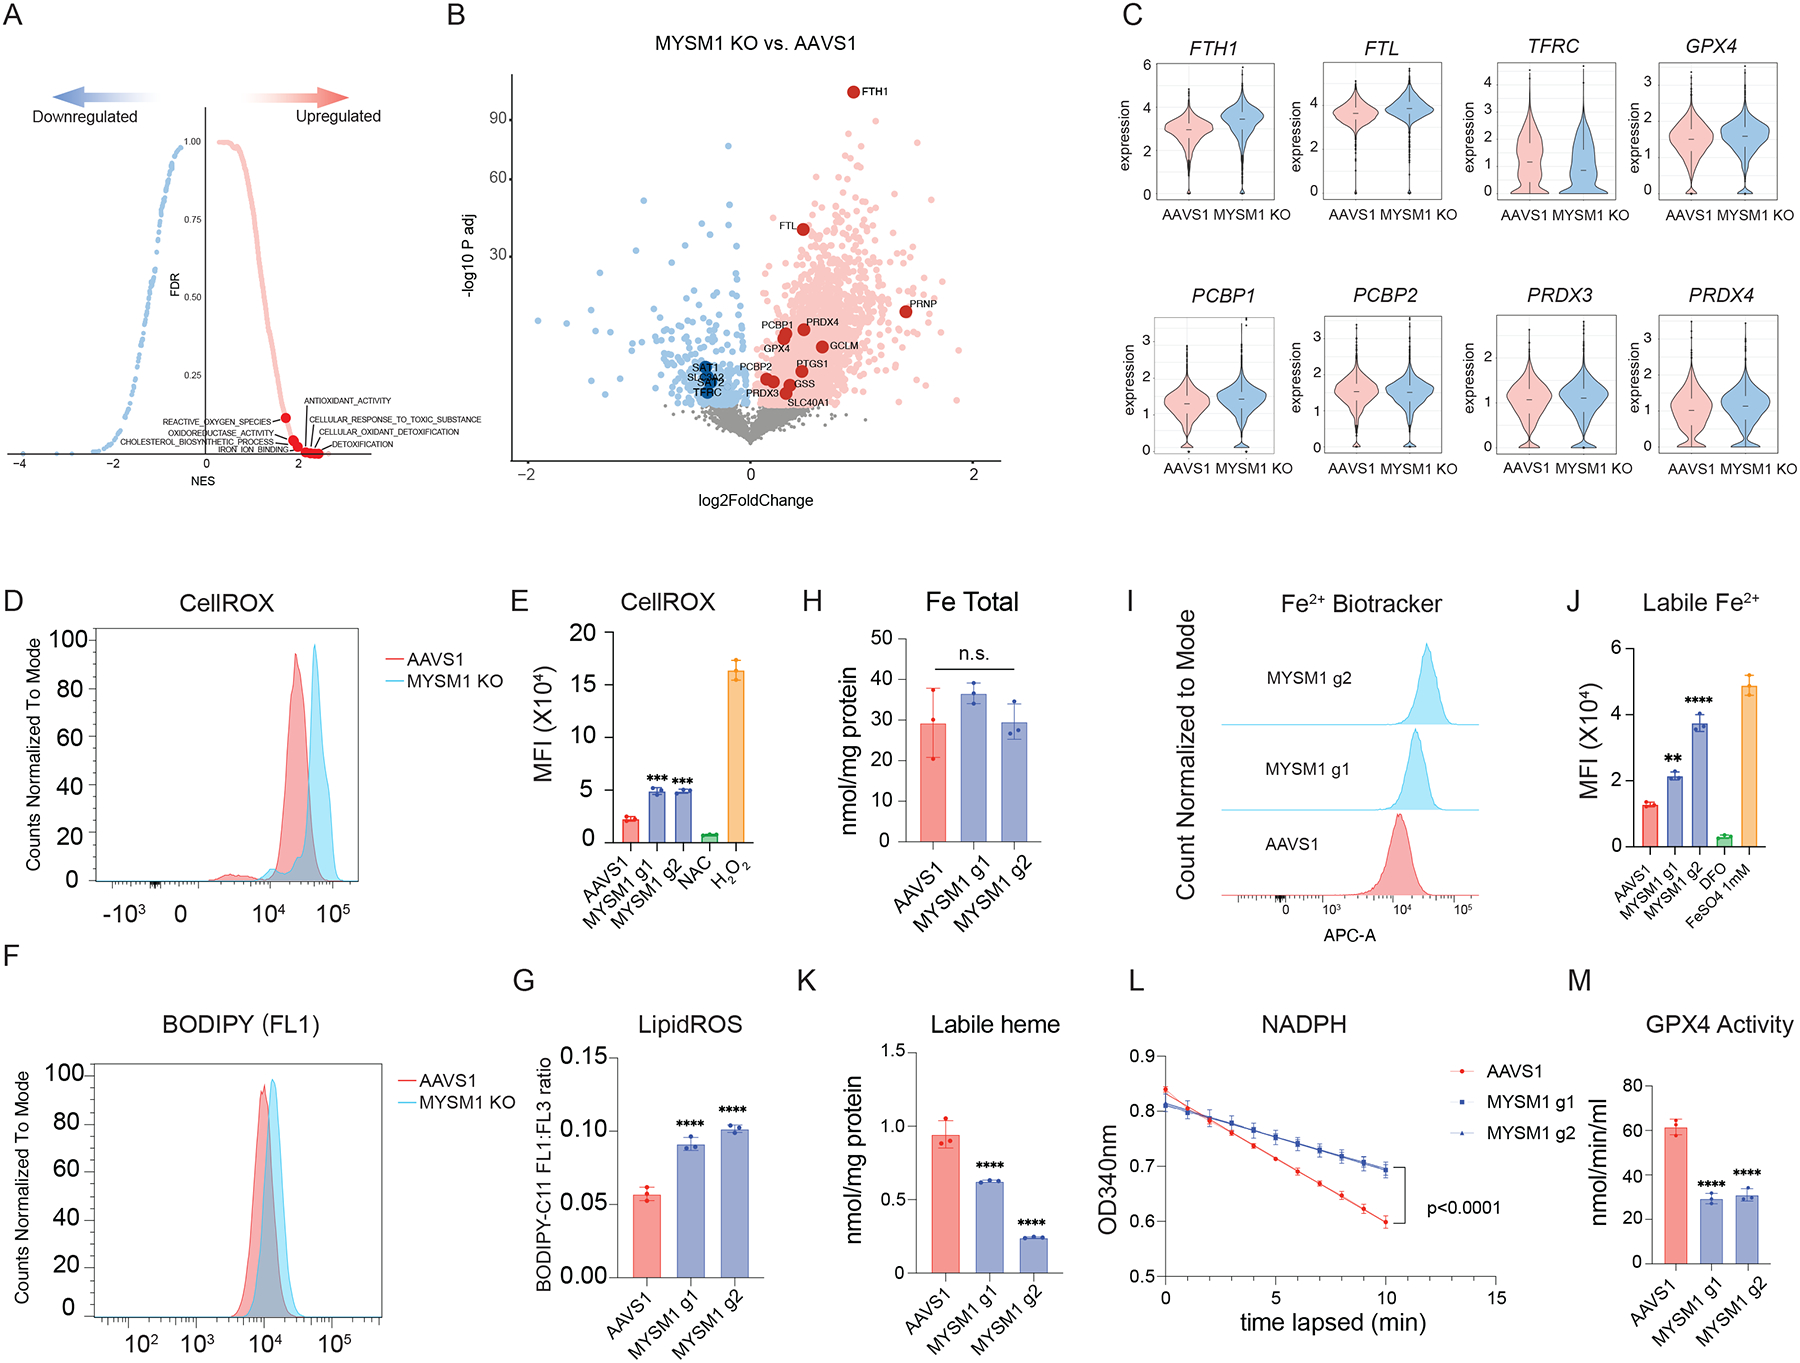
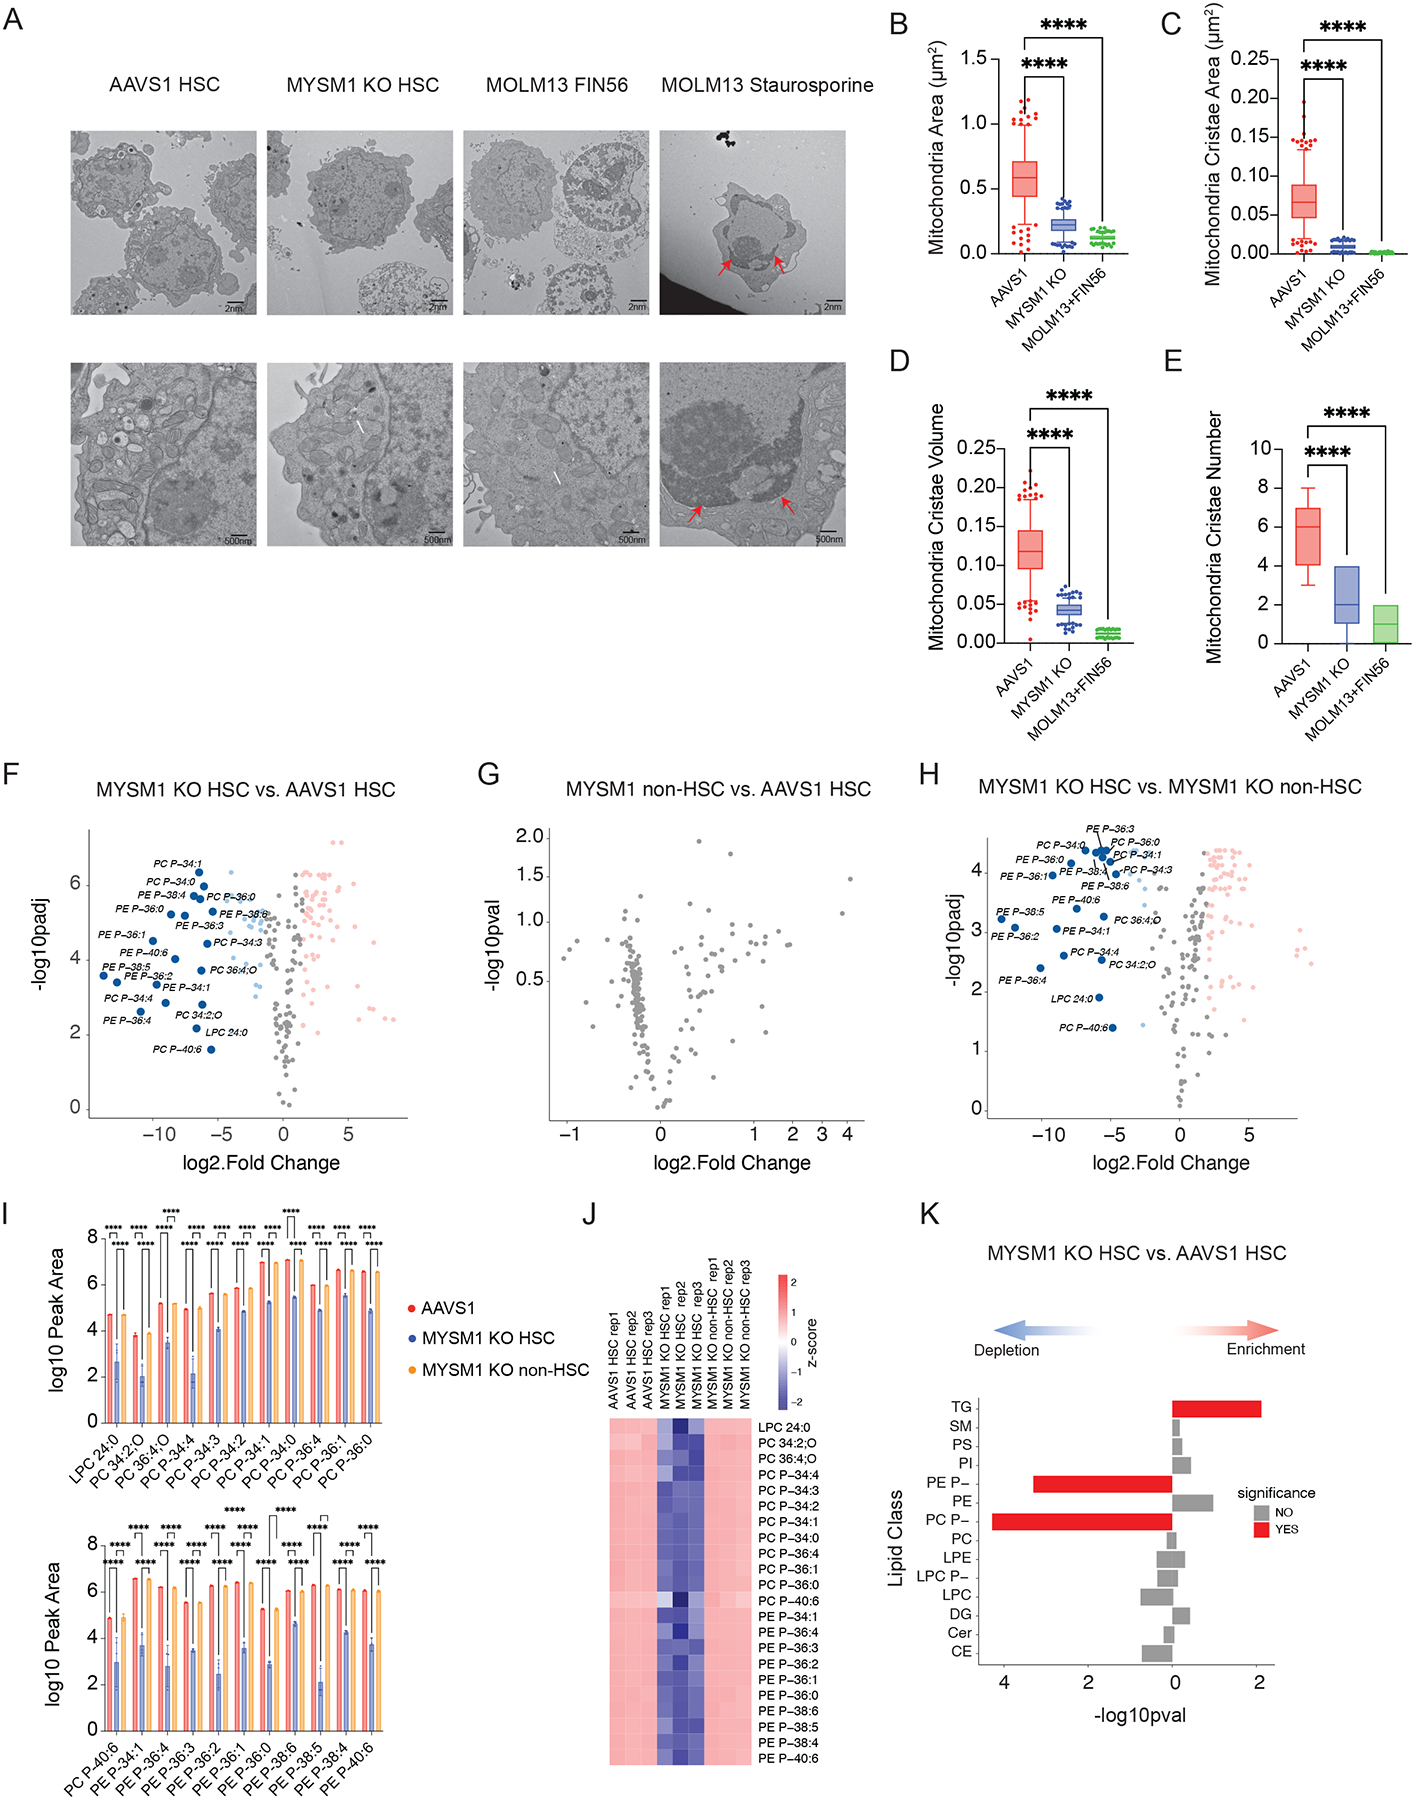
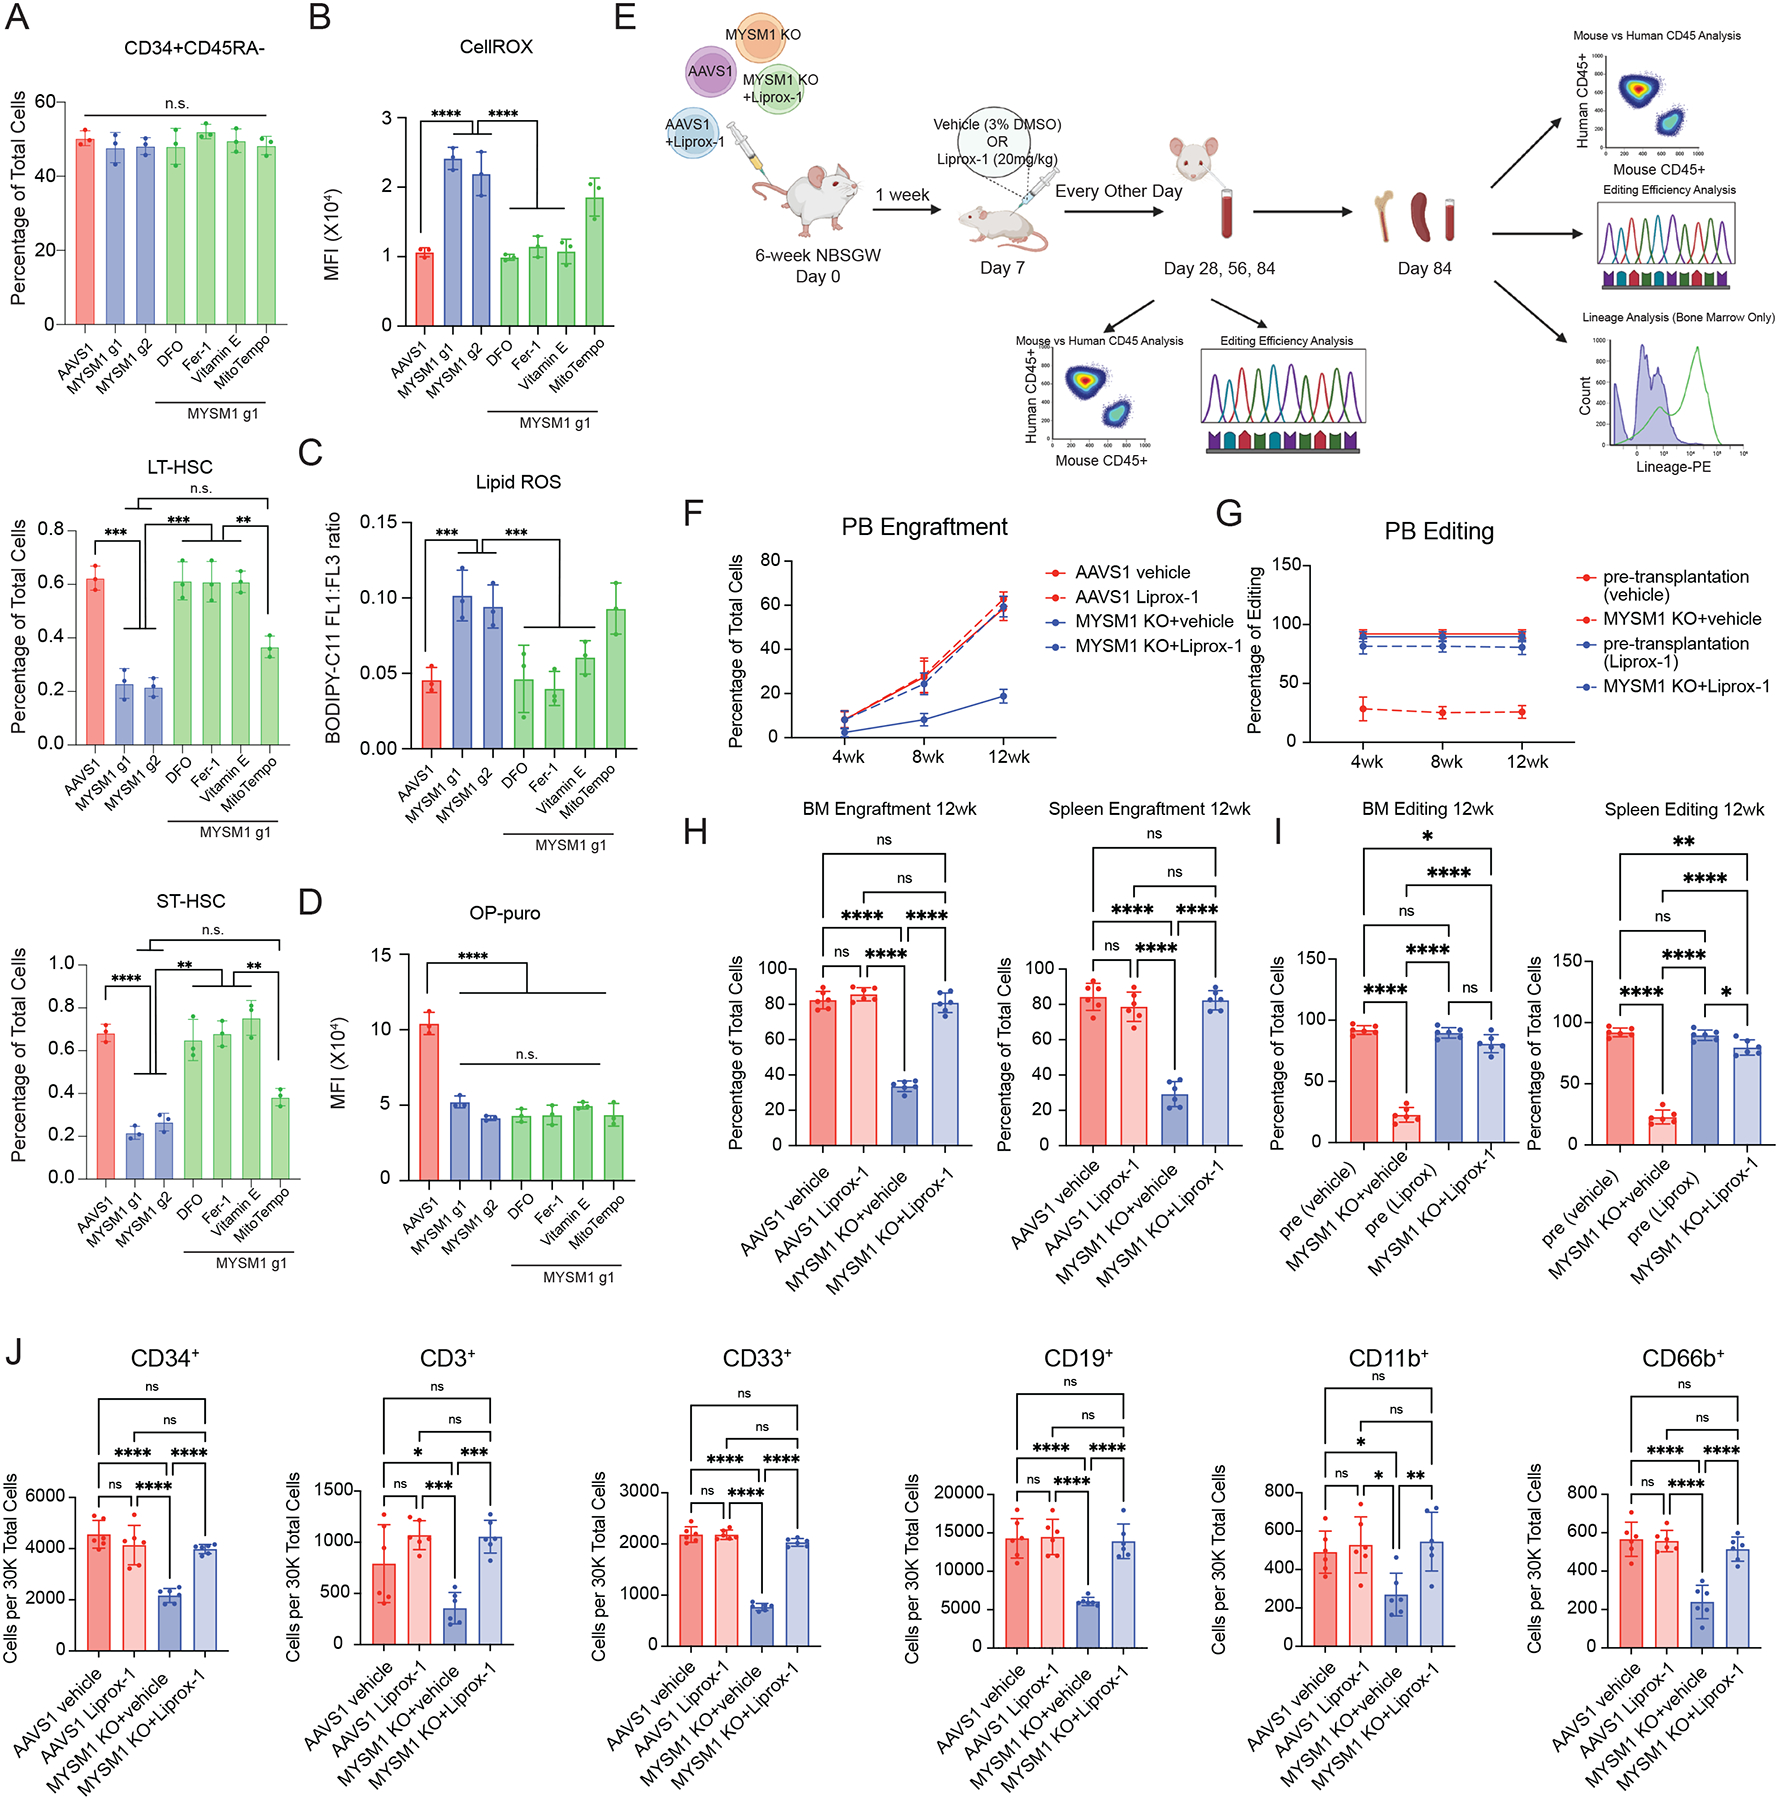
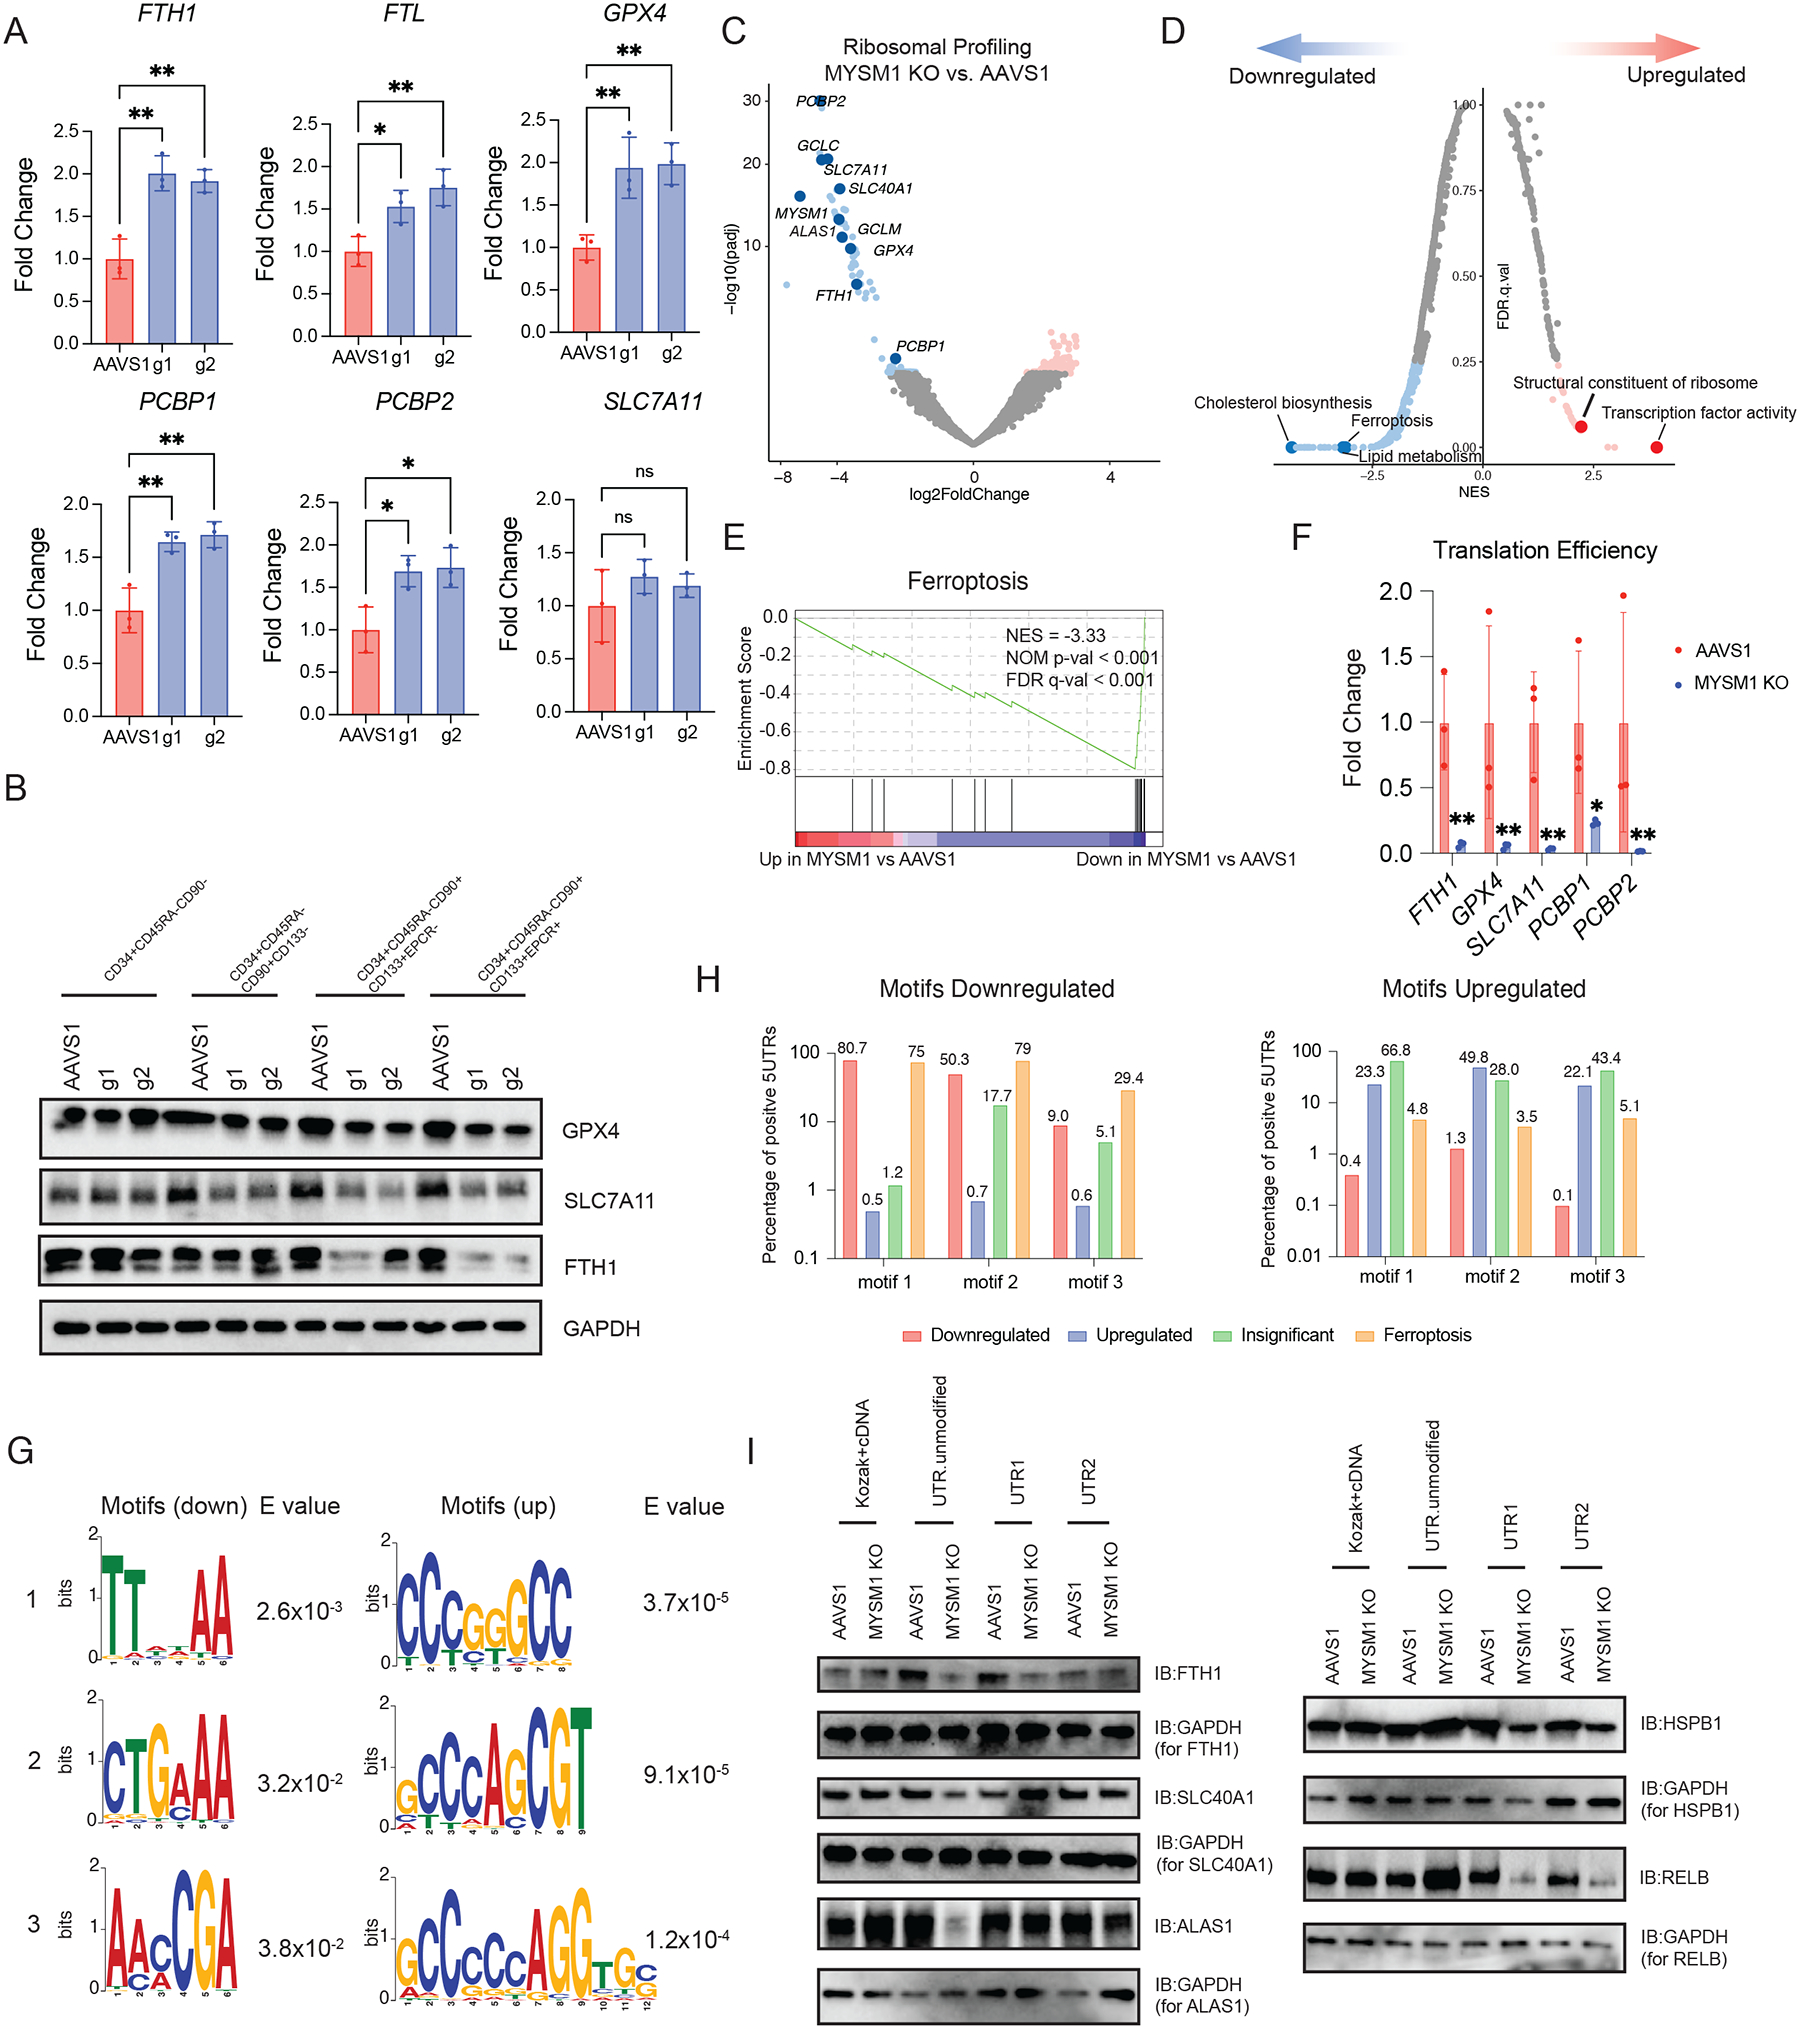
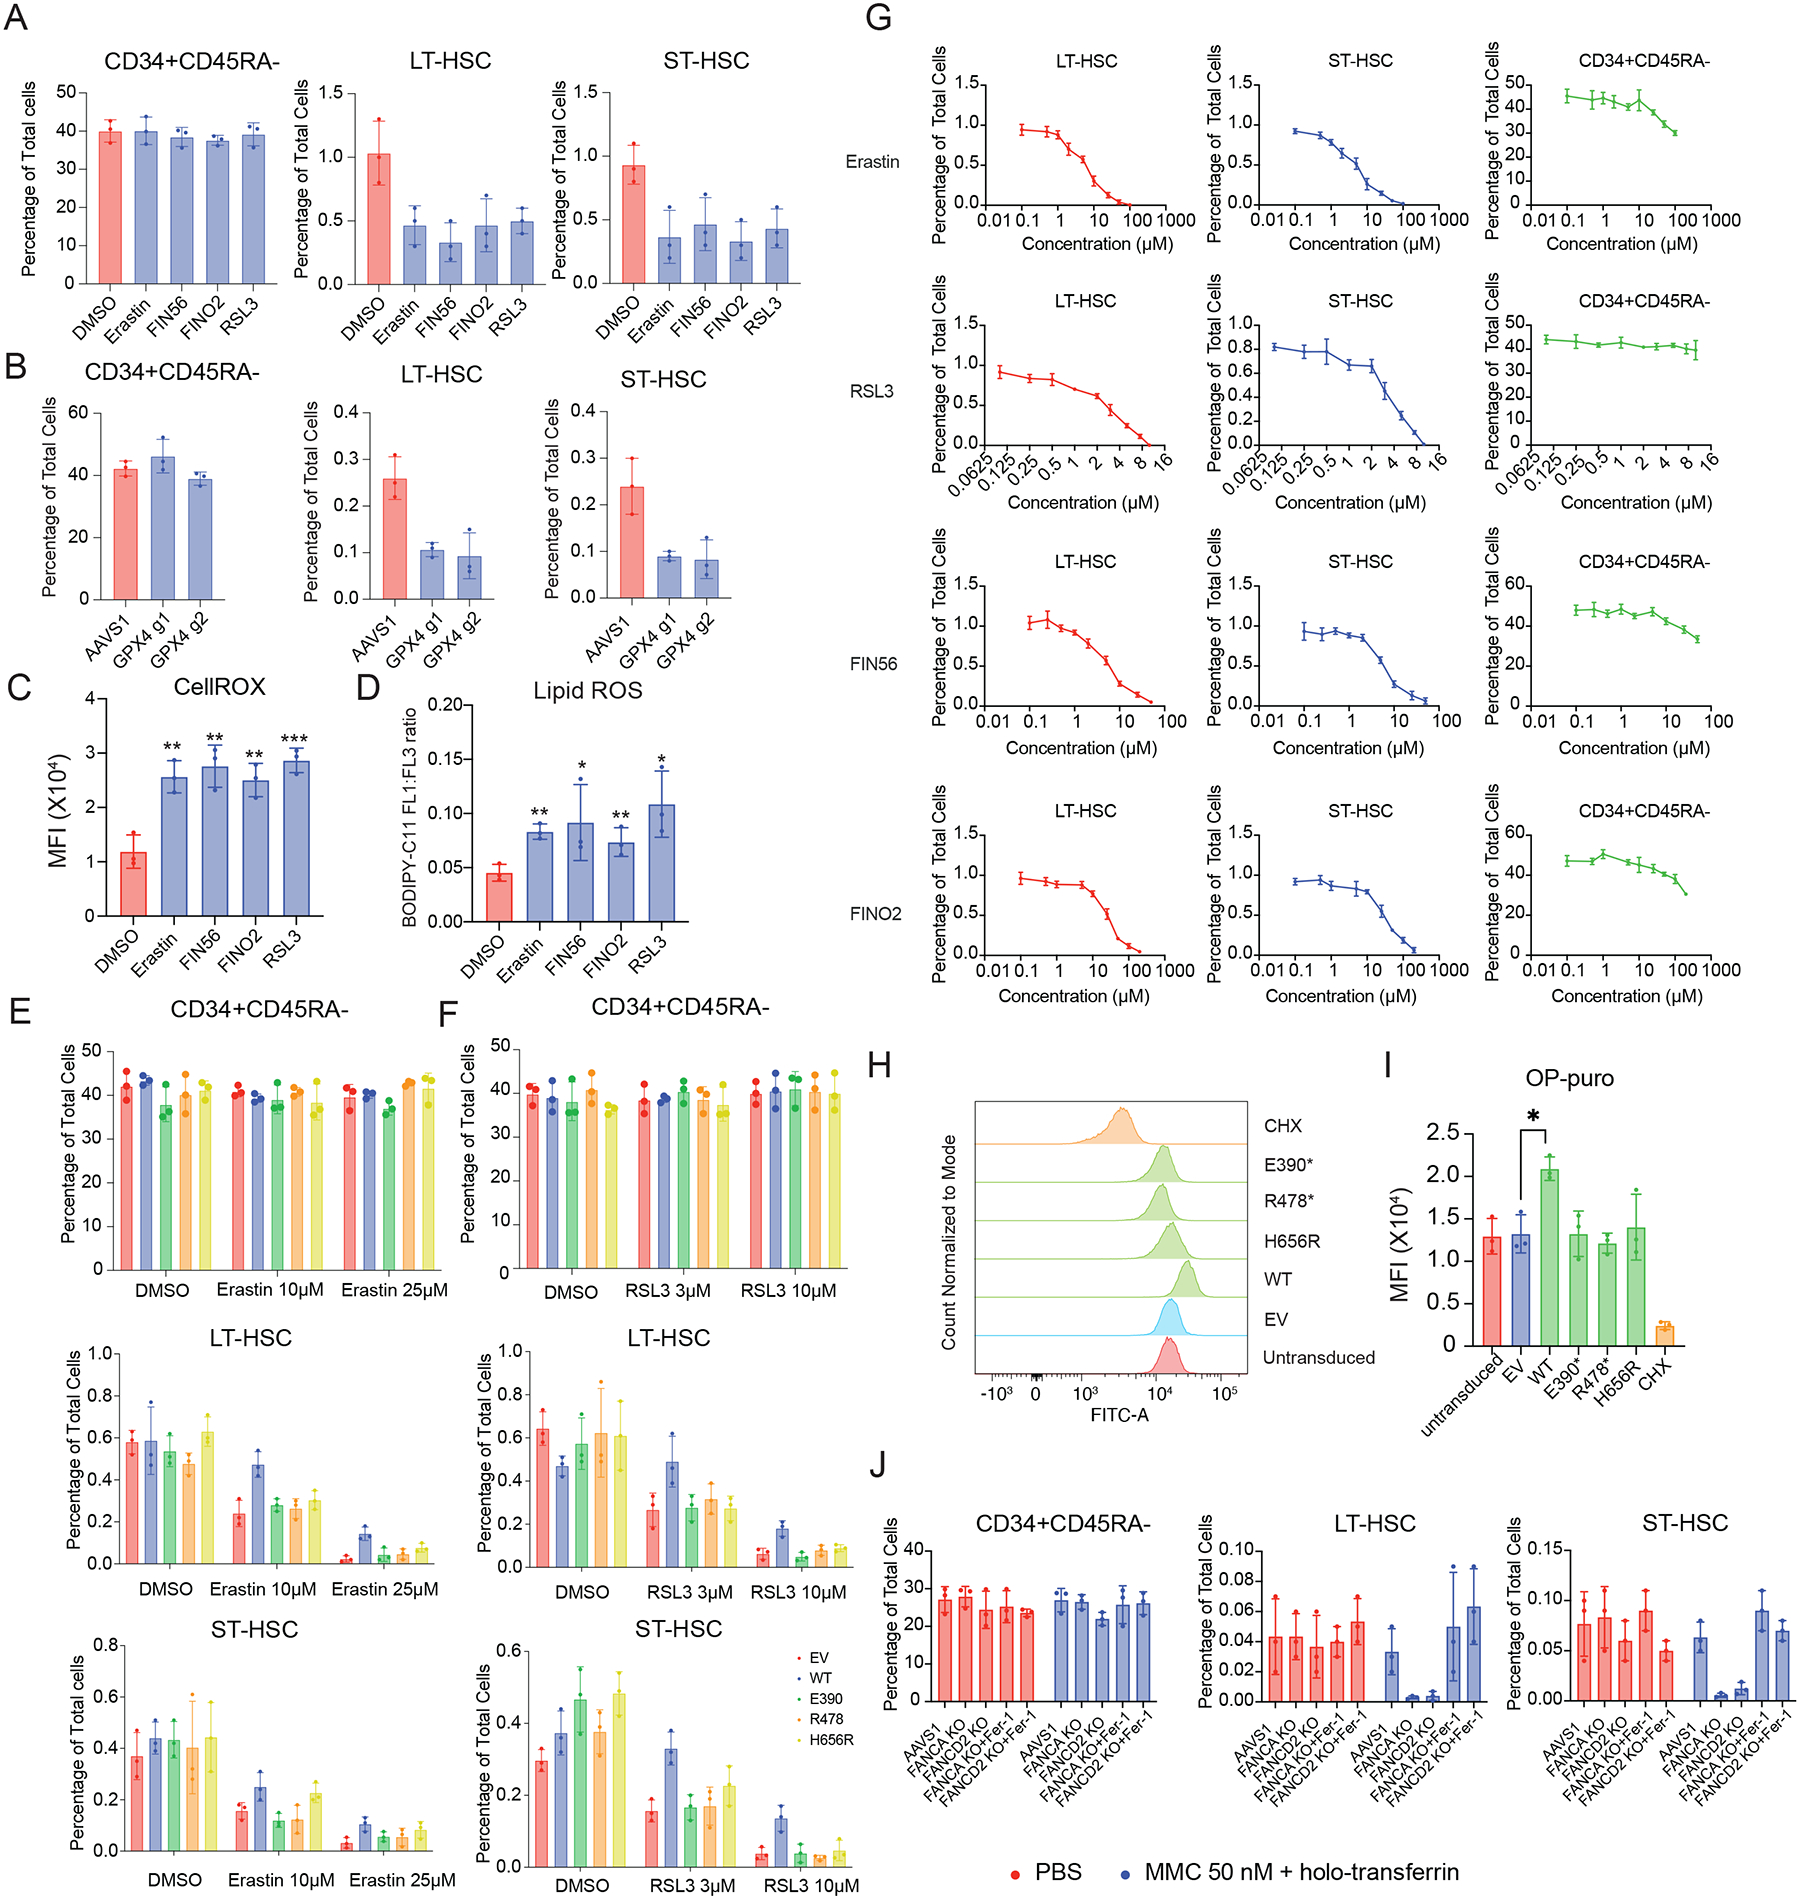
Hematopoietic stem cells (HSCs) have a number of unique physiologic adaptations that enable lifelong maintenance of blood cell production, including a highly regulated rate of protein synthesis. Yet, the precise vulnerabilities that arise from such adaptations have not been fully characterized. Here, inspired by a bone marrow failure disorder due to the loss of the histone deubiquitinase MYSM1, characterized by selectively disadvantaged HSCs, we show how reduced protein synthesis in HSCs results in increased ferroptosis. HSC maintenance can be fully rescued by blocking ferroptosis, despite no alteration in protein synthesis rates. Importantly, this selective vulnerability to ferroptosis not only underlies HSC loss in MYSM1 deficiency but also characterizes a broader liability of human HSCs. Increasing protein synthesis rates via MYSM1 overexpression makes HSCs less susceptible to ferroptosis, more broadly illustrating the selective vulnerabilities that arise in somatic stem cell populations as a result of physiologic adaptations.

Keywords: ferroptosis; genetic disorder; hematopoiesis; hematopoietic stem cell; ribosome profiling; translation.


Conflict of interest statement

Declaration of interests V.G.S. serves as an advisor to and/or has equity in Branch Biosciences, Ensoma, Novartis, Forma, Sana Biotechnology, and Cellarity.

Figures

Figure 1
Figure 1. Loss of MYSM1 in CD34+ HSPCs recapitulates bone marrow failure phenotype observed in patients.
(A) Comprehensive schematic diagram of MYSM1 mutants identified in patients. Asterisks represent stop codons. (B) Quantification of LT- and ST-HSC populations in AAVS1 and MYSM1 edited CD34+ HSPCs. (C) Uniform manifold approximation and projection (UMAP) plots of 4,293 (AAVS1) and 3,871 (MYSM1 KO) CD34+CD45RACD90+ cells, highlighted according to average z-score normalized HSC gene signature. (D) Box plot of z-score normalized HSC signature expression of all cells of AAVS1 and MYSM1 KO groups. (E) Percentage of total human CD45+ cells after RBC depletion from indicated sites of NBSGW mice xenotransplanted with AAVS1 and MYSM1 edited cord blood CD34+ HSPCs. (F) Percentage of edits of cells before and after xenotransplantation from indicated sites of NBSGW mice xenotransplanted with AAVS1 and MYSM1 edited cord blood CD34+ HSPCs. (G) Cell numbers per 30,000 RBC depleted bone marrow cells of progenitor cells (CD34+), T cells (CD3+), myeloid (CD33+, CD11b+), B cells (CD19+) and granulocytes (CD66b+).
Figure 2
Figure 2. Loss of MYSM1 results in reduced cellular translation.
(A) Top enriched signatures in upregulated and downregulated genes in MYSM1 KO cells with average z-score normalized HSC gene signature > 0.2, highlighting pathways directly related to translation regulation. (B) Volcano plot of MYSM1 KO vs. AAVS1 gene expression in HSCs, highlighting genes that are involved in ribosomal biogenesis and translational initiation. (C) Representative violin plots of ribosomal protein gene expression in AAVS1 and MYSM1 KO HSCs. (D) Gene set enrichment analysis (GSEA) showing translation initiation is significantly downregulated in MYSM1 KO cells. (E) Western blot analysis of representative ribosomal protein levels of CD34+CD45RACD90+ sorted cells with AAVS1 or MYSM1 editing. (F) Representative flow cytometric histogram of O-Propargyl-puromycin based translation rate analysis on CD34+CD45RACD90+ sorted cells with AAVS1 or MYSM1 editing. (G) Quantification of mean fluorescence intensity (MFI) of O-Propargyl-puromycin based translation rate analysis on CD34+CD45RACD90+ sorted cells with AAVS1 or MYSM1 editing. (H) Representative flow cytometric histogram of O-Propargyl-puromycin based translation rate analysis on CD34+CD45RACD90+ sorted cells with AAVS1 or MYSM1 editing, and MYSM1 edited cells transduced with indicated overexpression constructs. (I) Quantification of mean fluorescence intensity (MFI) of O-Propargyl-puromycin based translation rate analysis on CD34+CD45RACD90+ sorted cells with AAVS1 or MYSM1 editing, and MYSM1 edited cells transduced with indicated overexpression constructs. (J) Real time PCR analysis of representative ribosomal protein expression of AAVS1 or MYSM1 edited cells, and MYSM1 edited cells transduced with indicated overexpression constructs.
Figure 3
Figure 3. Loss of MYSM1 disrupts iron handling and results in increased ferroptosis in HSCs.
(A) Top enriched signatures in upregulated and downregulated genes in MYSM1 KO cells with average z-score normalized HSC gene signature > 0.2, highlighting pathways relevant to iron metabolism and ferroptosis. (B) Volcano plot of MYSM1 KO vs. AAVS1 gene expression in HSCs, highlighting genes that are involved in iron transport, storage and metabolism. (C) Representative violin plots of iron transport, storage and metabolism gene expression in AAVS1 and MYSM1 KO HSCs. (D) Representative flow cytometric histogram of cellular ROS level of sorted CD34+CD45RACD90+ cells measured by CellROX dye. (E) Quantification of mean fluorescence intensity (MFI) of cellular ROS level of sorted CD34+CD45RACD90+ cells measured by CellROX dye. (F) Representative flow cytometric histogram of oxidized BODIPY dye of sorted CD34+CD45RACD90+ cells. (G) Quantification of cellular lipid peroxidation level of sorted CD34+CD45RACD90+ cells measured by ratio of oxidized and non-oxidized BODIPY dye. (H) Quantification of total intracellular iron level of AAVS1 and MYSM1 edited cells. (I) Representative flow cytometric histogram of ferrous iron level of sorted CD34+CD45RACD90+ cells as measured by Fe2+ biotracker dye. (J) Quantification of mean fluorescence intensity (MFI) of labile ferrous iron (Fe2+) level of sorted CD34+CD45RACD90+ cells as measured by Fe2+ biotracker dye. (K) Quantification of total intracellular labile hemin level of AAVS1 and MYSM1 edited cells. (L) Time lapsed reduction of NADPH availability in GPX4 assay reaction measure by OD340. (M) Calculated intracellular GPX4 activity of sorted CD34+CD45RACD90+ cells of AAVS1 and MYSM1 edited cells.
Figure 4
Figure 4. MYSM1-deficient HSCs harbor signature ferroptosis features.
(A) Representative electron microscopic images of sorted CD34+CD45RA−CD90+ cells nucleofected with AAVS1 and MYSM1 gRNA. MOLM13 cell line treated with 5μM FIN56 for 10 hours was used as positive control for ferroptosis, and MOLM13 cell line treated with 1μM staurosporine for 5 hours was used as control for apoptosis. Top row scale bar = 2nm. Bottom row scale bar = 500nm. White arrows: shrunken mitochondria; Red arrows: chromatin condensation. (B) Quantification of mitochondria area of 10 mitochondria per cell for a total of 25 cells each sample (total of 250 mitochondria). Individual points out of 5 to 95 percentile were plotted and shown. (C) Quantification of mitochondria cristae area of 10 mitochondria per cell for a total of 25 cells each sample (total of 250 mitochondria). Individual crista areas were summed up for the total cristae surface area of each mitochondrion. Individual points out of 5 to 95 percentile were plotted and shown. (D) Quantification of mitochondria cristae volume, defined as the ratio of total cristae surface area of each mitochondrion to mitochondrial area, of 10 mitochondria per cell for a total of 25 cells each sample (total of 250 mitochondria). Individual points out of 5 to 95 percentile were plotted and shown. (E) Quantification of the cristae number of 10 mitochondria per cell for a total of 25 cells each sample (total of 250 mitochondria). (F) Volcano plots of differentially expressed lipids of sorted CD90+CD133+ MYSM1 KO cells compared to AAVS1 control. (G) Volcano plots of differentially expressed lipids of sorted CD90 MYSM1 KO cells compared to AAVS1 control. (H) Volcano plots of differentially expressed lipids of sorted CD90+CD133+ MYSM1 KO cells compared to CD90 MYSM1 KO cells. (I) Representative bar plots of lipids depleted in CD90+CD133+ MYSM1 KO cells. (J) Heatmap of lipids depleted in CD90+CD133+ MYSM1 KO cells. (K) Lipid species enrichment of CD90+CD133+ MYSM1 KO cells compared to AAVS1 controls by over-representation analysis. TG: triacylglycerol; SM: sphingomyelin; PS: phosphatidylserine; PI: phosphotidylinositol; PE P-: 1-O-alkenyl-glycerophosphoethanolamine; PE: diacyl glycerophosphoethanolamine; PC P-: 1-O-alkenyl-glycerophosphocholine; PC: diacyl glycerophosphocholine; LPE: lyso-diacyl glycerophosphoethanolamine; LPC P-: lyso-1-O-alkenyl-glycerophosphocholine; DG: diacylglycerol; Cer: ceramide; CE: cholesterol ester.
Figure 5
Figure 5. Inhibition of ferroptosis rescues HSC depletion due to MYSM1 loss.
(A) Quantification of CD34+CD45RA, ST-HSC, and LT-HSC populations in AAVS1 or MYSM1 edited cells, and MYSM1 edited cells treated with indicated chemicals. (B) Quantification of mean fluorescence intensity (MFI) of cellular ROS level of sorted CD34+CD45RACD90+ cells with AAVS1 or MYSM1 editing, and MYSM1 edited cells with indicated chemical treatments measured by CellROX dye. (C) Quantification of cellular lipid peroxidation level of sorted CD34+CD45RACD90+ cells with AAVS1 or MYSM1 editing, and MYSM1 edited cells with indicated chemical treatments measured by ratio of oxidized and non-oxidized BODIPY dye. (D) Quantification of mean fluorescence intensity (MFI) of O-Propargyl-puromycin based translation rate analysis on CD34+CD45RACD90+ sorted cells with AAVS1 or MYSM1 editing, and MYSM1 edited cells with indicated chemical treatments. (E) Schematic of in vivo rescue xenotransplantation experiment. (F) Percentage of total human CD45+ cells after RBC depletion from peripheral blood of NBSGW mice xenotransplanted with AAVS1 and MYSM1 edited cord blood CD34+ HSPCs treated with either vehicle (3%DMSO) or 20mg/kg Liproxstatin-1. Peripheral blood was harvested through retro-orbital plexus and analyzed at 4, 8 and 12 weeks post-transplantation. (G) Percentage of edits of MYSM1 edited cells before and after xenotransplantation from peripheral blood of NBSGW mice xenotransplanted with AAVS1 and MYSM1 edited cord blood CD34+ HSPCs treated with vehicle (3%DMSO) or 20mg/kg Liproxstatin-1. (H) Percentage of total human CD45+ cells after RBC depletion from bone marrow (left) or spleen (right) of NBSGW mice xenotransplanted with AAVS1 and MYSM1 edited cord blood CD34+ HSPCs treated with either vehicle (3%DMSO) or 20mg/kg Liproxstatin-1. (I) Percentage of edits of MYSM1 edited cells before and after xenotransplantation from bone marrow (left) or spleen (right) of NBSGW mice xenotransplanted with AAVS1 and MYSM1 edited cord blood CD34+ HSPCs treated with vehicle (3%DMSO) or 20mg/kg Liproxstatin-1. (J) Cell numbers per 30,000 RBC depleted bone marrow cells of progenitor cells (CD34+), T cells (CD3+), myeloid (CD33+, CD11b+), B cells (CD19+) and granulocytes (CD66b+) of NBSGW mice xenotransplanted with AAVS1 and MYSM1 edited cord blood CD34+ HSPCs treated with either vehicle (3%DMSO) or 20mg/kg Liproxstatin-1.
Figure 6
Figure 6. Reduced cellular translation due to loss of MYSM1 preferentially decreases translation efficiency of iron transport, storage and metabolism genes, resulting in overall decrease of protein level.
(A) Real time PCR analysis of iron transport, storage and metabolism gene expression of sorted CD34+CD45RACD90+CD133+ cells. (B) Western blot analysis of key iron handling and ferroptosis genes in indicated fractions of culture CD34+ HSPCs edited by AAVS1 control or MYSM1. (C) Volcano plot of MYSM1 KO vs. AAVS1 differentially translated genes, highlighting genes directly relevant to cellular iron transport, storage and metabolism, and ferroptosis. (D) Top enriched signatures in differentially translated genes in MYSM1 KO cells. (E) Gene set enrichment analysis (GSEA) showing ferroptosis protective gene translation is significantly impaired in MYSM1 KO cells. (F) Representative translation efficiency change of ferroptosis genes in MYSM1 KO cells. (G) Motif discovery analysis identified genes with specific 5’ UTR motif pattern tend to be less or more efficiently translated due to MYSM1 loss. (H) Percentage of 5’UTRs of genes of different groups in downregulated or upregulated motifs discovered in (G). (I) Western blot analysis of the translation of motif modified mRNA of MYSM1 deficient CD34+CD45RACD90+ cells. FTH1, SLC40A1 and ALAS 5’UTRs were engineered by placing three repeats of first two motifs identified in up side shown in (G) and HSPB1 and RELB were engineered by placing three repeats of first two motifs identified in down side shown in (G).
Figure 7
Figure 7. Normal hematopoietic stem cells (HSCs) are susceptible to ferroptosis induction and overexpression of MYSM1 can be protective due to increased translation.
(A) Quantification of CD34+CD45RA, ST-HSC, and LT-HSC populations in DMSO and indicated ferroptosis inducer-treated CD34+ HSPCs. (B) Quantification of CD34+CD45RA, ST-HSC, and LT-HSC populations in AAVS1 or GPX4 edited cells. (C) Quantification of mean fluorescence intensity (MFI) of cellular ROS level of sorted CD34+CD45RACD90+ cells with DMSO or indicated ferroptosis inducer treatment measured by CellROX dye. (D) Quantification of cellular lipid peroxidation level of sorted CD34+CD45RACD90+ cells with DMSO or indicated ferroptosis inducer treatment measured by ratio of oxidized and non-oxidized BODIPY dye. (E) Quantification of CD34+CD45RA, ST-HSC, and LT-HSC populations in DMSO and Erastin treated cells, and cells treated with Erastin and transduced with indicated constructs. (F) Quantification of CD34+CD45RA, ST-HSC, and LT-HSC populations in DMSO and RSL3 treated cells, and cells treated with RSL3 and transduced with indicated constructs. (G) Viability curve of CD34+CD45RA, ST-HSC, and LT-HSC populations, quantified by percentage of cells after five days culture with indicated concentration of ferroptosis inducing agent. (H) Representative flow cytometric histogram of O-Propargyl-puromycin based translation rate analysis on CD34+CD45RACD90+ sorted cells transduced with indicated constructs. (I) Quantification of mean fluorescence intensity (MFI) of O-Propargyl-puromycin based translation rate analysis on CD34+CD45RACD90+ sorted cells transduced with indicated constructs. (J) Quantification of LT- and ST-HSC populations in AAVS1, FANCA and FANCD2 edited CD34+ HSPCs induced with either PBS or low concentration of mitomycin c and holotransferrin treated with either DMSO or ferroptosis inhibitor Ferrostatin-1.

Comment in

  • The cost of competency?
    Kao YR, Will B. Kao YR, et al. Cell. 2023 Feb 16;186(4):685-687. doi: 10.1016/j.cell.2023.01.010. Cell. 2023. PMID: 36803600

References

    1. Laurenti E & Göttgens B From haematopoietic stem cells to complex differentiation landscapes. Nature 553, 418–426 (2018). - PMC - PubMed
    1. Liggett LA & Sankaran VG Unraveling Hematopoiesis through the Lens of Genomics. Cell 182, 1384–1400 (2020). - PMC - PubMed
    1. Baldridge MT, King KY, Boles NC, Weksberg DC & Goodell MA Quiescent haematopoietic stem cells are activated by IFN-gamma in response to chronic infection. Nature 465, 793–797 (2010). - PMC - PubMed
    1. Tothova Z et al. FoxOs are critical mediators of hematopoietic stem cell resistance to physiologic oxidative stress. Cell 128, 325–339 (2007). - PubMed
    1. Mortensen M et al. The autophagy protein Atg7 is essential for hematopoietic stem cell maintenance. J. Exp. Med 208, 455–467 (2011). - PMC - PubMed

Publication types