. 2023 Feb 16;186(4):764-785.e21.
doi: 10.1016/j.cell.2023.01.017.

The choroid plexus links innate immunity to CSF dysregulation in hydrocephalus

Affiliations

The choroid plexus links innate immunity to CSF dysregulation in hydrocephalus

Stephanie M Robert et al. Cell. .

Abstract

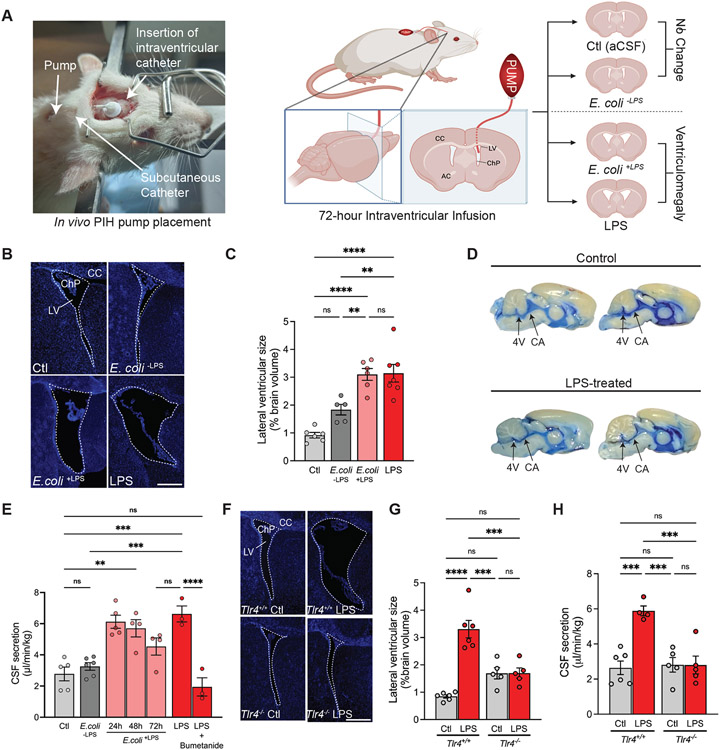
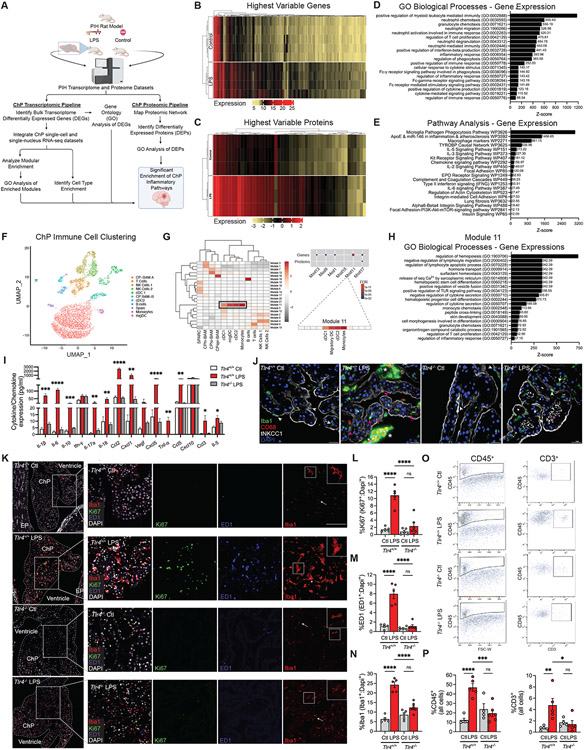
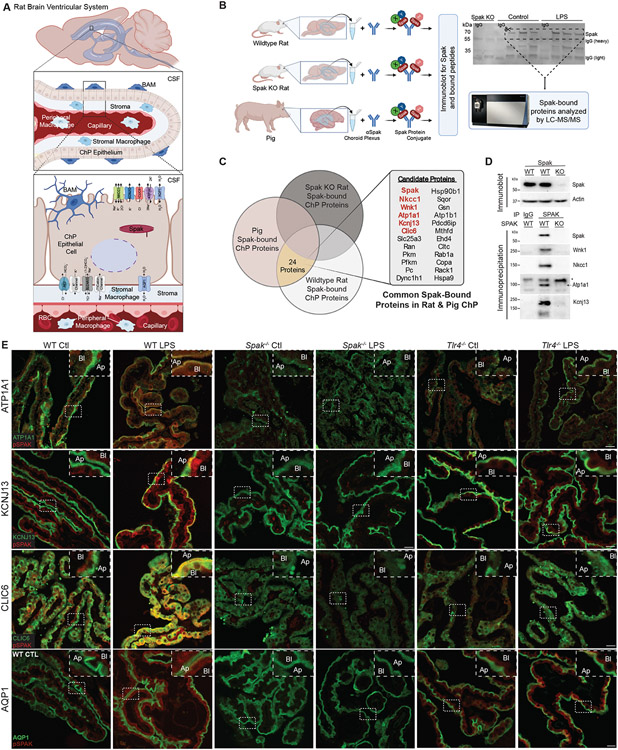
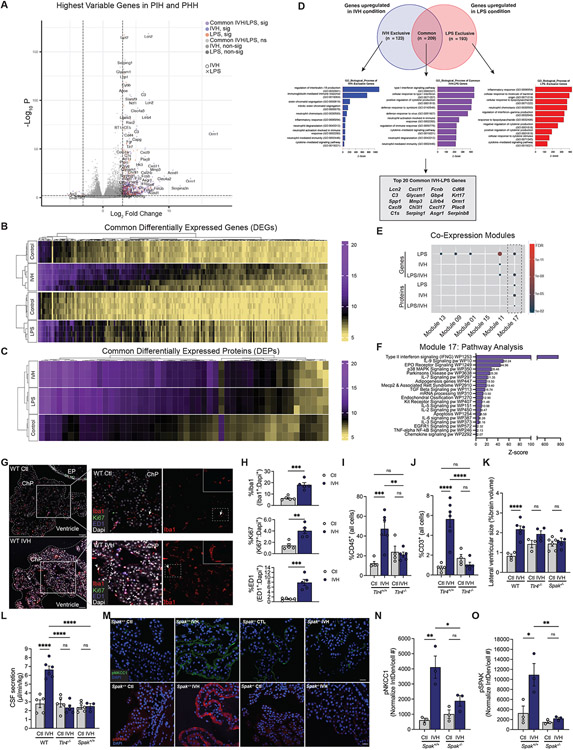
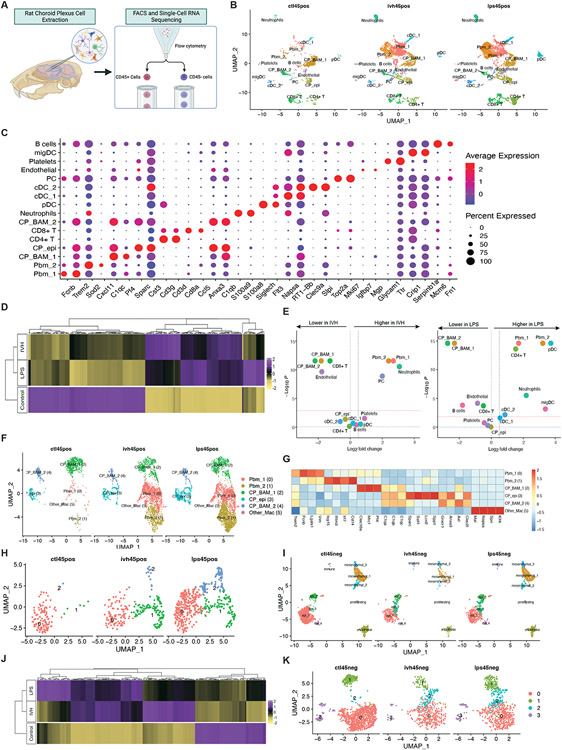
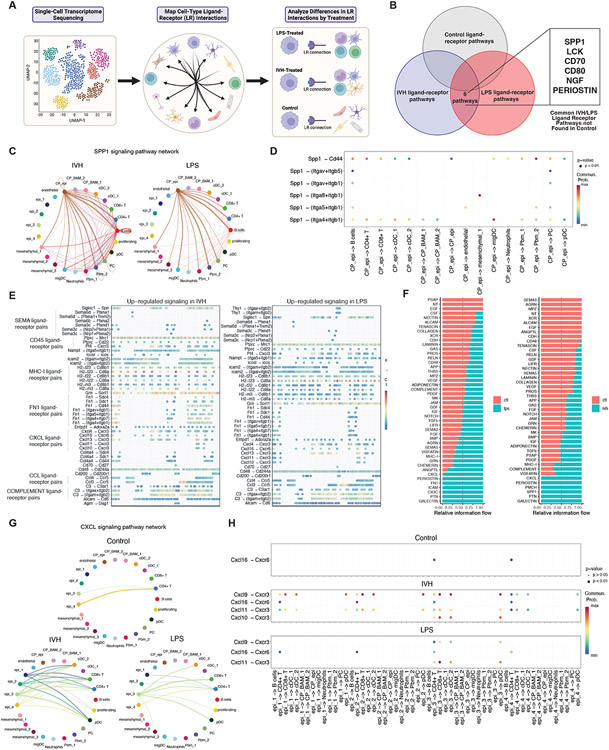
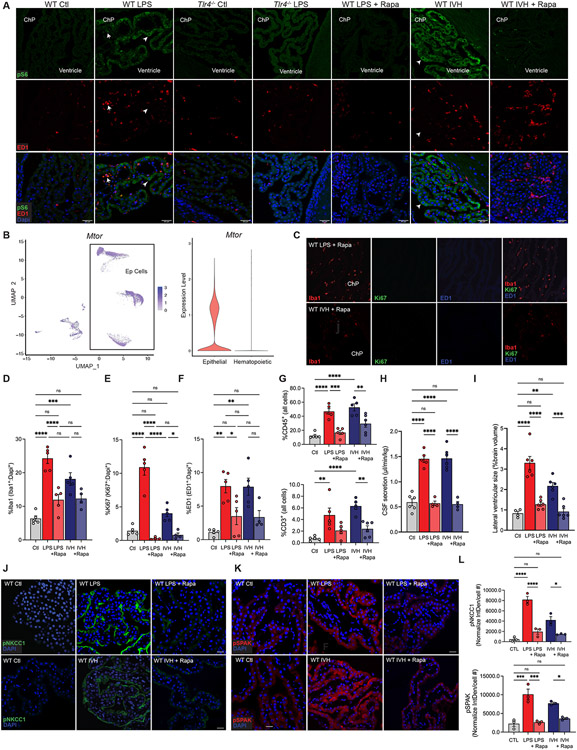
The choroid plexus (ChP) is the blood-cerebrospinal fluid (CSF) barrier and the primary source of CSF. Acquired hydrocephalus, caused by brain infection or hemorrhage, lacks drug treatments due to obscure pathobiology. Our integrated, multi-omic investigation of post-infectious hydrocephalus (PIH) and post-hemorrhagic hydrocephalus (PHH) models revealed that lipopolysaccharide and blood breakdown products trigger highly similar TLR4-dependent immune responses at the ChP-CSF interface. The resulting CSF "cytokine storm", elicited from peripherally derived and border-associated ChP macrophages, causes increased CSF production from ChP epithelial cells via phospho-activation of the TNF-receptor-associated kinase SPAK, which serves as a regulatory scaffold of a multi-ion transporter protein complex. Genetic or pharmacological immunomodulation prevents PIH and PHH by antagonizing SPAK-dependent CSF hypersecretion. These results reveal the ChP as a dynamic, cellularly heterogeneous tissue with highly regulated immune-secretory capacity, expand our understanding of ChP immune-epithelial cell cross talk, and reframe PIH and PHH as related neuroimmune disorders vulnerable to small molecule pharmacotherapy.

Keywords: CSF; NKCC1; SPAK; blood-CSF barrier; cerebrospinal fluid; choroid plexus; hydrocephalus; neuro-inflammation.


Conflict of interest statement

Declaration of interests The authors declare no competing interests.

Figures

Fig. 1.
Fig. 1.. Models of E. coli post-infectious hydrocephalus exhibit ChP-mediated CSF hypersecretion.
(A) Illustration of two models of post-infectious hydrocephalus (PIH). Insertion of an infusion pump in the lateral ventricle (LV) for E. coli+LPS, E. coli−LPS, LPS, or artificial CSF (aCSF, Ctl) administration over 72h. Left, illustration of the subcutaneous pump/catheter and intraventricular catheter placement. Right, schematic demonstrating pump/catheter placement and resulting ventricular changes. CC, corpus callosum, AC, anterior commissure. (B) Representative immunohistochemical images showing lateral ventricles 72h after infusion of control, E. coli+LPS, E. coli−LPS, or LPS (DAPI, blue). (C) Quantification of lateral ventricular size (% brain volume) after 72h infusion of aCSF, E. coli+LPS, E. coli−LPS, or LPS. Volume was calculated from sequential slices through the entire lateral ventricular system (n=5-7 animals per condition; see Methods). (D) Ventricular system infusion of Evans blue dye (injected into the LV of Ctl and LPS-treated animals), demonstrating flow through cerebral aqueduct (CA) and fourth ventricle (4V). (E) Body weight-normalized CSF secretion rates (μL/min/kg) in control (aCSF), E. coli+LPS (24h, 48h, or 72h), E. coli−LPS, LPS (72 h), or LPS + bumetanide (72 h)-treated animals (n=3-6 animals per condition). (F) Representative immunohistochemical images of LVs in Ctl vs LPS-treated Tlr4+/+ and Tlr4−/− rats (DAPI, blue). (G) Quantitation of LV size (% brain volume) in Ctl and LPS-treated Tlr4+/+ and Tlr4−/− rats (n=5-6 animals per condition). (H) Body weight-normalized CSF secretion rates (μL/min/kg) of Tlr4+/+ Ctl, Tlr4+/+ LPS-treated, Tlr4−/− Ctl, and Tlr4−/− LPS-treated rats (n=4-6 animals per condition). 2.5x mag, scale bars 0.25m. Error bars, mean ± sem; each symbol represents one animal. *p<0.05, **p<0.01, ***p<0.001, ****p<0.0001, ns = not significant, by one-way ANOVA.
Figure 2.
Figure 2.. Post-infectious hydrocephalus is associated with robust ChP-CSF interface inflammation.
(A) Schematic of integrated multi-omic analysis. (B-C) Heatmaps of the most highly differentially expressed ChP genes (B) and proteins (C) from LPS-treated and control rats (n=3-5 animals per condition). (D) Gene Ontology (GO) and (E) pathway analysis of differentially expressed genes (DEGs). (F) UMAP clustering of ChP immune cells and (G, left) gene expression module heatmap for individual cell types using a scRNAseq brain macrophage atlas. (G, upper right) Hypergeometric enrichment analysis of LPS-induced DEGs/DEPs in gene co-expression modules (G, lower right); Module 11 gene enrichment demonstrating dendritic cell (DC) and monocyte expression. (H) Module 11 GO biological process analysis (see also Methods, Table S1*). (I) CSF cytokine/chemokine expression (pg/mL) in Ctl and LPS-treated Tlr4+/+ and Tlr4−/− rats (n=3 animals per condition). (J) Representative IHC of Ctl and LPS-treated Tlr4+/+ and Tlr4−/− rat ChP. Iba1+ (green)/CD68+ (red) cells located apically (epiplexus macrophages, white arrowheads) and within stroma/capillaries (white arrows); activated macrophages (pink arrowheads). Apical membrane tNkcc1 (white); nuclei (DAPI, blue); scale bars, 25μm. (K) Representative merged (left) and magnified merged and single-channel IHC (right) of Ki-67 (green), ED1 (blue), Iba1 (red), and DAPI (white) in Ctl and LPS-treated Tlr4+/+ and Tlr4−/− rat ChP; senescent (arrows) and activated (arrowheads) Iba1+ cells. Scale bars, 50μm; insets at right, 2x enlarged. (L-N) Quantitation of (K) showing DAPI-normalized % Iba1+ (L), ED1+ (M), and Ki67+ cells (N) (n=5-6 animals per condition). (O) Scatterplots and (P) quantitation of FACS-isolated CD45+ (left) and CD3+ ChP cells (right) (n=4-6 animals per condition). Error bars, mean ± sem; each symbol represents one animal. *p<0.05, **p<0.01, ***p<0.001, ****p<0.0001, ns = not significant, by one-way ANOVA.
Figure 3.
Figure 3.. SPAK kinase is a regulatory scaffold for an apically-localized multi-ion transporter complex in ChP epithelial cells.
(A) Schematic illustrating the rat ventricular system and ChP, highlighting important ion transporters and channels in the apical and basolateral membranes of the ChP epithelium. BAM, border-associated macrophage; CSF, cerebrospinal fluid; RBC, red blood cell. (B, left) Illustration of SPAK immunoprecipitation and LC-MS/MS analysis of SPAK-interacting proteins detected in the micro-dissected ChP of Spak+/+ and Spak−/− rats, and wildtype pig (see Methods). (B, right) Western blot of SPAK, illustrating removal of gel lanes (area of the dashed box) corresponding to SPAK/SPAK-associated proteins for analysis with LC-MS/MS. (C) Identification of 24 highly SPAK-bound polypeptides, shared between Spak+/+ rats and wild-type pig ChP, and absent from immunoprecipitates from lysates of Spak−/− rat ChP. (D) Immunoblot of SPAK (upper blot; beta-actin, loading control) and (lower blots) co-immunoprecipitations of SPAK with LC-MS/MS-identified SPAK-bound proteins WNK1, NKCC1, ATP1A1 (*non-specific band), and KCNJ13 (SDS-resistant tetramer shown) in Spak+/+ and Spak−/− rat ChP. (E) Representative IHC co-staining of pSPAK (red) with ATP1A1 (green, top row), KCNJ13 (green, second row), CLIC6 (green, third row), and AQP1 (green, last row) in ChP of WT, Spak−/−, and Tlr4−/− animals +/− LPS treatment (n=6 ChP per genotype, 3 animals per condition). Insets show magnification; apical membrane (Ap), basolateral membrane (Bl) of the choroid plexus. 40x, Scale bars 25 μm.
Figure 4.
Figure 4.. Post-hemorrhagic and -infectious hydrocephalus models exhibit highly similar ChP immune-secretory pathophysiology.
(A) Volcano plot and heatmaps of the most highly significant (sig) (B) DEGs and (C) DEPs compared to control from bulk RNAseq analyses of ChP from Ctl, IVH, and LPS-treated animals (n=3-5 animals per condition). (D) Venn diagram and GO biological process analysis of genes upregulated in IVH versus LPS conditions, and those common to both conditions. Outlined box at the bottom shows the top 20 DEGs common to IVH and LPS. (E) Hypergeometric enrichment analysis of gene co-expression modules for DEG/DEPs between LPS and IVH, and shared (LPS/IVH) DEG/DEPs (dashed box highlights shared enrichment in Module 17). (F) Module 17 pathway analysis. (G) Representative IHC of Iba1 (red), Ki67 (green), and ED1 (blue) cells in ChP of Ctl and IVH-treated rats (n=5 animals per condition) (ChP border denoted by dashed white outline; EP, ependyma). Left panel inset, ChP magnification; right panel inset, magnification Iba1+ cell (white arrows). Scale bars, 50μm. (H) Quantitative IHC in (G) showing % (normalized to DAPI) of ED1+, Ki67+, and Iba1+ cells (n=5 animals per condition). (I, J) FACS quantification of (I) CD45+ and (J) CD3+ cells in ChP from IVH-treated Tlr4+/+ and Tlr4−/− rats (n=4-6 animals per condition). (K) Quantitation of lateral ventricular size (% brain volume) and (L) body weight-normalized CSF secretion in WT, Tlr4−/−, and Spak−/− IVH-treated (48h) rats (n=3-6 animals per condition). (M) Representative ChP IHC of pNKCC1 (green) and pSPAK (red) expression in Ctl and IVH-treated Spak+/+ and Spak−/− animals. Scale bars, 25 μm. Quantitation of (N) pNKCC1 (Interval Density/cell #) and (R) pSPAK IHC in (O) (n=6 ChP, 3 animals per condition). Error bars, mean ±sem; each symbol represents one animal. *p<0.05, **p<0.01, ***p<0.001, ****p<0.0001, ns = not significant; unpaired t-test (K) or one-way ANOVA (L-O, Q, R). [D-G, abbreviations: pos reg = positive regulation, neg reg = negative regulation, pw = pathway, act = activity, a/o = acting on, FA = focal adhesion, Mϕ = macrophage].
Figure 5.
Figure 5.. scRNAseq uncovers crosstalk between peripheral and resident immune cells and epithelial cells at the ChP.
(A) Schematic illustrating the scRNA experimental design and downstream analyses. (B) UMAP clustering of ChP CD45+ cells across control, IVH-treated and LPS-treated conditions, colored by cell type. (C) DotPlot showing gene expression signatures of CD45+ cell clusters, with dot size representing the percentage of cells expressing the gene and the color representing average expression within a cluster. (D) Heatmap of the top differentially expressed genes (DEGs) comparing ChP CD45+ cell expression profiles from Ctl, IVH, and LPS-treated animals. (E) Volcano plots depicting differences of cluster abundance in IVH-treated and LPS-treated ChP CD45+ cells compared to control plotting fold change (log10) against p-value (−log10) based on beta-binomial regression. The red horizontal dashed line indicates the significance threshold. (F) UMAP of ChP myeloid cell clusters, including peripheral blood macrophages, CP stromal macrophages and CP epiplexus macrophages, colored by cell type. (G) Heatmap of the top DEGs for myeloid subclusters. (H) UMAP of ChP epiplexus macrophage subclusters, colored by group, showing transformed and proliferating epiplexus macrophages in control, IVH, and LPS conditions. (I) UMAP clustering of ChP CD45 cells across IVH-treated, LPS-treated, and control conditions, colored by cell type. (J) Heatmap of top DEGs comparing ChP CD45 epithelial cell expression profiles from Ctl, IVH, and LPS-treated animals. (K) UMAP of ChP epithelial subclusters, colored by group.
Figure 6.
Figure 6.. scRNAseq CellChat analysis reveals ligand-receptor pairs enabling ChP immune-epithelial cell communication.
(A) Schematic illustrating CellChat downstream analyses. (B) Identification of 6 ligand-receptor pathways shared between IVH-treated and LPS-treated rats and absent in control. (C) Circle plot depicting ligand-receptor interactions of the SPP1 pathway in IVH-treated and LPS-treated ChP. Edge width represents communication probability. (D) Bubble plot showing significant ligand-receptor interactions for the SPP1 pathway in IVH-treated and LPS-treated ChP (no significant interactions were found for control). X-axis shows the cell groups associated with the interactions. Y-axis shows the ligand-receptor pairs. Dot color reflects communication probabilities and dot size represents computed p-values. Empty space means zero communication probability. p-values reflect a one-sided permutation test. (E) Upregulated ligand-receptor pairs for IVH-treated and LPS-treated ChP compared to control, showing significant overlap of upregulated pathways in IVH and LPS, with increased signal in SEMA, CD45, MHC-I, FN1, CXCL, CCL, COMPLEMENT pathway ligand-receptor pairs for both conditions. Dot color reflects communication probabilities and dot size represents computed p-values (from a one-sided permutation test). (F) Significant signaling pathways ranked based on differences in the overall information flow within the inferred networks between epithelial and CD45+ cells, comparing LPS (left) and IVH conditions (right) to control. The overall information flow of a signaling network is calculated by summarizing all communication probabilities in that network. Rows with high blue-to-red ratio indicate higher ligand-receptor pathway activity for IVH or LPS conditions. (G) Circle plot comparing CXCL pathway ligand-receptor interactions among control, IVH-treated, and LPS-treated ChP epithelial and CD45+ cell groups. Edge width represents communication probability. (H) Comparison of control, IVH, and LPS bubble plots showing significant ligand-receptor interactions between epithelial and CD45+ cells for the CXCL pathway. X-axis shows the cell groups associated with the interactions. Y axis shows the ligand-receptor pairs. Dot color reflects communication probabilities, and dot size represents computed p-values (from a one-sided permutation test). Empty space means zero communication probability.
Figure 7.
Figure 7.. Repurposed systemic immunomodulators treat hydrocephalus by antagonizing ChP-mediated CSF hypersecretion.
(A) Representative IHC of pS6 (green) and ED1 (red) in ChP-associated immune cells (arrows) and epithelial cells (arrowheads) in WT and Tlr4−/− animals +/− LPS, and WT LPS and IVH conditions +/− Rapamycin (Rapa) (n=5). Scale bars, 30μm. DAPI, blue. (B) snRNAseq analysis (left panel) and violin plot (right) demonstrating Mtor in ChP epithelial (Ep) cells and ChP-associated hematopoietic cells (Epithelial, Avg Log2FC=7.88e-2, p=1.23e-17). (C) Representative IHC of Iba1 (red), Ki67 (red), and ED1 (blue) expression in the ChP of WT rats treated with LPS or IVH, in the presence of Rapa. (D-F) Quantitative IHC of the ChP immune response in (C) in WT LPS and IVH-treated animals +/−Rapa. Graphs represent DAPI-normalized % of cells identified as (D) Iba1+, (E) Ki67+, (F) ED1+ in Ctl, LPS, LPS+Rapa, IVH, and IVH+Rapa-treated animals (n=4-6). (G) Quantitation of FACS-isolated CD45+ and CD3+ cells in Ctl, LPS, LPS+Rapa, IVH, IVH+Rapa-treated rats (n=5-6). (H) Weight-normalized CSF secretion and (I) lateral ventricular size (% brain volume) in Ctl, LPS, LPS+Rapa, IVH, and IVH+Rapa-treated animals (n=4-6). Representative IHC of (J) pNKCC1 and (K) pSPAK expression in WT Ctl, LPS +/−Rapa, and IVH +/−Rapa. (L) Quantitation (Interval Density/cell #) of pNkcc1 and pSPAK IHC in (J) and (K), respectively (n=6 ChP, 3 animals). Error bars, mean ± sem; each symbol represents one animal. *p<0.05, **p<0.01, ***p<0.001, ****p<0.0001, ns = not significant; one-way ANOVA.

Similar articles

Cited by

References

    1. Cui J, Xu H, and Lehtinen MK (2021). Macrophages on the margin: choroid plexus immune responses. Trends Neurosci 44, 864–875. 10.1016/j.tins.2021.07.002. - DOI - PMC - PubMed
    1. Dani N, Herbst RH, McCabe C, Green GS, Kaiser K, Head JP, Cui J, Shipley FB, Jang A, Dionne D, et al. (2021). A cellular and spatial map of the choroid plexus across brain ventricles and ages. Cell 184, 3056–3074 e3021. 10.1016/j.cell.2021.04.003. - DOI - PMC - PubMed
    1. Damkier HH, Brown PD, and Praetorius J (2013). Cerebrospinal fluid secretion by the choroid plexus. Physiol Rev 93, 1847–1892. 10.1152/physrev.00004.2013. - DOI - PubMed
    1. Cui J, Shipley FB, Shannon ML, Alturkistani O, Dani N, Webb MD, Sugden AU, Andermann ML, and Lehtinen MK (2020). Inflammation of the Embryonic Choroid Plexus Barrier following Maternal Immune Activation. Dev Cell 55, 617–628 e616. 10.1016/j.devcel.2020.09.020. - DOI - PMC - PubMed
    1. Engelhardt B, Vajkoczy P, and Weller RO (2017). The movers and shapers in immune privilege of the CNS. Nat Immunol 18, 123–131. 10.1038/ni.3666. - DOI - PubMed

Publication types