. 2023 May 15;207(10):1358-1375.
doi: 10.1164/rccm.202203-0441OC.

Single-Cell Analysis Reveals Distinct Immune and Smooth Muscle Cell Populations that Contribute to Chronic Thromboembolic Pulmonary Hypertension

Affiliations

Single-Cell Analysis Reveals Distinct Immune and Smooth Muscle Cell Populations that Contribute to Chronic Thromboembolic Pulmonary Hypertension

Gayathri Viswanathan et al. Am J Respir Crit Care Med. .

Abstract

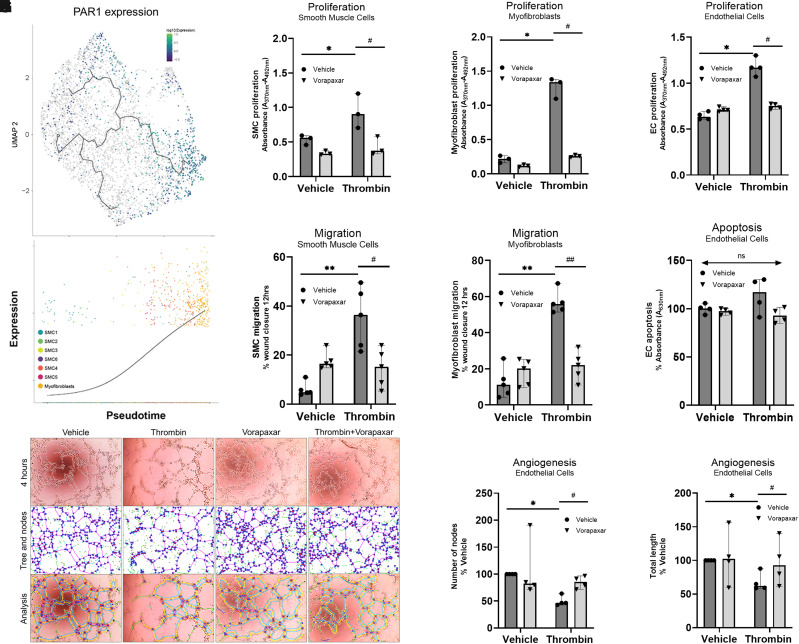
Rationale: Chronic thromboembolic pulmonary hypertension (CTEPH) is a sequela of acute pulmonary embolism (PE) in which the PE remodels into a chronic scar in the pulmonary arteries. This results in vascular obstruction, pulmonary microvasculopathy, and pulmonary hypertension. Objectives: Our current understanding of CTEPH pathobiology is primarily derived from cell-based studies limited by the use of specific cell markers or phenotypic modulation in cell culture. Therefore, our main objective was to identify the multiple cell types that constitute CTEPH thrombusy and to study their dysfunction. Methods: Here we used single-cell RNA sequencing of tissue removed at the time of pulmonary endarterectomy surgery from five patients to identify the multiple cell types. Using in vitro assays, we analyzed differences in phenotype between CTEPH thrombus and healthy pulmonary vascular cells. We studied potential therapeutic targets in cells isolated from CTEPH thrombus. Measurements and Main Results: Single-cell RNA sequencing identified multiple cell types, including macrophages, T cells, and smooth muscle cells (SMCs), that constitute CTEPH thrombus. Notably, multiple macrophage subclusters were identified but broadly split into two categories, with the larger group characterized by an upregulation of inflammatory signaling predicted to promote pulmonary vascular remodeling. CD4+ and CD8+ T cells were identified and likely contribute to chronic inflammation in CTEPH. SMCs were a heterogeneous population, with a cluster of myofibroblasts that express markers of fibrosis and are predicted to arise from other SMC clusters based on pseudotime analysis. Additionally, cultured endothelial, smooth muscle, and myofibroblast cells isolated from CTEPH fibrothrombotic material have distinct phenotypes from control cells with regard to angiogenic potential and rates of proliferation and apoptosis. Last, our analysis identified PAR1 (protease-activated receptor 1) as a potential therapeutic target that links thrombosis to chronic PE in CTEPH, with PAR1 inhibition decreasing SMC and myofibroblast proliferation and migration. Conclusions: These findings suggest a model for CTEPH similar to atherosclerosis, with chronic inflammation promoted by macrophages and T cells driving vascular remodeling through SMC modulation, and suggest new approaches for pharmacologically targeting this disease.

Keywords: CTEPH; macrophages; protease-activated receptor 1; single-cell RNA sequencing; smooth muscle cells.


Figures

Figure 1.
Figure 1.
A cell atlas of chronic thromboembolic pulmonary hypertension (CTEPH) thrombus. (A) Hemotoxylin and eosin and (B) Masson’s trichrome staining of segmental/subsegmental fibrothrombotic material from pulmonary endarterectomy demonstrate significant fibrosis, recanalization (arrows), and cellularity. Immunofluorescence staining with DAPI (blue) and (C) CD206 (red) for macrophages, (D) CD3 (red) for T cells, and (E) von Willebrand factor (red) and α-smooth muscle cell actin (purple) for endothelial cells (ECs) and smooth muscle cells (SMCs), respectively. (F) Uniform manifold approximation and projection plot depicts transcriptome of cells isolated from five samples of segmental/subsegmental CTEPH fibrothrombotic material. Each dot represents a single cell (n = 11,709). Coloring is according to distinct populations of SMCs, ECs, and immune cells identified by the unsupervised clustering performed with Seurat. (G) These different cell types were found across all five patients (A–E), but with distinct percentages of cell types identified in each sample (H). Some samples were SMC-predominant, whereas others were T cell– or SMC-predominant. (I) Top markers for each cell type. (J) Heat map of top 10 markers for each cell cluster. H&E = hemotoxylin and eosin; MT = Masson’s trichrome; NK = natural killer; SM = smooth muscle; UMAP = uniform manifold approximation and projection; vWF = von Willebrand factor.
Figure 2.
Figure 2.
Macrophage clusters in chronic thromboembolic pulmonary hypertension. (A) Uniform manifold approximation and projection plot of macrophages with their clustering into seven distinct groups. (B) Top markers for each subcluster. (C) Heat map of top 10 markers for each subcluster. (D) Hierarchical clustering of Ingenuity Pathway Analysis canonical pathway analysis for macrophage clusters identifies two larger populations of macrophages based on their signaling profiles, with clusters 1, 2, and 6 displaying a proinflammatory phenotype. UMAP = uniform manifold approximation and projection.
Figure 3.
Figure 3.
T-cell clusters in chronic thromboembolic pulmonary hypertension. (A) Uniform manifold approximation and projection plot of T cells with their clustering into four distinct groups of effector CD4+ T cells, two clusters of CD8+ T cells, and a small cluster of dividing T cells. (B) Top markers for each subcluster. (C) Heat map of top 10 markers for each subcluster. (D) Hierarchical clustering of Ingenuity Pathway Analysis canonical pathway analysis for T-cell clusters. UMAP = uniform manifold approximation and projection.
Figure 4.
Figure 4.
Smooth muscle cell clusters in chronic thromboembolic pulmonary hypertension. (A) Uniform manifold approximation and projection plot of mesenchymal cells with their clustering into eight distinct groups. (B) Top markers for each subcluster. (C) Heat map of top 10 markers for each subcluster. (D) Hierarchical clustering of Ingenuity Pathway Analysis canonical pathway analysis for smooth muscle cell (SMC) clusters demonstrates significant heterogeneity in signaling between SMC subclusters. UMAP = uniform manifold approximation and projection.
Figure 5.
Figure 5.
Pseudotime analysis of smooth muscle cell (SMC) transition to myofibroblasts. (A) Pseudotime trajectory from the ACTA2 high-expression SMC2 subcluster to myofibroblasts and the SMC1 subcluster. (B) Cells colored by pseudotime, demonstrating that myofibroblasts and the SMC3 subcluster, which expressed inflammatory genes, arise late in the pseudotime trajectory. (C) Four markers that exhibited some of the largest changes over the pseudotime trajectory, consistent with a loss of contractile protein expression (MYH11, TPM2, and MYL9) and a gain of myofibroblast markers (LUM). (D) Cells ordered by monocle pseudotime across the SMC2 to myofibroblast trajectory. (E) Specific gene modules that were enriched in each subcluster (for details on genes in each module, see Table E2). (F) Loss of expression of ACTA2 along the trajectory from SMC2 to myofibroblasts, along with an increased expression of myofibroblast markers LUM, POSTN, and COL3A1. UMAP = uniform manifold approximation and projection.
Figure 5.
Figure 5.
Pseudotime analysis of smooth muscle cell (SMC) transition to myofibroblasts. (A) Pseudotime trajectory from the ACTA2 high-expression SMC2 subcluster to myofibroblasts and the SMC1 subcluster. (B) Cells colored by pseudotime, demonstrating that myofibroblasts and the SMC3 subcluster, which expressed inflammatory genes, arise late in the pseudotime trajectory. (C) Four markers that exhibited some of the largest changes over the pseudotime trajectory, consistent with a loss of contractile protein expression (MYH11, TPM2, and MYL9) and a gain of myofibroblast markers (LUM). (D) Cells ordered by monocle pseudotime across the SMC2 to myofibroblast trajectory. (E) Specific gene modules that were enriched in each subcluster (for details on genes in each module, see Table E2). (F) Loss of expression of ACTA2 along the trajectory from SMC2 to myofibroblasts, along with an increased expression of myofibroblast markers LUM, POSTN, and COL3A1. UMAP = uniform manifold approximation and projection.
Figure 6.
Figure 6.
Chronic thromboembolic pulmonary hypertension (CTEPH) thrombus–derived cells have distinct phenotypes from control cells. (A) Immunofluorescence with markers for endothelial cells (ECs) (von Willebrand factor), smooth muscle cells (SMCs) (α-SMC actin), and mesenchymal cells (vimentin). Compared with control pulmonary artery (PA) ECs, CTEPH ECs exhibited (B) abnormal tube formation, along with (C) increased proliferation and (D) decreased apoptosis. Compared with PA SMCs, CTEPH SMCs displayed (C) decreased proliferation with (D) similar levels of apoptosis. Compared with PA adventitial fibroblasts, CTEPH myofibroblasts displayed (C) similar levels of proliferation with (D) increased levels of apoptosis. (E) In a pairwise comparison of proliferation between five CTEPH SMCs and myofibroblasts, myofibroblasts displayed significantly more proliferation than SMCs. Each bar represents median 95% confidence interval (n = 4 biological repeats of patients with CTEPH). *P < 0.05, **P < 0.01, and ***P < 0.001. SM = smooth muscle; vWF = von Willebrand factor.
Figure 7.
Figure 7.
PAR1 antagonism decreases chronic thromboembolic pulmonary hypertension (CTEPH) smooth muscle cell (SMC), endothelial cell (EC), and myofibroblast proliferation and migration and restores CTEPH EC tube formation. (A) PAR1 (F2R) expression is enriched in myofibroblasts compared with other SMC subclusters and (B) increases in expression across the pseudotime trajectory. Proliferation of CTEPH thrombus–derived SMCs (C), myofibroblasts (D), and ECs (E) was promoted by 1 μM thrombin (dark gray bars) and inhibited by treatment with 10 μM PAR1 antagonist vorapaxar (light gray bars). Migration of SMCs (F) and myofibroblasts (G) was promoted by 100 nM thrombin (black bars) and inhibited by 1 μM vorapaxar (gray bars) (see Figure E7 for representative images). Thrombin (1 μM) and vorapaxar (10 μM) did not promote apoptosis of ECs (H). (I–K) Tube formation (angiogenesis) of ECs was reduced by 1 μM thrombin (dark gray bars) and restored by treatment with 10 μM vorapaxar (light gray bars). Each bar represents median 95% confidence interval (n = 3 biological repeats for C and D; n = 4 for E and H–K; n = 5 for F and G). *P < 0.05 and **P < 0.01 versus vehicle; #P < 0.05 and ##P < 0.01 versus thrombin.

Comment in

References

    1. Kim NH, Delcroix M, Jais X, Madani MM, Matsubara H, Mayer E, et al. Chronic thromboembolic pulmonary hypertension. Eur Respir J . 2019;53 - PMC - PubMed
    1. Lang IM, Dorfmüller P, Vonk Noordegraaf A. The pathobiology of chronic thromboembolic pulmonary hypertension. Ann Am Thorac Soc . 2016;13:S215–S221. - PubMed
    1. Simonneau G, Torbicki A, Dorfmüller P, Kim N. The pathophysiology of chronic thromboembolic pulmonary hypertension. Eur Respir Rev . 2017;26 - PMC - PubMed
    1. Delcroix M, Torbicki A, Gopalan D, Sitbon O, Klok FA, Lang I, et al. ERS statement on chronic thromboembolic pulmonary hypertension. Eur Respir J . 2021;57:2002828. - PubMed
    1. Wagenvoort CA. Pathology of pulmonary thromboembolism. Chest . 1995;107:10S–17S. - PubMed

Publication types

Substances