. 2023 Feb 21:12:e84708.
doi: 10.7554/eLife.84708.

Orai3 and Orai1 mediate CRAC channel function and metabolic reprogramming in B cells

Affiliations

Orai3 and Orai1 mediate CRAC channel function and metabolic reprogramming in B cells

Scott M Emrich et al. Elife. .

Abstract

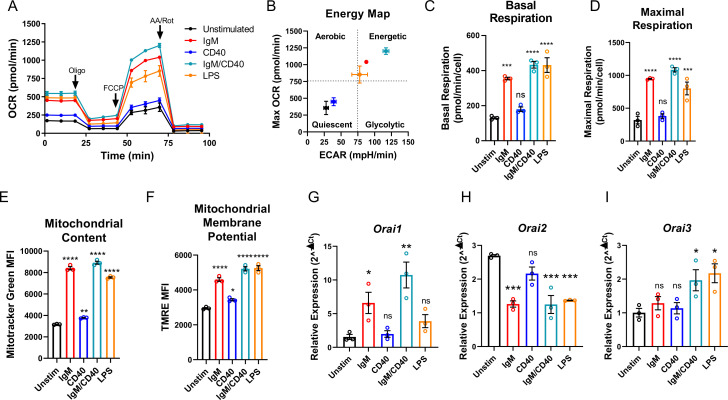
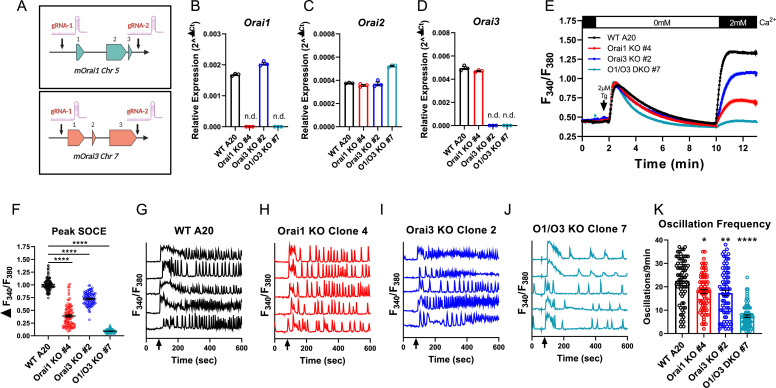
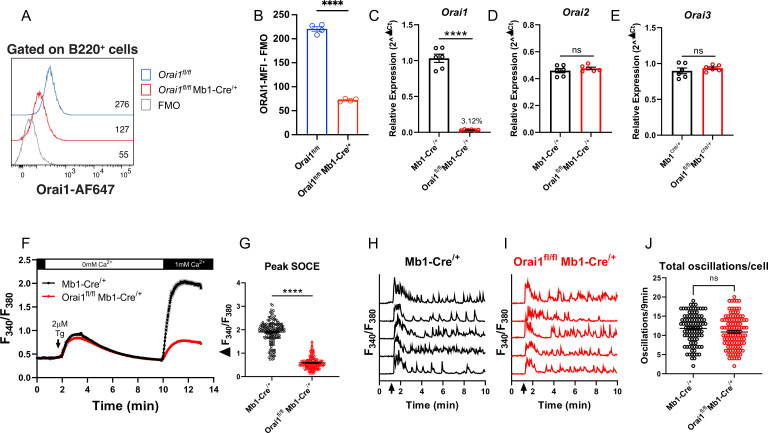
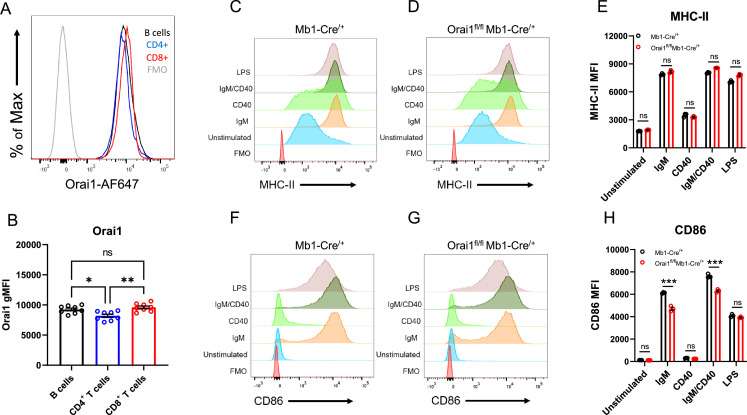
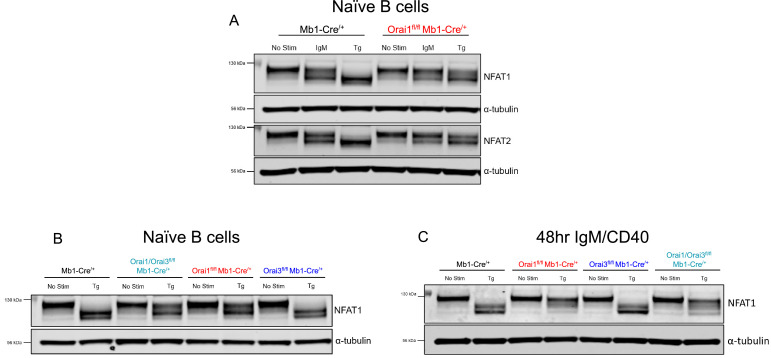
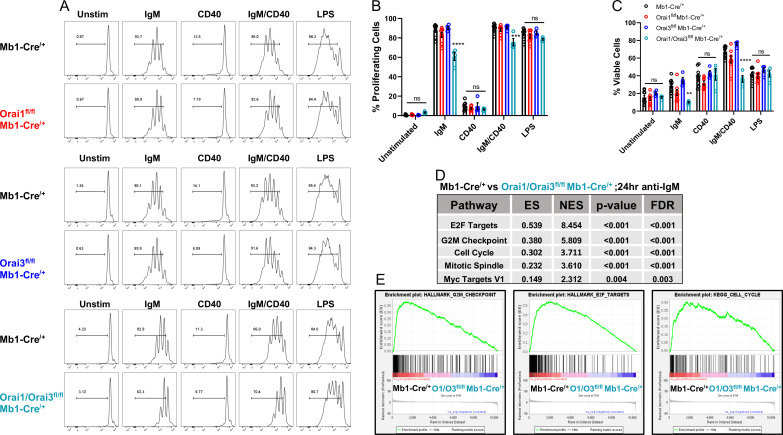
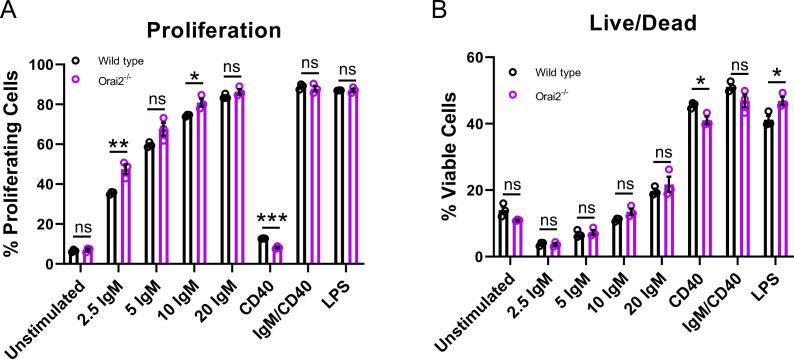
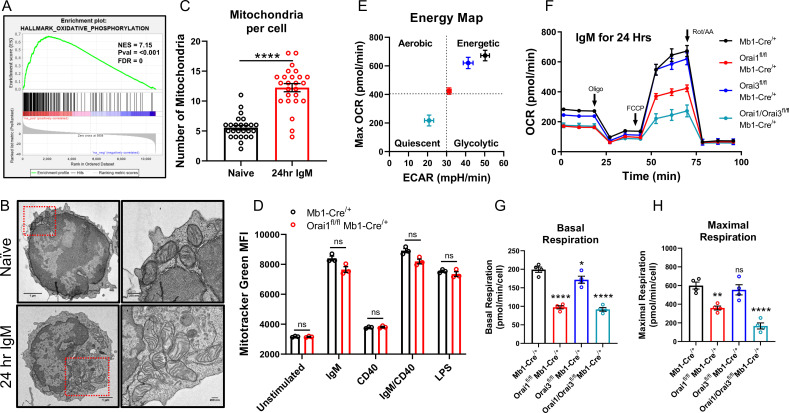
The essential role of store-operated Ca2+ entry (SOCE) through Ca2+ release-activated Ca2+ (CRAC) channels in T cells is well established. In contrast, the contribution of individual Orai isoforms to SOCE and their downstream signaling functions in B cells are poorly understood. Here, we demonstrate changes in the expression of Orai isoforms in response to B cell activation. We show that both Orai3 and Orai1 mediate native CRAC channels in B cells. The combined loss of Orai1 and Orai3, but not Orai3 alone, impairs SOCE, proliferation and survival, nuclear factor of activated T cells (NFAT) activation, mitochondrial respiration, glycolysis, and the metabolic reprogramming of primary B cells in response to antigenic stimulation. Nevertheless, the combined deletion of Orai1 and Orai3 in B cells did not compromise humoral immunity to influenza A virus infection in mice, suggesting that other in vivo co-stimulatory signals can overcome the requirement of BCR-mediated CRAC channel function in B cells. Our results shed important new light on the physiological roles of Orai1 and Orai3 proteins in SOCE and the effector functions of B lymphocytes.

Keywords: B cells; CRAC channels; Orai1; Orai3; SOCE; biochemistry; cell biology; chemical biology; metabolism; mouse.


Conflict of interest statement

SE, RY, XZ, AF, YW, KB, AT, PX, VW, MJ, TP, ZR No competing interests declared, AS owns stock options and is a consultant for Creegh Pharmaceuticals, SF is scientific co-founder of Calcimedica, MT Reviewing editor, eLife

Figures

Figure 1.
Figure 1.. B cell activation dynamically regulates Orai channel expression.
(A) Measurement of oxygen consumption rate (OCR) in primary B lymphocytes following 24 hr stimulation with anti-IgM (20 μg/mL), anti-CD40 (10 μg/mL), anti-IgM +anti-CD40, or LPS (10 μg/mL) using the Seahorse Mito Stress Test (n=3 biological replicates). (B) Energy map of maximal OCR and extracellular acidification rate (ECAR) following the addition of the protonophore carbonyl cyanide p-trifluoromethoxyphenylhydrazone (FCCP). (C, D) Quantification of basal (C) and maximal (D) respiration from Seahorse traces in (A) (One-way ANOVA with multiple comparisons to Unstimulated). (E, F) Measurement of (E) total mitochondrial content with the fluorescent dye MitoTracker Green and (F) mitochondrial membrane potential with TMRE following 24 hr stimulation (n=3 biological replicates; One-way ANOVA with multiple comparisons to Unstimulated). (G–I) Quantitative RT-PCR of (G) Orai1, (H) Orai2, and (I) Orai3 mRNA following 24 hr of stimulation with the stimuli indicated (n=3 biological replicates; one-way ANOVA with multiple comparisons to Unstimulated). All scatter plots and Seahorse traces are presented as mean ± SEM. For all figures, *p<0.05; **p<0.01; ***p<0.001; ****p<0.0001; ns, not significant.
Figure 2.
Figure 2.. Orai1 and Orai3 mediate the bulk of store-operated Ca2+ entry (SOCE) in A20 B lymphoblasts.
(A) Cartoon schematic of the two gRNA CRISPR strategies we used to excise mouse Orai1 and Orai3 genes. (B–D) Quantitative RT-PCR of (B) Orai1, (C) Orai2, and (D) Orai3 mRNA in A20 Orai CRISPR clones (n=3 biological replicates). (E) Measurement of SOCE with Fura2 upon store depletion with 2 µM thapsigargin in 0 mM Ca2+ followed by re-addition of 2 mM Ca2+ to the external bath solution. (F) Quantification of peak SOCE in (E) (from left to right n=99, 100, 89, and 98 cells; Kruskal-Wallis test with multiple comparisons to WT A20). (G–J) Representative Ca2+ oscillation traces from 5 cells/condition measured with Fura2 upon stimulation with 10 μg/mL anti-IgG antibodies at 60 s (indicated by arrows) in the presence of 2 mM external Ca2+. (K) Quantification of total oscillations in 9 min from (G–J) (from left to right n=76, 79, 79, and 78 cells; Kruskal-Wallis test with multiple comparisons to WT A20). All scatter plots are presented as mean ± SEM. For all figures, *p<0.05; **p<0.01; ****p<0.0001; ns, not significant.
Figure 3.
Figure 3.. Orai1 is dispensable for BCR-induced Ca2+ oscillations in primary B cells.
(A) Representative flow cytometry histogram of B cells isolated from Orai1fl/fl and Orai1fl/fl Mb1-Cre/+ mice. Splenocytes from naïve Orai1fl/fl and Orai1fl/fl Mb1-Cre/+ mice were fixed, permeabilized, and stained with rabbit anti-Orai1 polyclonal antibody (YZ6856, epitope: human ORAI1#275–291 intra-cellular C-terminal, cross-reacts with the mouse). The numbers inside the panel represent the mean fluorescence intensity (MFI) for the Orai1 antibody staining for each sample. (B) Quantification of Orai1 MFI minus fluorescence minus one (FMO) in B cells is shown. (n=4 biological replicates; unpaired T-test). (C–E) Quantitative RT-PCR of (C) Orai1, (D) Orai2, and (E) Orai3 mRNA in isolated B cells (n=6 biological replicates for each; Mann-Whitney test). (F) Measurement of SOCE with Fura2 upon store depletion with 2 µM thapsigargin in 0 mM Ca2+ followed by re-addition of 1 mM Ca2+ to the external bath solution. (G) Quantification of peak store-operated Ca2+ entry (SOCE) in (F) n=169 and 178 cells; Mann-Whitney test. (H–I) Representative Ca2+ oscillation traces from 5 cells/condition measured with Fura2 upon stimulation with 20 μg/mL anti-IgM antibodies at 1 min (indicated by arrows) in the presence of 1 mM external Ca2+. (J) Quantification of total oscillations in 9 min from (I, J) (n=97 and 111 cells; Mann-Whitney test). All scatter plots are presented as mean ± SEM. For all figures, **p<0.01; ****p<0.0001; ns, not significant.
Figure 3—figure supplement 1.
Figure 3—figure supplement 1.. Loss of Orai1 does not overtly affect B cell activation.
(A) Representative histograms of Orai1 fluorescence gated on B220+ B cells, CD3+CD4+ T cells, and CD3+CD8+ T cells from Mb1-Cre/+ mice. (B) Quantification of Orai1 mean fluorescence intensity (MFI) from each condition shown in (A) (n=8 biological replicates for each; one-way ANOVA). (C–D) Flow cytometry histograms of MHC-II expression on isolated B cells from (C) Mb1-Cre/+ and (D) Orai1fl/fl Mb1-Cre/+ mice following 24 hr stimulation. (E) Quantification of MHC-II MFI from (C–D) (n=3 biological replicates for each; Mann-Whitney test). (F–G) Histograms of CD86 expression following 24 hr stimulation. (H) Quantification of CD86 MFI from (F–G) (n=3 biological replicates for each; Mann-Whitney test). All scatter plots are presented as mean ± SEM. For all figures, *p<0.05; **p<0.01; ***p<0.001; ns, not significant.
Figure 4.
Figure 4.. Orai1 is dispensable for B cell development.
(A–B) Flow cytometric analysis of bone marrow populations for B cell fractions A (B220+CD43+HSABP-1), B (B220+CD43+HSA+BP-1), C (B220+CD43+HSA+BP-1+), D (B220+CD43IgMCD93+), E (B220+CD43IgM+CD93+), and F (B220+CD43IgM+CD93). (C) Quantification of bone marrow populations in (A, B) (n=7 and six biological replicates; Mann-Whitney test). (D) Flow cytometric analysis of isolated populations in the spleen for B cell developmental stages T1 (B220+AA4.1+CD23IgM+), T2 (B220+AA4.1+CD23+IgM+), and T3 (B220+AA4.1+CD23+IgM). (E) Flow cytometric analysis of isolated populations in the spleen for marginal zone (MZ) B cells (B220+CD93CD23IgM+) and follicular (FO) B cells (B220+CD93CD23+IgM+). (F) Quantification of splenic populations in (D, E) (n=7 and six biological replicates; Mann-Whitney test). All scatter plots are presented as mean ± SEM.
Figure 5.
Figure 5.. Orai1 and Orai3 synergistically mediate store-operated Ca2+ entry (SOCE) in primary B cells.
(A) Quantitative RT-PCR of Orai1, Orai2, and Orai3 mRNA in negatively isolated B cells from B cell-specific Orai knockout mice (n=3 biological replicates per genotype). (B) Measurement of SOCE in naïve B cells with Fura2 upon store depletion with 2 µM thapsigargin in 0 mM Ca2+ followed by re-addition of 1 mM Ca2+ to the external bath solution. Subsequently, SOCE was inhibited with the addition of 50 µM 2-APB at 13 min followed by 5 µM Gd3+ at 18 min. (C) Quantification of peak SOCE in (B) (from left to right n=200, 200, 199, and 149 cells; Kruskal-Wallis test with multiple comparisons to Mb1-Cre/+). (D) Quantification of the rate of 2-APB inhibition from 13 to 18 min. (E) Quantitative RT-PCR of Orai1, Orai2, and Orai3 mRNA in negatively isolated B cells from wild-type and Orai2-/- mice (n=3 and six biological replicates). (F) Measurement of SOCE in naïve B cells with Fura2 from wild-type and Orai2-/- mice. (G) Quantification of peak SOCE in (F) (n=147 and 240 cells; Mann-Whitney test). All scatter plots are presented as mean ± SEM. For all figures, ***p<0.001; ****p<0.0001; ns, not significant.
Figure 5—figure supplement 1.
Figure 5—figure supplement 1.. Store-operated Ca2+ entry (SOCE) in B cells activated for 48 hr with Anti-IgM +Anti CD40.
(A) Measurement of SOCE in B cells stimulated for 48 hr with anti-IgM +anti-CD40. (B) Quantification of peak SOCE in (A) (from left to right n=287, 288, 290, and 172 cells; Kruskal-Wallis test with multiple comparisons to Mb1-Cre/+). (C) Quantification of the rate of 2-APB inhibition from (A). All scatter plots are presented as mean ± SEM. For all figures, ***p<0.001; ****p<0.0001; ns, not significant.
Figure 6.
Figure 6.. Orai1 is a regulator of nuclear factor of activated T cells (NFAT) activation in naïve and activated B cells.
(A) Representative Imagestream images following intracellular staining for NFAT1 and DAPI in naïve B cells from Mb1-Cre/+ mice before and after 20 μg/mL anti-IgM stimulation for 15 min. Merge image indicates similarity score co-localization between NFAT1/DAPI. (B) Histograms of NFAT1/DAPI similarity scores before (black trace) and after (red trace) anti-IgM stimulation in naïve B cells from Mb1-Cre/+ and Orai1fl/fl Mb1-Cre/+ mice. (C) Quantification of similarity scores following anti-IgM stimulation in (B) (n=3 biological replicates for each; unpaired T-test). (D) Western blot analysis of NFAT1 and α-tubulin in naïve B cells isolated from Mb1-Cre/+ and Orai1fl/fl Mb1-Cre/+ mice. B cells were left unstimulated or treated with 2 µM thapsigargin (Tg) for 15 min before harvesting. (E) Quantification of NFAT1 dephosphorylation in (D) (n=4 biological replicates for each; Mann-Whitney test). (F) Western blot analysis of NFAT1 and α-tubulin in B cells stimulated for 48 hr with anti-IgM +anti-CD40. (G) Quantification of NFAT1 dephosphorylation in (F) (n=3 biological replicates for each; Mann-Whitney test). All scatter plots are presented as mean ± SEM. For all figures, *p<0.05; **p<0.01; ****p<0.0001.
Figure 6—figure supplement 1.
Figure 6—figure supplement 1.. Nuclear factor of activated T cells (NFAT) activation in primary Orai1/Orai3-deficient B cells.
(A) Western blot analysis of NFAT1, NFAT2, and α-tubulin in naïve B cells isolated from Mb1-Cre/+ and Orai1fl/fl Mb1-Cre/+ mice. B cells were either unstimulated or treated with 20 μg/mL anti-IgM or 2 µM thapsigargin (Tg) for 15 min before harvesting. (B) Western blot analysis of NFAT1 in naïve B cells isolated from Mb1-Cre/+, Orai1fl/fl Mb1-Cre/+, Orai3fl/fl Mb1-Cre/+, and Orai1/Orai3fl/fl Mb1-Cre/+ mice following thapsigargin treatment. (C) Same as in (B) but with B cells stimulated for 48 hr with anti-IgM +anti-CD40.
Figure 7.
Figure 7.. Orai1 and Orai3 regulate B cell proliferation and survival.
(A) Measurement of B cell proliferation by tracking cabroxyfluorescein diacetate succinimidyl ester (CFSE) dilution. B lymphocytes from control, Orai1, Orai3, and Orai1/Orai3 knockout mice were loaded with CFSE (3 μM) and stimulated with anti-IgM (20 μg/mL), anti-CD40 (10 μg/mL), anti-IgM +anti-CD40, or LPS (10 μg/mL). CFSE dilution was determined 72 hr after stimulation for all conditions. (B) Quantification of the percentage of proliferating cells for each condition in (A) (from left to right n=9, 8, 4, and 4 biological replicates; one-way ANOVA with multiple comparisons to Mb1-Cre/+). CFSE dilution gate is drawn relative to unstimulated controls. (C) Quantification of the percentage of viable cells for each condition in (A) as determined by a Live/Dead viability dye (from left to right n=9, 8, 4, and 4 biological replicates; one-way ANOVA with multiple comparisons to Mb1-Cre/+). (D) Top KEGG pathways showing differential expression from RNA-sequencing analysis of B cells from Mb1-Cre/+ vs Orai1/Orai3fl/fl Mb1-Cre/+ mice stimulated for 24 hr with anti-IgM (20 μg/mL) (n=3 biological replicates for each). (E) Gene set enrichment analysis (GSEA) plots show enrichment statistics (ES) in the Hallmark G2M Checkpoint, E2F Targets, and Cell Cycle gene sets. Large positive ES values suggest activation of these pathways. Normalized enrichment score (NES) values are used to assess statistical significance, and the results for these gene sets are highly significant. All scatter plots are presented as mean ± SEM. For all figures, **p<0.01; ***p<0.001; ****p<0.0001; ns, not significant.
Figure 7—figure supplement 1.
Figure 7—figure supplement 1.. Loss of Orai2 does not alter primary B cell proliferation or viability.
(A) Quantification of B cell proliferation by tracking cabroxyfluorescein diacetate succinimidyl ester (CFSE) dilution. B lymphocytes from wild-type and Orai2-/- mice were loaded with CFSE (3 μM) and stimulated with a titration of anti-IgM antibodies, anti-CD40 (10 μg/mL), anti-IgM +anti-CD40, or LPS (10 μg/mL). CFSE dilution was determined 72 hr after stimulation for all conditions (n=3 biological replicates for each; unpaired T-test). (B) Quantification of the percentage of viable cells for each condition in (A) as determined by a Live/Dead viability dye (n=3 biological replicates for each; unpaired T-test). All scatter plots are presented as mean ± SEM. For all figures, *p<0.05; **p<0.01; ***p<0.001; ns, not significant.
Figure 8.
Figure 8.. Orai1 and Orai3 regulate B cell mitochondrial respiration.
(A) Gene set enrichment analysis (GSEA) of the KEGG Oxidative Phosphorylation gene set in B cells stimulated for 24 hr with anti-IgM (20 μg/mL) relative to unstimulated controls. (B) Representative transmission electron microscopy (TEM) images of B cells from Mb1-Cre/+ mice. Shown are naïve, unstimulated B cells (top) and B cells stimulated for 24 hr with anti-IgM (bottom). (C) Quantification of total mitochondria per cell in unstimulated B cells and B cells stimulated for 24 hr with anti-IgM (n=25 for each; Mann-Whitney test). (D) Measurement of total mitochondrial content with MitoTracker Green in B cells from Mb1-Cre/+ and Orai1fl/fl Mb1-Cre/+ mice following 24 hr stimulation (n=3 biological replicates for each; Mann-Whitney test). (E) Measurement of oxygen consumption rate (OCR) in primary B lymphocytes following 24 hr stimulation with anti-IgM (20 μg/mL) using the Seahorse Mito Stress Test. (F) Energy map of maximal oxygen consumption rates (OCR) and extracellular acidification rates (ECAR) following carbonyl cyanide p-trifluoromethoxyphenylhydrazone (FCCP) addition. (G, H) Quantification of basal (G) and maximal (H) respiration from Seahorse traces in (E) (n=4 biological replicates for each genotype; one-way ANOVA with multiple comparisons to Mb1-Cre/+). All scatter plots and Seahorse traces are presented as mean ± SEM. For all figures, **p<0.01; ****p<0.0001; ns, not significant.
Figure 8—figure supplement 1.
Figure 8—figure supplement 1.. Loss of Orai1 does not alter CREB phosphorylation, MCU expression, or expression of electron transport chain proteins.
(A) Western blot analysis of total and phosphorylated CREB (S133), MCU, and GAPDH in isolated B cells from Mb1-Cre/+ and Orai1fl/fl Mb1-Cre/+ mice. B cells were either unstimulated or stimulated with anti-IgM (20 μg/mL) for 10, 20, or 30 min before harvesting. (B) Western blot analysis of MCU and GAPDH protein in single Orai1, and Orai3 knockout and double Orai1/Orai3 knockout A20 cell clones. (C, D) Western blot analysis of electron transport chain components in B cells from Mb1-Cre/+ and Orai1fl/fl Mb1-Cre/+ mice either (C) unstimulated or (D) stimulated with anti-IgM for 24 hr.
Figure 9.
Figure 9.. Orai1/Orai3-mediated SOCE-calcineurin-NFAT pathway regulates B cell metabolism.
(A) Analysis of polar metabolites in B cells from Mb1-Cre/+ mice utilizing liquid chromatography followed by mass spectrometry. B cells were either unstimulated or stimulated for 24 hr with anti-IgM, anti-IgM +anti-CD40, anti-IgM with 1 µM FK506, or anti-IgM with 10 µM GSK-7975A. (B, C). Heat maps of statistically significant polar metabolites in B cells from Mb1-Cre/+ and Orai1/Orai3fl/fl Mb1-Cre/+ mice following (B) 24 hr anti-IgM stimulation or (C) 24 hr anti-IgM +anti-CD40 stimulation. (n=3 biological replicates for each condition).
Figure 9—figure supplement 1.
Figure 9—figure supplement 1.. Polar metabolite analysis in Orai1/Orai3 deficient-B cells.
(A) Analysis of polar metabolites in B cells from Mb1-Cre/+ and Orai1/Orai3fl/fl Mb1-Cre/+. B cells were either unstimulated or stimulated for 24 hr with anti-IgM, anti-IgM +anti-CD40, anti-IgM +1 µM FK506, or anti-IgM +10 µM GSK-7975A. Profiling was performed on B cells from 3 mice per group. (B) Heat maps of statistically significant amino acids and nucleotide precursors in B cells from Mb1-Cre/+ and Orai1/Orai3fl/fl Mb1-Cre/+ mice following anti-IgM stimulation for 24 hr.
Figure 10.
Figure 10.. Deletion of Orai1 and Orai3 in B cells does not compromise immunity to influenza A virus (IAV).
(A) Experimental outline. Littermate controls and Orai1fl/flOrai3fl/fl Mb1-Cre/+ mice have infected intranasally with 1x10⁵ TCID50 of the x31 H3N2 strain of influenza A virus. Serum was collected on days 9 and 14, and mice were sacrificed on day 14 for analysis. (B) Representative H&E stains of lung sections. Scale bar: 500 µm. (C) Alveolar volume fraction of 10 mice per cohort. (D) Representative flow cytometry plots of B cells isolated from mediastinal lymph nodes (med LN). (E) Summary of the frequencies (%) and total cell numbers of B220CD138+ plasma cells and Fas+GL-7+ GC B cells shown in panel D from 10 mice per cohort. (F) Representative flow cytometry plots of plasma cells isolated from the bone marrow of five IAV-infected mice per cohort. (G) Representative flow cytometry plots (left) and summary (right) of the frequencies of class-switched IgG1+ GC B cells in med LN of five IAV-infected mice per cohort. (H) IAV-specific IgM and IgG levels in the serum of 10 mice per cohort were measured on days 9 and 14. Panels B-H show the results of two independent experiments. Statistical analysis by unpaired Student’s t-test: ***p<0.001, **p<0.01, *p<0.05.
Figure 10—figure supplement 1.
Figure 10—figure supplement 1.. Cytokine profiling of B cells from Orai1/Orai3fl/fl Mb1-Cre/+ mice.
(A–D) Heatmap display of genes comprising the KEGG Cytokine/Cytokine Receptor Interaction gene set from 24 hr anti-IgM stimulated B cells isolated from Mb1-Cre/+ and Orai1/Orai3fl/fl Mb1-Cre/+ mice. Each column represents B cells isolated from an individual mouse from the respective genotype.

Update of

  • doi: 10.1101/2022.05.06.490918

References

    1. Ahuja M, Schwartz DM, Tandon M, Son A, Zeng M, Swaim W, Eckhaus M, Hoffman V, Cui Y, Xiao B, Worley PF, Muallem S. Orai1-Mediated antimicrobial secretion from pancreatic acini shapes the gut microbiome and regulates gut innate immunity. Cell Metabolism. 2017;25:635–646. doi: 10.1016/j.cmet.2017.02.007. - DOI - PMC - PubMed
    1. Akkaya M, Traba J, Roesler AS, Miozzo P, Akkaya B, Theall BP, Sohn H, Pena M, Smelkinson M, Kabat J, Dahlstrom E, Dorward DW, Skinner J, Sack MN, Pierce SK. Second signals rescue B cells from activation-induced mitochondrial dysfunction and death. Nature Immunology. 2018;19:871–884. doi: 10.1038/s41590-018-0156-5. - DOI - PMC - PubMed
    1. Akkaya M, Pierce SK. From zero to sixty and back to zero again: The metabolic life of B cells. Current Opinion in Immunology. 2019;57:1–7. doi: 10.1016/j.coi.2018.09.019. - DOI - PMC - PubMed
    1. Baba Y, Kurosaki T. Role of calcium signaling in B cell activation and biology. Current Topics in Microbiology and Immunology. 2016;393:143–174. doi: 10.1007/82_2015_477. - DOI - PubMed
    1. Berry CT, May MJ, Freedman BD. STIM- and Orai-mediated calcium entry controls NF-κB activity and function in lymphocytes. Cell Calcium. 2018;74:131–143. doi: 10.1016/j.ceca.2018.07.003. - DOI - PMC - PubMed

Publication types

LinkOut - more resources