. 2023 Apr 15:270:119949.
doi: 10.1016/j.neuroimage.2023.119949. Epub 2023 Feb 17.

Evaluating increases in sensitivity from NORDIC for diverse fMRI acquisition strategies

Affiliations

Evaluating increases in sensitivity from NORDIC for diverse fMRI acquisition strategies

Logan T Dowdle et al. Neuroimage. .

Abstract

As the neuroimaging field moves towards detecting smaller effects at higher spatial resolutions, and faster sampling rates, there is increased attention given to the deleterious contribution of unstructured, thermal noise. Here, we critically evaluate the performance of a recently developed reconstruction method, termed NORDIC, for suppressing thermal noise using datasets acquired with various field strengths, voxel sizes, sampling rates, and task designs. Following minimal preprocessing, statistical activation (t-values) of NORDIC processed data was compared to the results obtained with alternative denoising methods. Additionally, we examined the consistency of the estimates of task responses at the single-voxel, single run level, using a finite impulse response (FIR) model. To examine the potential impact on effective image resolution, the overall smoothness of the data processed with different methods was estimated. Finally, to determine if NORDIC alters or removes temporal information important for modeling responses, we employed an exhaustive leave-p-out cross validation approach, using FIR task responses to predict held out timeseries, quantified using R2. After NORDIC, the t-values are increased, an improvement comparable to what could be achieved by 1.5 voxels smoothing, and task events are clearly visible and have less cross-run error. These advantages are achieved with smoothness estimates increasing by less than 4%, while 1.5 voxel smoothing is associated with increases of over 140%. Cross-validated R2s based on the FIR models show that NORDIC is not measurably distorting the temporal structure of the data under this approach and is the best predictor of non-denoised time courses. The results demonstrate that analyzing 1 run of data after NORDIC produces results equivalent to using 2 to 3 original runs and that NORDIC performs equally well across a diverse array of functional imaging protocols. Significance Statement: For functional neuroimaging, the increasing availability of higher field strengths and ever higher spatiotemporal resolutions has led to concomitant increase in concerns about the deleterious effects of thermal noise. Historically this noise source was suppressed using methods that reduce spatial precision such as image blurring or averaging over a large number of trials or sessions, which necessitates large data collection efforts. Here, we critically evaluate the performance of a recently developed reconstruction method, termed NORDIC, which suppresses thermal noise. Across datasets varying in field strength, voxel sizes, sampling rates, and task designs, NORDIC produces substantial gains in data quality. Both conventional t-statistics derived from general linear models and coefficients of determination for predicting unseen data are improved. These gains match or even exceed those associated with 1 voxel Full Width Half Max image smoothing, however, even such small amounts of smoothing are associated with a 52% reduction in estimates of spatial precision, whereas the measurable difference in spatial precision is less than 4% following NORDIC.


Figures

Fig. 1.
Fig. 1.
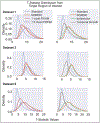
The distributions of t-Statistics from the model using all runs of data are shown. Distributions show the t-statistics of voxels from Non-Target (left) and Target (right) ROIs, defined as those that displayed significant positive stimulus-evoked changes relative to baseline (Non-Target) or in the contrast between Target and Non-Target conditions (Target) in the Standard data. Functional maps of the corresponding contrast are shown for visual reference at a t-value threshold of 3.3, corresponding to voxel-wise p<0.001 (uncorrected). NORDIC and Standard reconstructed functional maps are identified by the color of the border of the two images shown for each dataset (blue=Standard, orange=NORDIC). Across all datasets and both ROIs, the distribution of t-statistics for NORDIC was higher, with a longer tail.
Fig. 2.
Fig. 2.
Distributions of t-statistics from alternative noise reduction methods within the Target ROI. Left column shows data from Standard, NORDIC and spatial smoothing with 1 and 1.5 voxel FWHM spatial smoothing. Right column compares the same Standard and NORDIC data against temporal smoothing and dwidenoise denoising. T-values were extracted from the Target ROI defined using the Standard data. The t-values obtained with NORDIC (Orange, dashed) processed data is comparable to the effects of an additional 1 or 1.5 voxels FWHM gaussian smoothing. While temporal smoothing (brown) did increase t-statistics for Dataset 1, note that for the fast event-related design (Dataset 3) this led to a temporal blending of neighboring events, leading to positive and negative t-values, an effect not found in NORDIC data.
Fig. 3.
Fig. 3.
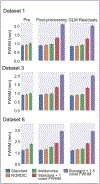
Estimated spatial smoothness in mm (FWHM) at various processing stages for each method. Prior to processing (left), NORDIC results in an average increase in 5.1% in smoothness and dwidenoise results in an increase of 22.4% on average. After processing, but prior to the GLM (middle) this trend remains. Note that the image smoothness of the Standard, NORDIC, and dwidenoise data are substantially below the level of the additional 1 or 1.5 voxels of additional smoothing. These trends remain the same for the residuals (right) after the conventional GLM. Error bars indicate standard deviation over runs.
Fig. 4.
Fig. 4.
Local smoothness estimated from GLM residuals, across all runs. A) Selected slices and local smoothness estimates, in FWHM mm. The leftmost panel shows the selected EPI slice. The next three panels show the estimated, voxel-wise (local) spatial smoothness for the three different processing methods, Standard (blue border), NORDIC (orange) and dwidenoise (green), with the scales identical between the different processing types. Note that the local spatial smoothness is often highest in dark areas of the EPI image, likely associated with veins. B) Full distributions of voxel-wise local smoothness estimates within different tissue classes. These kernel density estimates show the distributions of the local spatial smoothness estimates in tissue classes derived from a T1-weighted anatomical image for Standard (blue), NORDIC (orange) and dwidenoise (green). Local smoothness is somewhat decreased following NORDIC, except within the CSF mask. All datasets had a prescribed resolution of 0.8 mm isotropic.
Fig. 5.
Fig. 5.
Comparing Residuals from Denoising Methods. The first column shows the selected views using the reconstructed EPI images. The next column shows the g-factor maps calculated from the raw k-space data. The last two columns show the temporal mean (absolute values) of the extracted noise from the first run for NORDIC (column 3) and dwidenoise (column 4).
Fig. 6.
Fig. 6.
Frequency Plots from FFT analysis. Panel A) Normalized power spectra from DS7, a 3T, HCP-like acquisition with 800 ms TR. NORDIC processing reduces power throughout most frequency bands, with effects such as a task harmonic (~0.2 Hz) and the respiratory band (~0.3 Hz) becoming more visible. Insets show power from 0.01 through 0.2. Panel B) Normalized power spectra from DS8, a rapidly sampled acquisition with 350 ms TR. The effect of NORDIC in broadly reducing power remains pronounced throughout higher frequencies. Here the respiratory and cardiac signals are clear at ~0.3 and ~1 Hz respectively. In the gray matter, a clear peak at 0.05 Hz, corresponding the task frequency is also clearer after NORDIC processing (see inset). Shading shows standard deviation across independent runs for both A and B.
Fig. 7.
Fig. 7.
Example of activation, improved time courses and FIR estimates in run 1 of DS1, Panel A, upper row Different views of the area under consideration from Standard reconstruction: Left column shows the mean GE-EPI values for the area under consideration. Right shows the activation amplitude (−12 to 12% signal change) in the selected slice for all runs, Center > Surround from the Standard data (map threshold from t-stat ≥ 3.3). Inset boxes in panel A show the 81 voxels considered in Panel B. B) Time courses from first run for 81 voxels. To visualize task responsive voxels, we shade them based on the contrast from all runs of Standard data, as seen in Panel A, right. The stimulus-evoked signal amplitude changes associated with the three surround and the three target stimulus epochs are clearly visible in the NORDIC processed (Right) timeseries of the corresponding voxels but are largely invisible in the Standard (Left) data due to high noise levels. C) Single Run FIR Estimates for the Target Condition. Responses to the target (center) are illustrated in selected voxels 1 and 2 for individual runs are shown. The final columns show the across-run average and standard deviation respectively. Shading in the across-run average plot shows standard deviation from the mean, which is also plotted separately for clarity (note that the deviation associated with the Standard data far exceeds that of NORDIC). Voxel 3, which is sensitive to the surround condition, remains closer to the expected zero amplitude (i.e., non-responsive). This is particularly true for NORDIC processed data, which is associated with lower standard deviation.
Fig. 8.
Fig. 8.
NORDIC processing leads to higher cross-validation performance, predicting from a finite impulse response model. Panel A) Exhaustive cross validation performance when training on using only one run. Cross validated R2 is shown for training on Standard data and predicting held-out Standard data (blue), training on NORDIC data and predicting held-out NORDIC data (yellow), and training on NORDIC data and predicting held-out Standard data (Orange). X-Axis indicates voxel inclusion threshold derived from leave-one-out cross-validated R2 using a canonical HRF on Standard data. Insets show example single voxel single run FIR model estimates for Standard (blue) and NORDIC (Orange). NORDIC processing can produce estimates that better predict Standard data compared to Standard data itself. Error bars are standard error over permutations. Dashed lines show an R2 threshold of 15% used in panel B. Panel B) Leave-p-Out training was repeated for all Ps less than the number of runs, N-1. Colors are as above; the number of runs included in the training vary across the X-axis, with bar height reflecting the R2 obtained. Dashed line indicates the performance of training on one run of NORDIC data, which is equivalent in cross validation performance to using 2 or 3 runs of Standard data. Including more data allows Standard models to approach, but not reach 2 to 3 runs of NORDIC data. Error bars again show standard error across permutations. Error bars in A indicate standard error and those in B indicate standard deviation.

References

    1. Ades-Aron B, Lemberskiy G, Veraart J, Golfinos J, Fieremans E, Novikov DS, Shepherd T, 2021. Improved task-based functional MRI language mapping in patients with brain tumors through Marchenko-Pastur principal component analysis denoising. Radiology 365–373. - PMC - PubMed
    1. Adhikari BM, Jahanshad N, Shukla D, Turner J, Grotegerd D, Dannlowski U, Kugel H, Engelen J, Dietsche B, Krug A, Kircher T, Fieremans E, Veraart J, Novikov DS, Boedhoe PSW, van der Werf YD, van den Heuvel OA, Ipser J, Uhlmann A, Stein DJ, Dickie E, Voineskos AN, Malhotra AK, Pizzagalli F, Calhoun VD, Waller L, Veer IM, Walter H, Buchanan RW, Glahn DC, Hong LE, Thompson PM, Kochunov P, 2019. A resting state fMRI analysis pipeline for pooling inference across diverse cohorts: an ENIGMA rs-fMRI protocol. Brain Imaging Behav. 13, 1453–1467. doi:10.1007/s11682-018-9941-x. - DOI - PMC - PubMed
    1. Ashburner J, Friston KJ, 2005. Unified segmentation. Neuroimage 26, 839–851. doi:10.1016/j.neuroimage.2005.02.018. - DOI - PubMed
    1. Bianciardi M, van Gelderen P, Duyn JH, Fukunaga M, de Zwart JA, 2009. Making the most of fMRI at 7 T by suppressing spontaneous signal fluctuations. Neuroimage 448–454. - PMC - PubMed
    1. Blazejewska AI, Fischl B, Wald LL, Polimeni JR, 2019. Intracortical smoothing of small-voxel fMRI data can provide increased detection power without spatial resolution losses compared to conventional large-voxel fMRI data. Neuroimage 189, 601–614. doi:10.1016/j.neuroimage.2019.01.054. - DOI - PMC - PubMed

Publication types

MeSH terms