

Biomarkers and longitudinal changes in lumbar spine degeneration and low back pain: the Johnston County Osteoarthritis Project
- PMID: 36804589
- PMCID: PMC10200763
- DOI: 10.1016/j.joca.2023.02.005
Biomarkers and longitudinal changes in lumbar spine degeneration and low back pain: the Johnston County Osteoarthritis Project
Abstract
Objective: To determine if baseline biomarkers are associated with longitudinal changes in the worsening of disc space narrowing (DSN), vertebral osteophytes (OST), and low back pain (LBP).
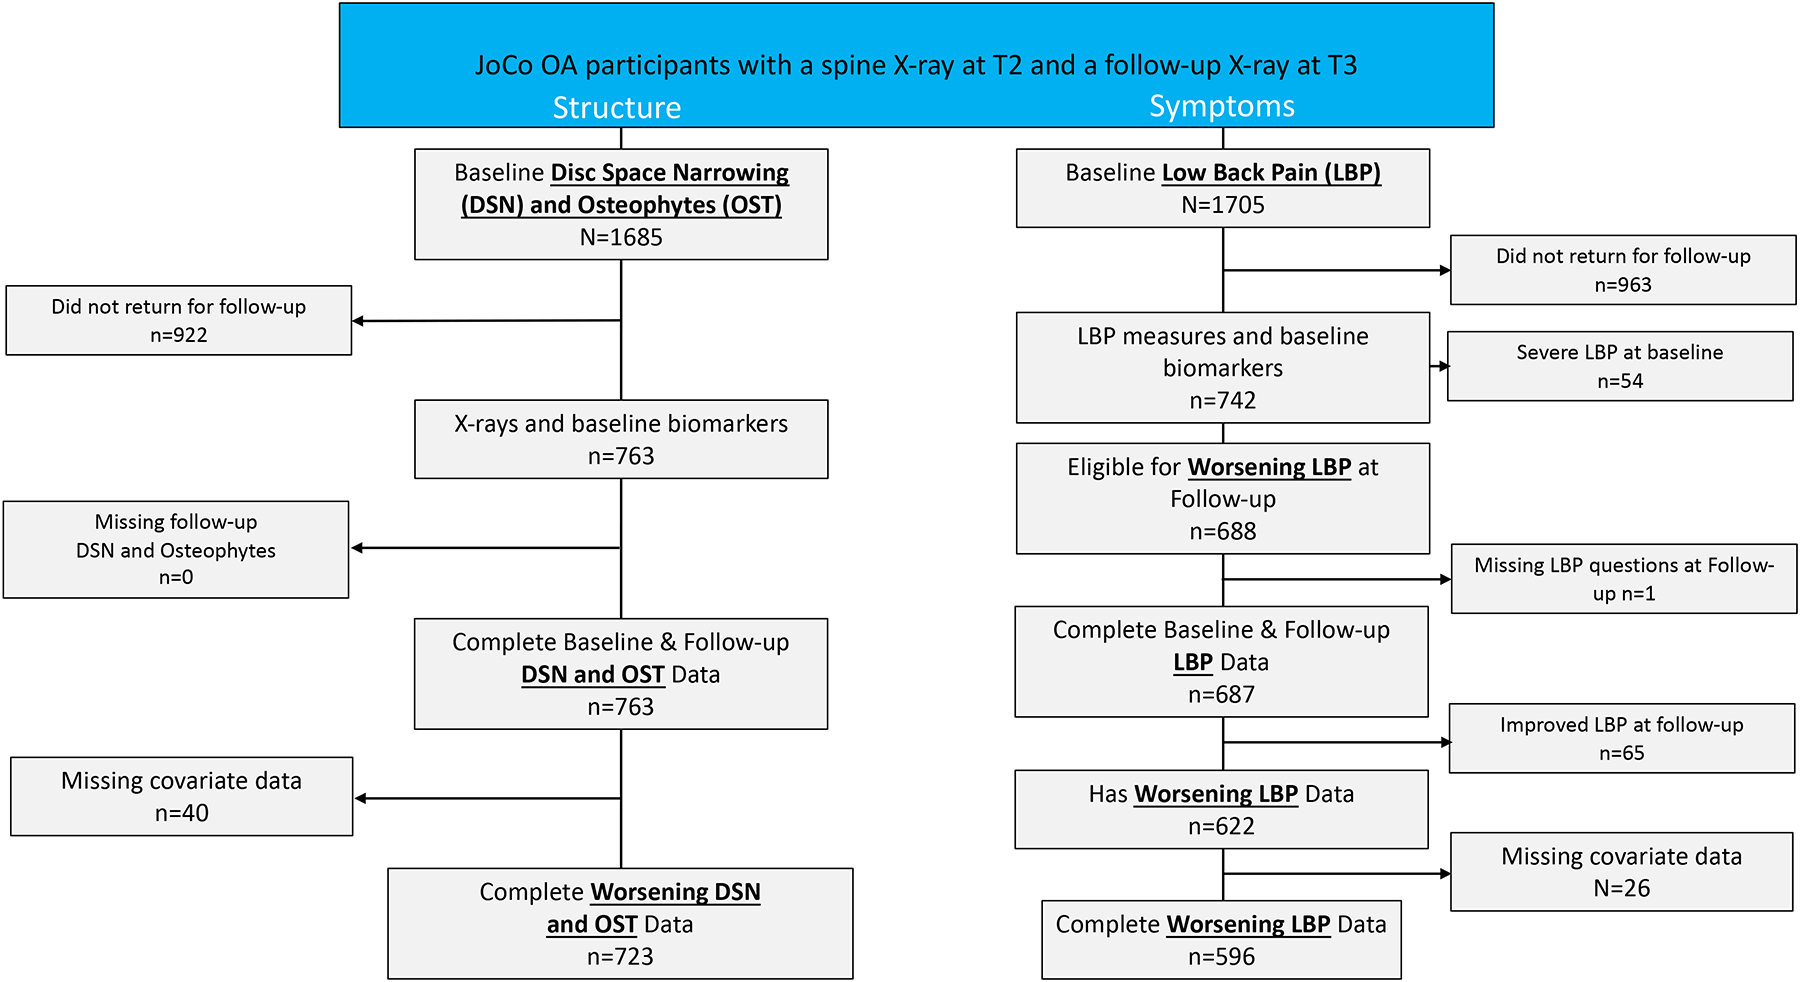
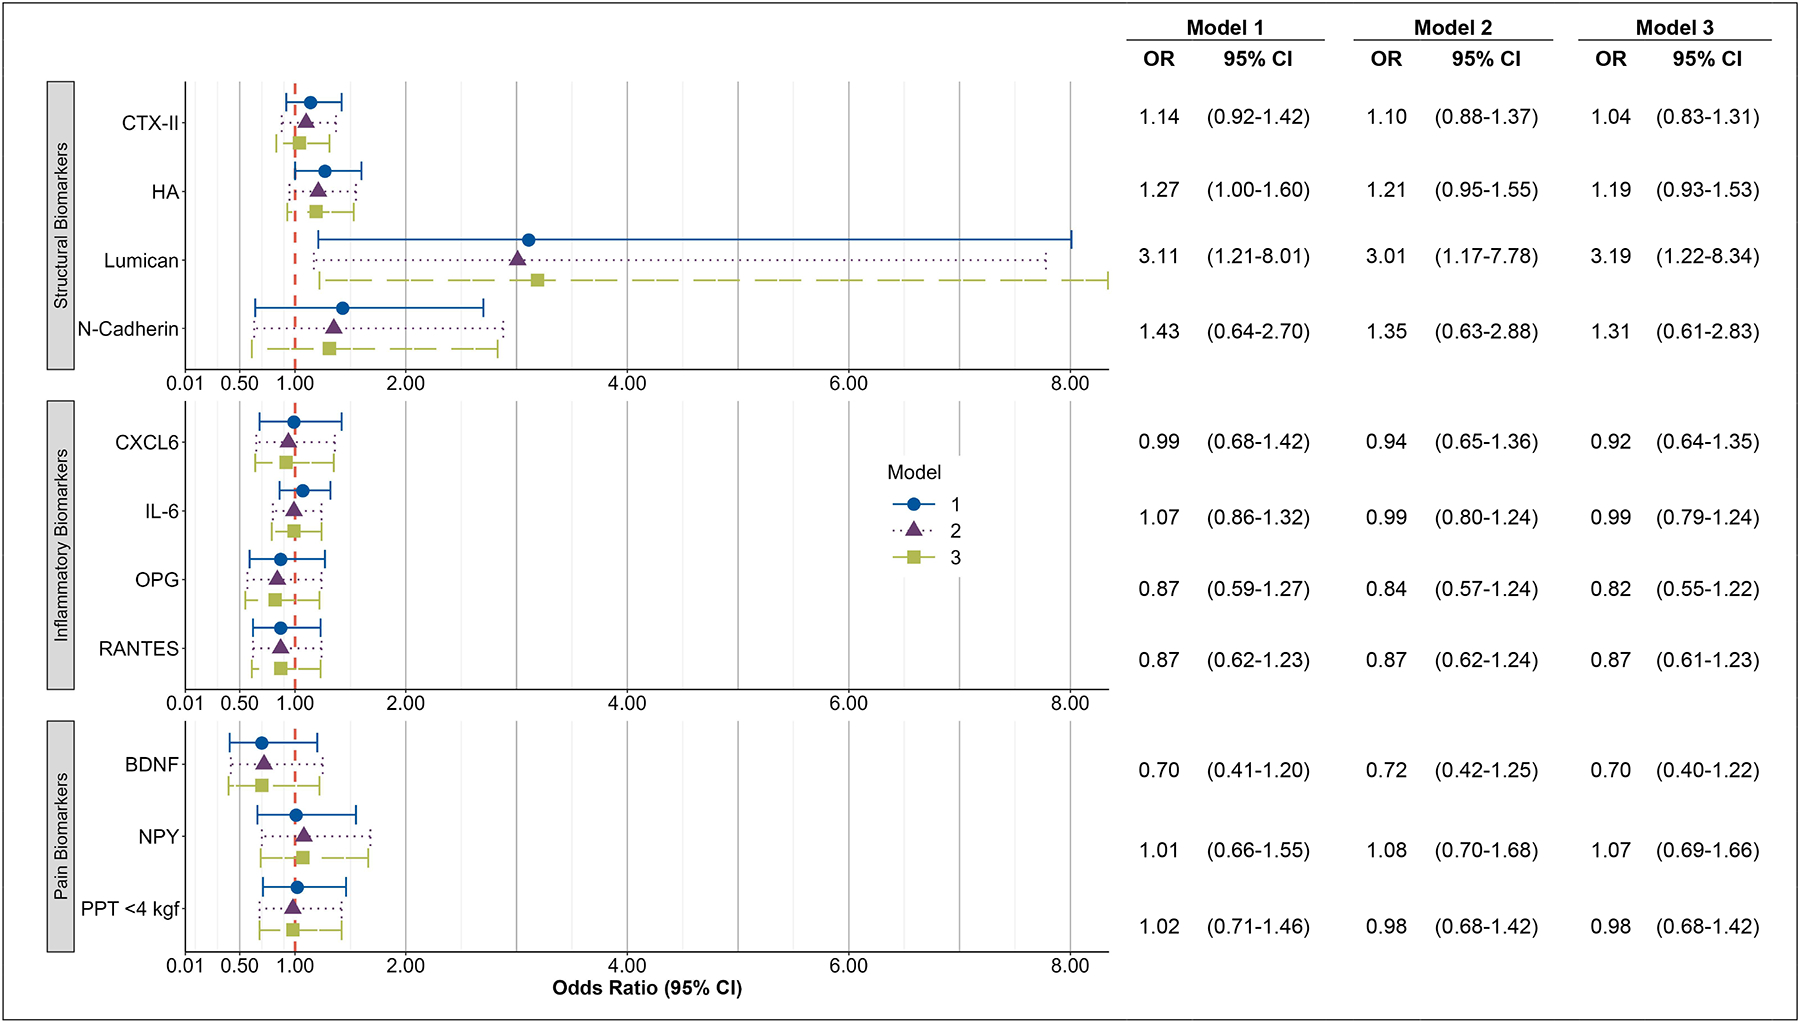
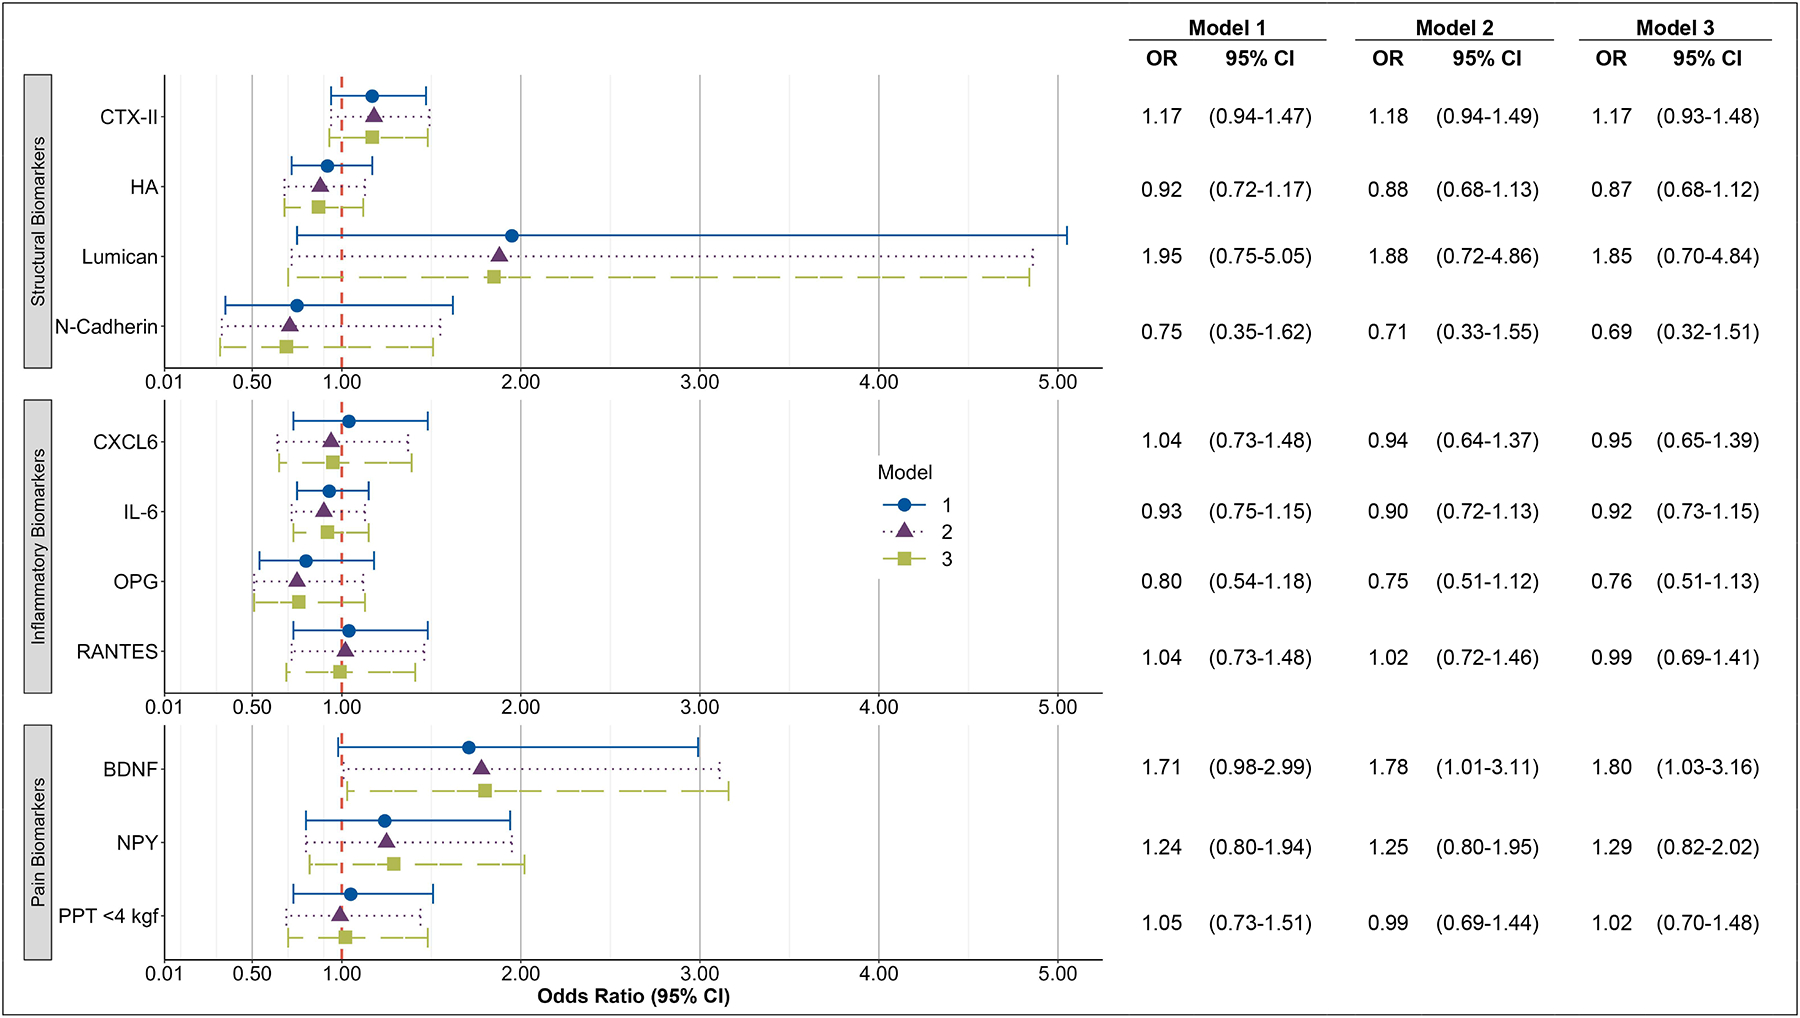
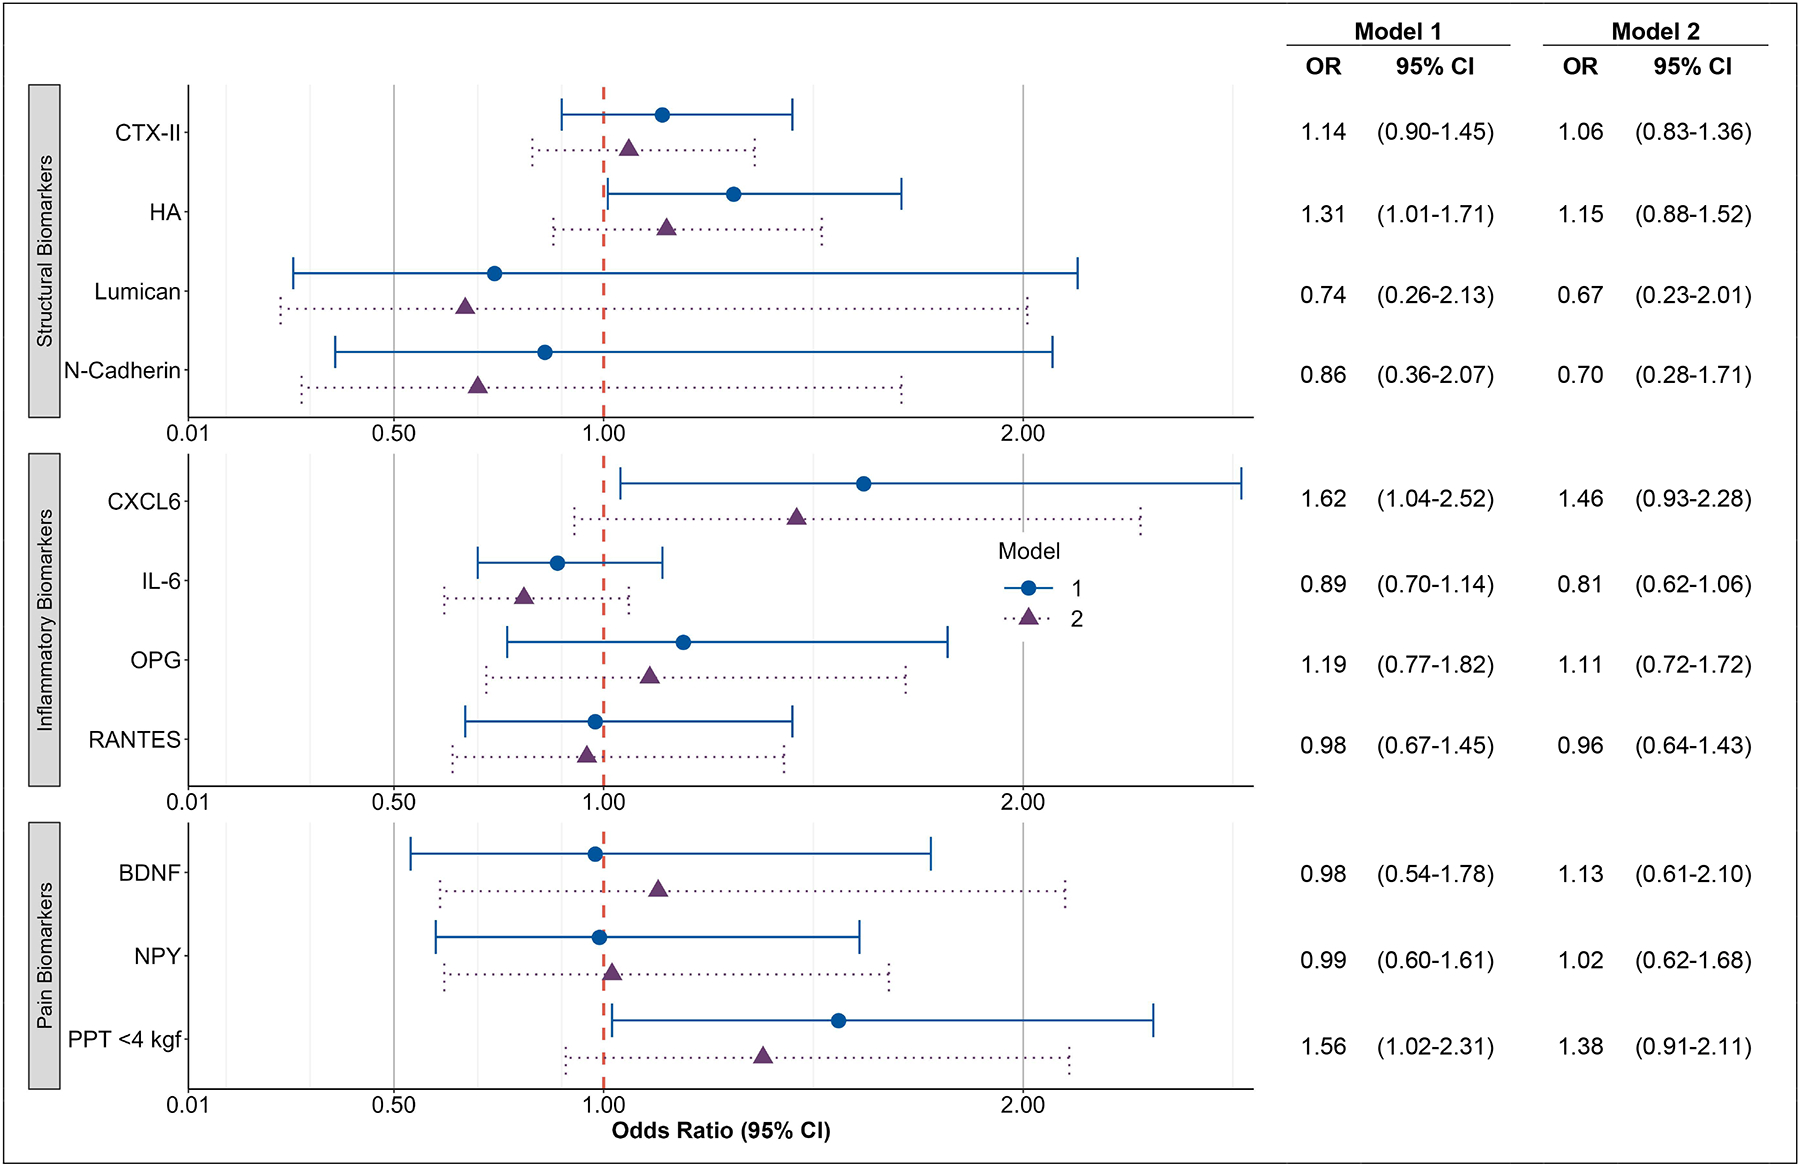
Design: Paired baseline (2003-2004) and follow-up (2006-2010) lumbar spine radiographs from the Johnston County Osteoarthritis Project were graded for severity of DSN and OST. LBP severity was self-reported. Concentrations of analytes (cytokines, proteoglycans, and neuropeptides) were quantified by immunoassay. Pressure-pain threshold (PPT), a marker of sensitivity to pressure pain, was measured with a standard dolorimeter. Binary logistic regression models were used to estimate odd ratios (OR) and 95% confidence intervals (CI) of biomarker levels with DSN, OST, or LBP. Interactions were tested between biomarker levels and the number of affected lumbar spine levels or LBP.
Results: We included participants (n = 723) with biospecimens, PPT, and paired lumbar spine radiographic data. Baseline Lumican, a proteoglycan reflective of extracellular matrix changes, was associated with longitudinal changes in DSN worsening (OR = 3.19 [95% CI 1.22, 8.01]). Baseline brain-derived neuropathic factor, a neuropeptide, (OR = 1.80 [95% CI 1.03, 3.16]) was associated with longitudinal changes in OST worsening, which may reflect osteoclast genesis. Baseline hyaluronic acid (OR = 1.31 [95% CI 1.01, 1.71]), indicative of systemic inflammation, and PPT (OR = 1.56 [95% CI 1.02, 2.31]) were associated with longitudinal increases in LBP severity.
Conclusion: These findings suggest that baseline biomarkers are associated with longitudinal changes occurring in structures of the lumbar spine (DSN vs OST). Markers of inflammation and perceived pressure pain sensitivity were associated with longitudinal worsening of LBP.
Keywords: Biomarkers; Cohort study; Intervertebral disc degeneration; Low back pain; Spine degeneration.
Copyright © 2023 Osteoarthritis Research Society International. Published by Elsevier Ltd. All rights reserved.
Conflict of interest statement
Figures
Similar articles
-
Predictors of Lumbar Spine Degeneration and Low Back Pain in the Community: The Johnston County Osteoarthritis Project.Arthritis Care Res (Hoboken). 2022 Oct;74(10):1659-1666. doi: 10.1002/acr.24643. Epub 2022 Jun 28. Arthritis Care Res (Hoboken). 2022. PMID: 33973412 Free PMC article.
-
Inflammatory, Structural, and Pain Biochemical Biomarkers May Reflect Radiographic Disc Space Narrowing: The Johnston County Osteoarthritis Project.J Orthop Res. 2020 May;38(5):1027-1037. doi: 10.1002/jor.24534. Epub 2019 Dec 4. J Orthop Res. 2020. PMID: 31750565 Free PMC article.
-
Biomarker clusters differentiate phenotypes of lumbar spine degeneration and low back pain: The Johnston County Osteoarthritis Project.Osteoarthr Cartil Open. 2022 Sep;4(3):100270. doi: 10.1016/j.ocarto.2022.100270. Epub 2022 May 12. Osteoarthr Cartil Open. 2022. PMID: 35991624 Free PMC article.
-
Low back pain and lumbar spine osteoarthritis: how are they related?Curr Rheumatol Rep. 2013 Feb;15(2):305. doi: 10.1007/s11926-012-0305-z. Curr Rheumatol Rep. 2013. PMID: 23307577 Free PMC article. Review.
-
Diagnostic Role of Magnetic Resonance Imaging in Low Back Pain Caused by Vertebral Endplate Degeneration.J Magn Reson Imaging. 2022 Mar;55(3):755-771. doi: 10.1002/jmri.27858. Epub 2021 Jul 26. J Magn Reson Imaging. 2022. PMID: 34309129 Review.
Cited by
-
Multiple joint osteoarthritis (MJOA): What's in a name?Osteoarthritis Cartilage. 2024 Mar;32(3):234-240. doi: 10.1016/j.joca.2023.10.008. Epub 2023 Nov 19. Osteoarthritis Cartilage. 2024. PMID: 37984559 Free PMC article. Review.
-
Lumican, a Multifunctional Cell Instructive Biomarker Proteoglycan Has Novel Roles as a Marker of the Hypercoagulative State of Long Covid Disease.Int J Mol Sci. 2024 Feb 29;25(5):2825. doi: 10.3390/ijms25052825. Int J Mol Sci. 2024. PMID: 38474072 Free PMC article. Review.
-
TNFα-reliant FSP1 up-regulation promotes intervertebral disc degeneration via caspase 3-dependent apoptosis.Genes Dis. 2024 Feb 28;12(1):101251. doi: 10.1016/j.gendis.2024.101251. eCollection 2025 Jan. Genes Dis. 2024. PMID: 39552786 Free PMC article.
-
Osteoarthritis Year in Review 2024: Molecular biomarkers of osteoarthritis.Osteoarthritis Cartilage. 2025 Jan;33(1):67-87. doi: 10.1016/j.joca.2024.10.003. Epub 2024 Oct 18. Osteoarthritis Cartilage. 2025. PMID: 39427749 Review.
-
Association between metabolism and low back pain: a cross-sectional study.J Orthop Surg Res. 2025 Aug 21;20(1):784. doi: 10.1186/s13018-025-06218-9. J Orthop Surg Res. 2025. PMID: 40841650 Free PMC article.
References
-
- Muraki S, Akune T, Oka H, Ishimoto Y, Nagata K, Yoshida M, et al. Incidence and risk factors for radiographic lumbar spondylosis and lower back pain in Japanese men and women: the ROAD study. Osteoarthritis Cartilage 2012; 20: 712–718. - PubMed
-
- Muraki S, Oka H, Akune T, Mabuchi A, En-Yo Y, Yoshida M, et al. Prevalence of radiographic lumbar spondylosis and its association with low back pain in elderly subjects of population-based cohorts: the ROAD study. Ann Rheum Dis 2009; 68: 1401–1406. - PubMed
-
- Goode AP, Cleveland RJ, George SZ, Schwartz TA, Kraus VB, Renner JB, et al. Predictors of lumbar spine degeneration and low back pain in the community: The Johnston County Osteoarthritis Project. Arthritis Care Res (Hoboken) published online ahead of print, 2021. doi:10.1002/acr.24643. - DOI - PMC - PubMed
Publication types
MeSH terms
Substances
Grants and funding
LinkOut - more resources
Full Text Sources
Medical
Miscellaneous
