. 2023 Feb 20;14(1):948.
doi: 10.1038/s41467-023-36598-7.

Identification of global inhibitors of cellular glycosylation

Affiliations

Identification of global inhibitors of cellular glycosylation

Daniel Madriz Sørensen et al. Nat Commun. .

Abstract

Small molecule inhibitors of glycosylation enzymes are valuable tools for dissecting glycan functions and potential drug candidates. Screening for inhibitors of glycosyltransferases are mainly performed by in vitro enzyme assays with difficulties moving candidates to cells and animals. Here, we circumvent this by employing a cell-based screening assay using glycoengineered cells expressing tailored reporter glycoproteins. We focused on GalNAc-type O-glycosylation and selected the GalNAc-T11 isoenzyme that selectively glycosylates endocytic low-density lipoprotein receptor (LDLR)-related proteins as targets. Our screen of a limited small molecule compound library did not identify selective inhibitors of GalNAc-T11, however, we identify two compounds that broadly inhibited Golgi-localized glycosylation processes. These compounds mediate the reversible fragmentation of the Golgi system without affecting secretion. We demonstrate how these inhibitors can be used to manipulate glycosylation in cells to induce expression of truncated O-glycans and augment binding of cancer-specific Tn-glycoprotein antibodies and to inhibit expression of heparan sulfate and binding and infection of SARS-CoV-2.


Conflict of interest statement

University of Copenhagen has filed a patent application covering the design of the cell-based screening assay for inhibitors described here, which is currently pending. Application numbers are: EP3455635A1, PCT/EP2017/061385, USPTO 20190330601, the inventors are: Eric Bennett, Yoshiki Narimatsu (Y.N.), Catharina Steentoft, Zhang Yang, Ulla Mandel, and Henrik Clausen (H.C.). GlycoDisplay Aps, Copenhagen, Denmark, has obtained a license to the field of the patent application. Y.N. and H.C. are co-founders of GlycoDisplay Aps and hold ownerships in the company as well as served as unpaid consultants. The remaining authors declare no competing interests.

Figures
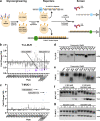
Fig. 1
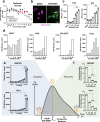
Fig. 1. Glycoengineered cell-based high-throughput screening identifies lead compounds altering O-glycan reporter protein glycosylation.
a Schematic presentation of the glycoengineering strategy yielding HEK293 (HEK) cells that stably secrete Tn-LDLR (HEKKO COSMC) or T-MUC1 (HEKKO GCNT1, ST3GAL1/2) reporter proteins, respectively, for cell-based HTP screening of 1952 compounds in a 96-well plate format by a VVA lectin ELLA (enzyme-linked lectin assay) detecting loss/gain of the Tn epitope on the reporter proteins. Secreted protein reporters include 6x-His-tag (His), FLAG-tag (F) and Myc-tag (M). b, c Dot plots show binding of VVA to LDLR (b) or MUC1 (c) reporter proteins secreted by glycoengineered cells treated with the 1952 compounds organized per 96-well plate, each containing 80 compounds and 3 DMSO vehicle controls. VVA binding is presented as fold-change binding normalized to DMSO control (black line). Active compounds were selected based on cut-off values (gray lines) for VVA binding to Tn-LDLR ( > 4-fold decrease) and to T-MUC1 ( > 3-fold increase). c, e Representative western blots show changes in molecular weight of the Tn-LDLR (c) and T-MUC1 (d) reporters secreted from HEKWT cells treated with 10 µM of each lead compound or DMSO control for 24 h. Reporters were detected by anti-6x His-tag antibodies. f, g Western blots show the MUC1 reporter produced in HEKWT (f) and HEKKO COSMC (g) cells incubated for 24 h with 0–10 µM NSC80997 or NSC255112 and detected by anti-6xHis-tag antibody (upper panel) and VVA (lower panel).
Fig. 2
Fig. 2. NSC80997 and NSC255112 induce Tn expression in human cell lines.
a Line graph shows metabolic activity of HEKWT cells treated with 0–128 µM NSC80997 and NSC255112 for 24 h measured by MTT assay. Data are presented as average 595 nm absorbance values ± SEM from three independent experiments. b Representative images show HeLaWT cells treated for 24 h with DMSO or 10 µM NSC80997 and stained with VVA lectin (green) and DAPI (magenta). Scale bar represents 20 µm. c Bar diagrams show cell surface Tn induction in HEKWT cells treated with increasing concentrations of NSC80997 or DMSO control for 24 h. Binding of VVA (left) or anti-Tn (1E3) monoclonal antibody (right) was quantified by flow cytometry. Data from three independent experiments are presented as average mean fluorescence intensity (MFI) ± SEM (arbitrary unit) ***P < 0.0001 (ANOVA). d Bar diagrams show MFI values of cell surface VVA binding to MCF7, AGS, SH-SY5Y, and HeLa cells treated with 0-20 µM NSC80997 for 24 h assessed by flow cytometry. Data is representative of two independent experiments. e, f Time-course analysis of cell surface Tn induction by NSC80997 (e) and recovery of glycosylation after removal of NSC80997 from culture medium (f) in HEK293WT cells (top) and HeLaWT cells (bottom). Cells were treated with 10 µM NSC80997 and VVA binding was assessed at indicated timepoints by flow cytometry. Data from three independent experiments are presented as average mean fluorescence intensity (MFI) ± SEM (arbitrary units). ***P < 0.0001 (ANOVA) (e). Loss of surface Tn structures in HEKWT (top) and HeLaWT (bottom) cells after treatment with NSC80997 for 24 h and extensive washing was detected by VVA staining and flow cytometry analysis 24, 48, and 72 h after treatment (f). Data from three independent experiments are presented as average mean fluorescence intensity (MFI) ± SEM (arbitrary units). ***P < 0.0001 (ANOVA).
Fig. 3
Fig. 3. Remodeling of glycosylation by lead compounds is independent of the glucocorticoid receptor (GR).
a Chemical structure of NSC80997 and NSC255112. b Representative images of MCF7WT cells treated with DMSO, 10 µM or 10 nm NSC80997 or dexamethasone for 24 h, stained with isotype or anti-GR antibody (green) and DAPI (magenta). Scale bar represents 20 µm. c Bar diagram shows cell surface VVA binding to HEK293WT cells treated for 24 h with increasing concentrations of mifepristone, mometasone furoate, cortisone, cortisol, dexamethasone, or NSC80997. DMSO and methanol served as controls. Data was assessed by flow cytometry, is presented as mean fluorescence intensity (MFI) (arbitrary units) and is representative of two independent experiments. d NSC80997-mediated Tn induction in GR knock-out (Δ) cell lines. Bar diagram shows VVA binding to HEK293WT, HEK293KO NR3C1 and HEK293KO NR3C4 cells treated with 10 µM NSC80997 or DMSO control for 24 h. Lectin binding was assessed by flow cytometry and data are presented as average MFI values (arbitrary units) of two independent experiments. e The methyl ketone in NSC80997 was reduced to a secondary alcohol in NSC80997-KR highlighted in red. f Bar diagram shows VVA binding to HEK293WT cells treated with increasing concentrations of NSC80997 or the ketone reduced derivative (NSC80997-KR). VVA binding was measured by flow cytometry and is presented as average MFI ± SEM from three independent experiments. ***P < 0.0001, **P < 0,005 (t-test).
Fig. 4
Fig. 4. NSC80997 and NSC255112 globally remodel cellular glycosylation.
a, b N-glycan analysis of an erythropoietin (EPO) reporter by western blot and MALDI-TOF analysis. a Western blot analysis of erythropoietin N-glycosylation reporter secreted by CHOWT cells treated 24 h with 0–10 µM NSC80997 or NSC255112 detected by staining with anti-6xHis-tag antibody. b MALDI-TOF profiling of PNGaseF released N-glycans from erythropoietin reporter secreted by HEKWT cells treated with 10 µM NSC80997 or DMSO control. c Coomassie gel staining analysis of a glycosaminoglycan (GAG) serglycin reporter protein secreted by CHOWT cells treated for 24 h with 10 µM of NSC80997, NSC255112 or DMSO control. d Proteomic analysis of E-cadherin tryptic digest purified from DMSO (TMT-129C channel) or NSC80997 (TMT-130N channel) treated HEKWT cells. Box and whisker plot depicts Log2(DMSO/NSC80997) ratio distributions of identified PSMS from non-glycosylated (naked) peptides and O-Man glycopeptides. Box plots include a center line (median), box limits (upper and lower quartiles), whiskers (10th−90th percentile). Source data is provided as a source file. Glycans are drawn according to the SNFG nomenclature.
Fig. 5
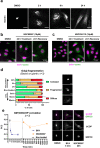
Fig. 5. NSC80997 and NSC255112 trigger reversible Golgi fragmentation.
HeLaWT cells were treated with 10 µM NSC80997, NSC255112 or Brefeldin A and processed for immunofluorescence. ac HeLa cells were imaged by confocal microscopy to reveal the morphology of the Golgi apparatus (giantin, green) and the nuclei (DAPI, magenta). a Time course of Golgi fragmentation during treatment with NSC80997. Scale bars represent 10 µm. b, c After treatment for 24 h with either NSC80997 (b) or NSC255112 (c), cells were washed with fresh medium and incubated for another 24 hrs without inhibitor. Scale bar represents 20 µm. d Bar plot shows percentage of HeLaWT cells displaying compact, fragmented or diffuse Golgi morphologies at different timepoints during treatment with NSC80997. Data is presented as mean + SEM from three independent experiments with 62–109 cells/experiment. Example images depicting compact, fragmented or diffuse Golgi morphologies are shown. Scale bars represent 10 µm. e Line graph depicts Pearson’s correlation coefficient of bCOP (magenta) versus cis-Golgi marker GM130 (green) at different timepoints during treatment with NSC80997 or Brefeldin A. Images were acquired as Z-stacks using spinning-disk microscopy and data is presented as mean ± SEM from three independent experiments with 10-15 cells/experiment. Representative images of co-localization are shown. Scale bars represent 10 µm.
Fig. 6
Fig. 6. NSC80997 boosts antibody-dependent cellular cytotoxicity (ADCC) of Tn-specific mAbs 6C5 and 5E5.
a Cell surface binding of mAbs 5E5 (top) and 6C5 (bottom) to HEKWT, HEKKO FXYD5 cells, and HEKWT cells stably expressing membrane MUC1 reporter protein (HEKMUC1) treated with increasing concentrations of NSC80997 for 24 h. Antibody binding was measured by flow cytometry and data is shown as mean MFI ± SEM (arbitrary units) of three independent experiments. b Schematic illustration of ADCC assay. HEKMUC1 cells were treated with 10 µM NSC80997 or DMSO for 4 h, washed, and re-seeded. Monoclonal antibodies directed against Tn-MUC1 (5E5) and Tn-FXYD5 (6C5) were added to the HEK cells 20 min prior to addition of CFSE-labeled peripheral blood lymphocytes (PBLs) at 5:1, 10:1, and 20:1 effector to target (E:T) ratios. Isotype (mouse IgG) treated cells served as control. After overnight incubation, all cells were harvested and labeled with viability dye and analyzed by flow cytometry. c Bar diagrams show percentage lysis normalized to isotype control, of DMSO or NSC80997 treated HEKMUC1 cells induced by 5E5 (top) or HEKWT cells induced by 6C5 (bottom) mAbs. Data is presented as mean percentage lysis compared to control ± SEM from 3 independent experiments. *P < 0.05 (t-test).
Fig. 7
Fig. 7. Reduction of cellular heparan sulfate by NSC80997 treatment inhibits binding and entry of SARS-CoV-2.
a Cell surface binding of recombinant SARS-CoV-2 spike protein to Vero-E6 (left) and A549 (right) cells treated with increasing concentrations of NSC80997 or DMSO control for 24 h or after heparinase treatment (HSase). Binding was assessed by flow cytometry and is presented as mean fluorescence intensity (MFI) ± SEM (arbitrary units) from 3 independent experiments. ***P < 0.0001 (ANOVA). b Infection of NSC80997 or control-treated Vero-E6 cells with SARS-CoV-2 S protein pseudotyped virus expressing luciferase. Infection was measured by the addition of Bright-Glo and detection of luminescence. Data is presented as mean relative light units (RLU) ± SEM from 3 independent experiments. ***P < 0.0001 (ANOVA). c Relative infection of SARS-CoV-2 (strain USA-WA1/2020) (left) and percent viable cells (right) in Vero-TMPRSS2, Caco-2, and Huh7.5 cells treated with increasing concentrations of NSC80997 or DMSO control. Infection was monitored by immunofluorescence using antibodies against SARS-CoV-2 nucleocapsid protein after 24 h pre-treatment with NSC80997 and 18 h exposure to virus with continued NSC80997 treatment. Cell viability was measured by Sytox Green nuclear stain. The experiments were performed in duplicate twice. The average values from each experiment were used to calculate the IC50 values and are shown as relative infection and cell counts compared to control, respectively. Non-linear fit curve is shown.

Similar articles

Cited by

References

    1. Smith BAH, Bertozzi CR. The clinical impact of glycobiology: targeting selectins, siglecs and mammalian glycans. Nat. Rev. Drug Discov. 2021;20:217–243. doi: 10.1038/s41573-020-00093-1. - DOI - PMC - PubMed
    1. Esko, J. D., Bertozzi, C. & Schnaar, R. L. in Essentials of Glycobiology (eds Varki, A. et al.) 701–712 (Cold Spring Harbor Laboratory Press, 2015). - PubMed
    1. Costa AF, Campos D, Reis CA, Gomes C. Targeting glycosylation: a new road for cancer drug discovery. Trends Cancer. 2020;6:757–766. doi: 10.1016/j.trecan.2020.04.002. - DOI - PubMed
    1. Dorling PR, Huxtable CR, Colegate SM. Inhibition of lysosomal alpha-mannosidase by swainsonine, an indolizidine alkaloid isolated from Swainsona canescens. Biochem J. 1980;191:649–651. doi: 10.1042/bj1910649. - DOI - PMC - PubMed
    1. Takatsuki A, Arima K, Tamura G. Tunicamycin, a new antibiotic. I. Isolation and characterization of tunicamycin. J. Antibiot. (Tokyo) 1971;24:215–223. doi: 10.7164/antibiotics.24.215. - DOI - PubMed

Publication types