. 2023 Mar 14;56(3):653-668.e5.
doi: 10.1016/j.immuni.2023.01.030. Epub 2023 Feb 17.

HIV rapidly targets a diverse pool of CD4+ T cells to establish productive and latent infections

Affiliations

HIV rapidly targets a diverse pool of CD4+ T cells to establish productive and latent infections

Pierre Gantner et al. Immunity. .

Abstract

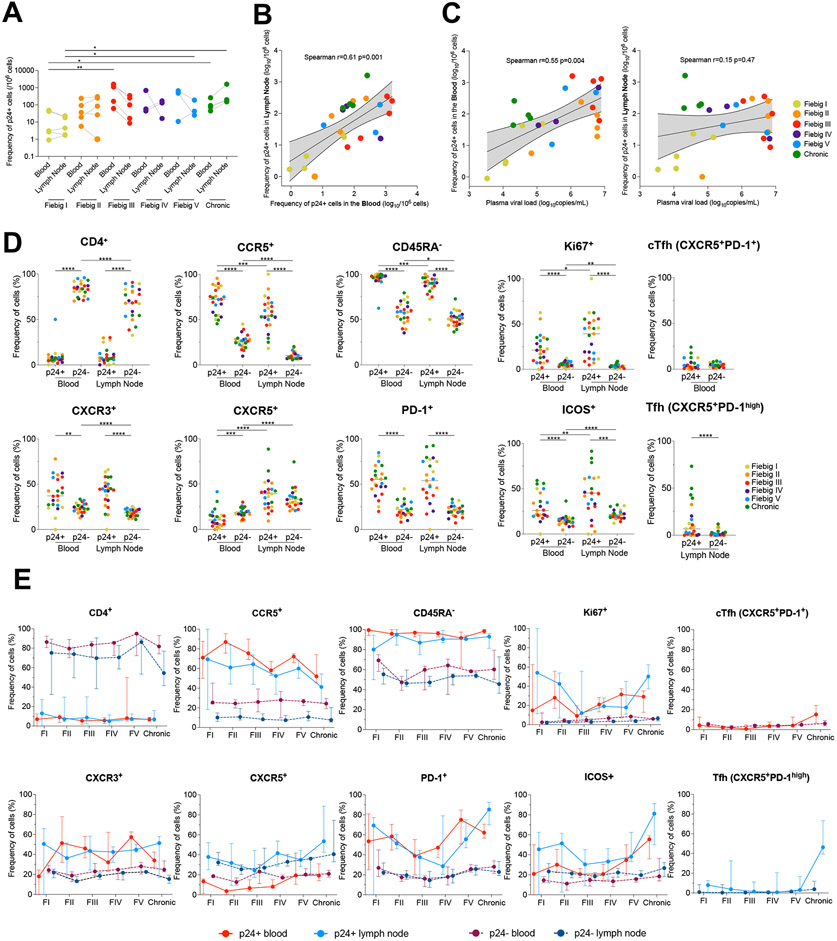
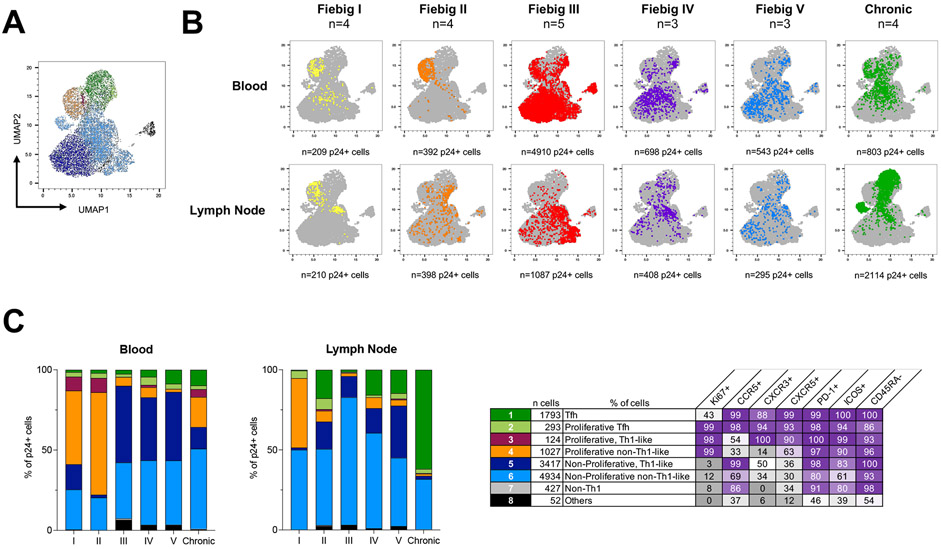
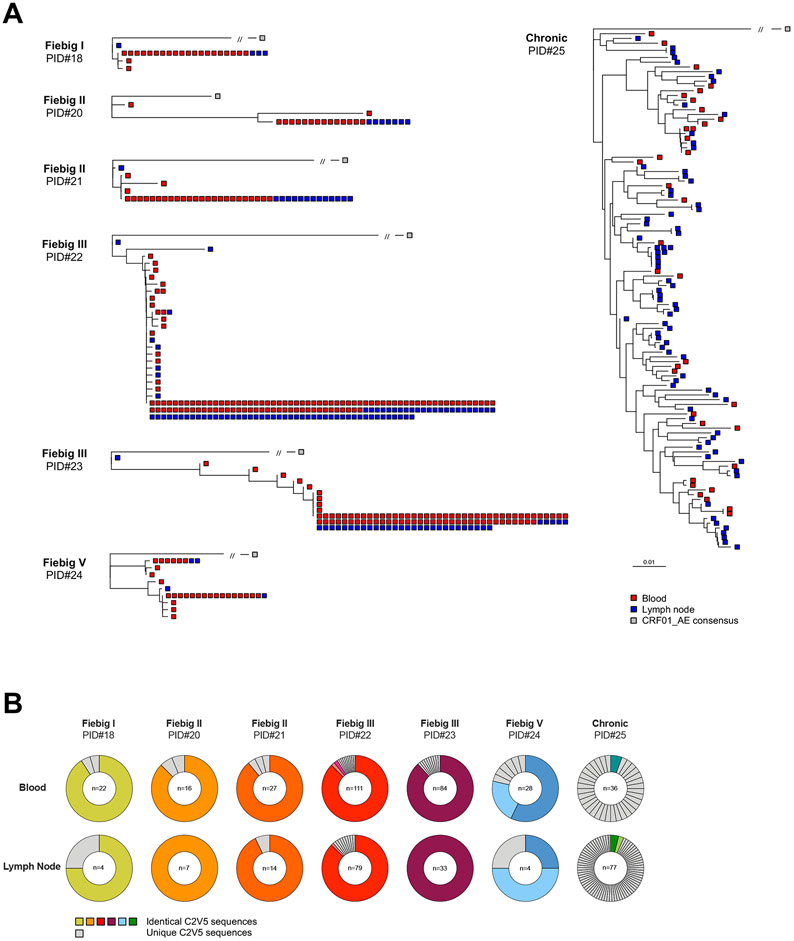
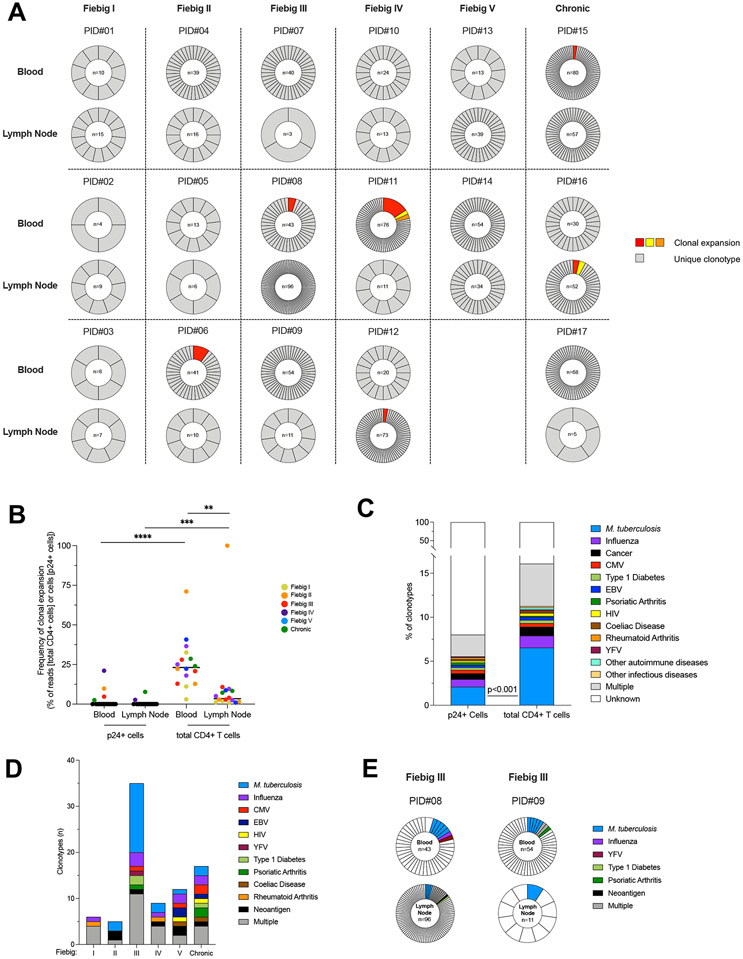
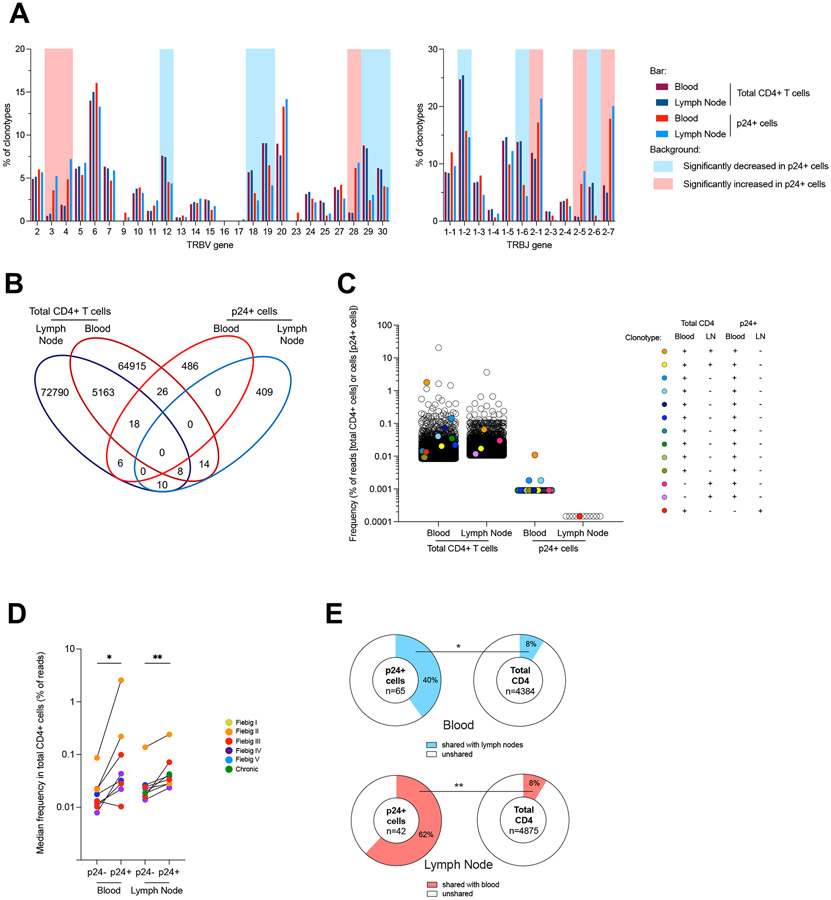
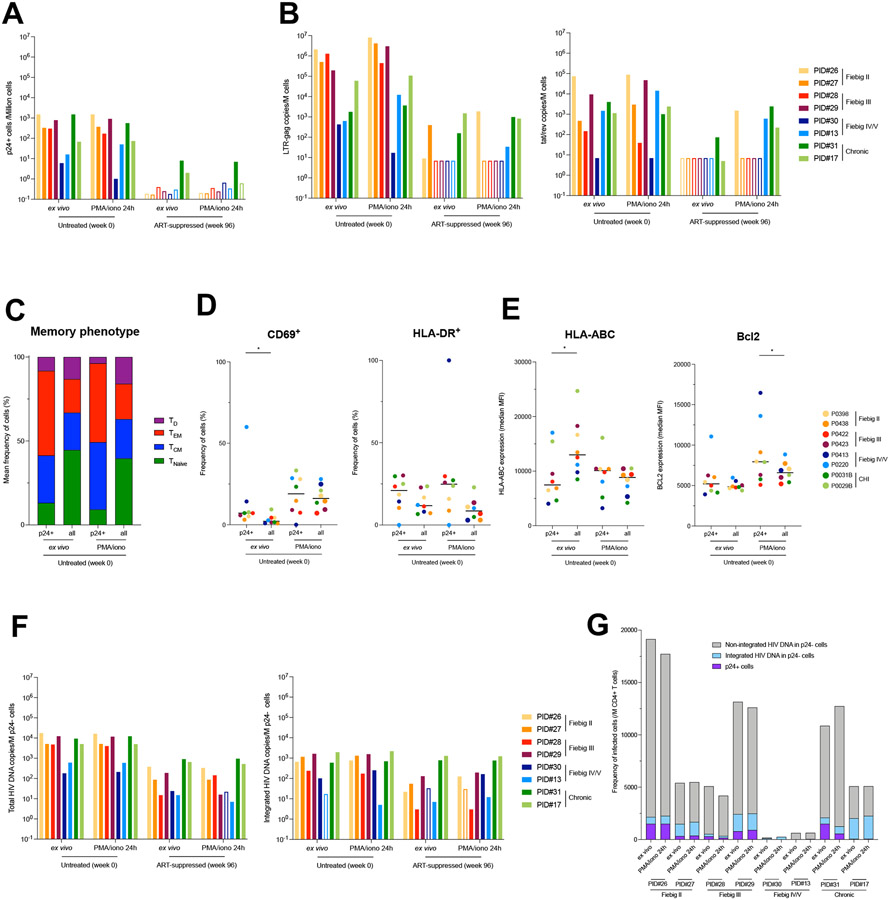
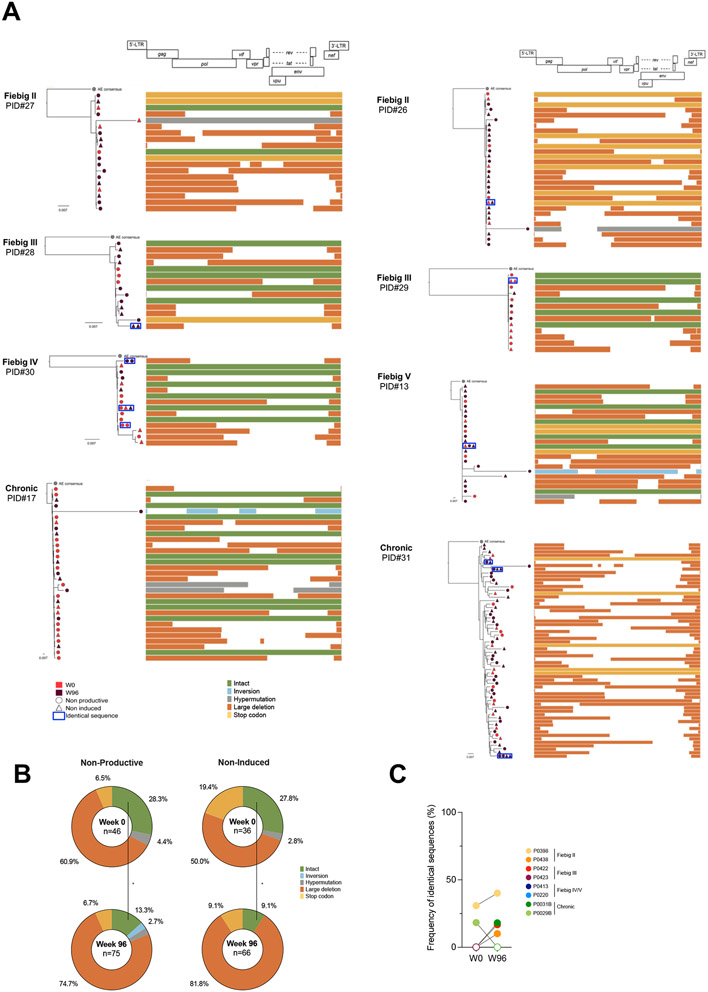
Upon infection, HIV disseminates throughout the human body within 1-2 weeks. However, its early cellular targets remain poorly characterized. We used a single-cell approach to retrieve the phenotype and TCR sequence of infected cells in blood and lymphoid tissue from individuals at the earliest stages of HIV infection. HIV initially targeted a few proliferating memory CD4+ T cells displaying high surface expression of CCR5. The phenotype of productively infected cells differed by Fiebig stage and between blood and lymph nodes. The TCR repertoire of productively infected cells was heavily biased, with preferential infection of previously expanded and disseminated clones, but composed almost exclusively of unique clonotypes, indicating that they were the product of independent infection events. Latent genetically intact proviruses were already archived early in infection. Hence, productive infection is initially established in a pool of phenotypically and clonotypically distinct T cells, and latently infected cells are generated simultaneously.

Keywords: HIV; HIV reservoir; acute infection; clonal expansion; inducibility; latency; lymph nodes; memory CD4(+) T cells; productive infection; proliferation.


Conflict of interest statement

Declaration of interests The authors declare no competing interests.

Figures

Fig. 1.
Fig. 1.. The phenotype of productively infected cells differs between blood and lymph nodes and changes over time.
A. Frequencies of p24+ cells in CD4+ T cells measured by HIV-Flow in paired blood and lymph node samples from participants at different Fiebig stages of acute infection and in chronically infected controls. B. Correlation between p24+ cells frequencies in blood and lymph nodes. C. Correlations between p24+ cells frequencies in blood or lymph nodes with plasma viremia. D. Phenotype of productively infected cells. Frequencies of p24+ and p24 cells from blood and lymph node expressing each marker or combination of markers (CD4, CCR5+, CD45RA, Ki67+, CXCR3+, CXCR5+, PD-1+, ICOS+, circulating T follicular helpers (cTfh) cells and Tfh cells) are depicted for each participant (n=23). E. The frequency of p24+ (solid lines) and p24 (dotted lines) cells from blood (red) and lymph node (blue) expressing each marker or combination of markers (CD4+, CCR5+, CD45RA, Ki67+, CXCR3+, CXCR5+, PD-1+, ICOS+, circulating T follicular helpers (cTfh) cells and Tfh cells) is depicted for each Fiebig stage (I to V and Chronic infection). Median values are plotted with 95% CI.
Fig. 2.
Fig. 2.. Temporal changes in the cell subsets contributing to viral production during HIV infection.
A. p24+ cells phenotypic data were integrated in a UMAP analysis and generated 8 cell clusters. B. Dot plots of the UMAP analysis of all p24+ cells (in grey) as shown in panel A, on which the p24+ cells by stage of infection and compartment are overlaid in colors. Numbers of samples analyzed are indicated at the top of the dot plots. C. The frequency of each of these clusters among p24+ cells is depicted in bar graphs according to the stage of infection for both blood and lymph node. Numbers of samples analyzed are as in B. The table shows the phenotype of each cell cluster. Statistically significant differences are highlighted (Wilcoxon; p<0.05, *; p<0.01**; p<0.001, ***; p<0.0001 ****).
Fig. 3.
Fig. 3.. Proviral diversity is low in productively infected cells during acute HIV infection.
A. Phylogenetic trees representing HIV C2-V5 env proviral sequences obtained from single-sorted p24+ cells from n=7 participants (PID#18 to #25). Trees were rooted on a CRF01_AE consensus (grey square) and env sequences from each single p24+ cell are depicted in red or blue according to their compartments (blood or lymph node, respectively). Identical sequences are shown as aggregated on the same branch of the tree. B. Pie charts representing the relative proportion of each C2V5 env sequence for each participant in both blood and lymph node. The number of p24+ cells analyzed is indicated in the center of the pie. Identical sequences are depicted in colors, whereas unique sequences are depicted in grey.
Fig. 4.
Fig. 4.. Productive HIV infection is established in clonotypically distinct T cells since the earliest stages of HIV infection.
A. Frequencies of TCRβ clonotypes in p24+ cells are represented for n=17 participants (PID#01 to #17) and ordered according to the stage of acute infection (Fiebig I to V) followed by chronic controls (columns) and according to the compartment (i.e. blood and lymph node, rows). For each sample, the proportion of each clonotype in the pool of p24+ cells is represented in a pie chart. The number of p24+ cells analyzed is indicated in the center of the pie. Expanded clonotypes are depicted in colors; Unique clonotypes are depicted in grey. B. The proportion of clonal expansions in the pool of p24+ or total CD4+ T cells is depicted for each participant. Frequencies were calculated as follows: (1) for p24+ cells, the proportion of expanded cells within the pool of p24+ cells; and (2) for total CD4+ T cells, the number of reads of expanded cells within the total number of reads in CD4+ T cells. C. The frequency of predicted antigen specificities is represented in the pool of p24+ or total CD4+ T clonotypes recovered from 17 participants. The frequency of M. tuberculosis specific clonotypes was lower in p24+ cells than in total CD4+ T cells (Fisher’s exact Test; p<0.001). D. The number of predicted antigen specificities for p24+ clonotypes is represented according to the stage of infection (n=34 samples). E. Example of two participants who harbored distinct p24+ clonotypes with common antigenicity (M. tuberculosis). Significant differences are highlighted (Wilcoxon; p<0.05, *; p<0.01**; p<0.001, ***; p<0.0001 ****).
Fig. 5.
Fig. 5.. Productive HIV infection is preferentially established in previously expanded and disseminated clonotypes.
A. Frequency of TRBV and TRBJ segment usage for the clonotypes identified by TCRβ sequencing in p24+ cells and in total CD4+ cells in both blood and lymph nodes from 17 participants. Significant differences between p24+ and total CD4+ T cells are highlighted with a red or blue background depending on the trend (see Fig. S6c). B. Venn diagrams showing the number of unique and shared clonotypes in the four subsets: blood and lymph node total CD4+ T cells and p24+ cells for all participants C. Example (Participant PID#11, data from other participants are shown in Fig. S7d) of frequency distribution (based on bulk deep sequencing data and single-cell sorting/Sanger sequencing) of the clonotypes corresponding to the clones that were found in a single subset (empty circles) and in multiple subsets including p24+ cells (colored circles). Frequencies are shown as percentage of total reads for total CD4+ T cells and as the frequency of cells determined by HIV-Flow for p24+ cells. D. Median frequency of reads of CD4+ T cells clonotypes from blood and lymph node in which p24+ cells were identified (p24+) or not (p24) (data from n=9 participants with at least n=3 p24+ clonotypes shared with blood or lymph nodes are shown). E. Pie charts representing the median frequency of p24+ cells and total CD4+ T cells clonotypes from a given compartment (blood or lymph node) that were shared with the other compartment (lymph node or blood), respectively (data from n=9 participants). The total number of cells (p24+ cells) and median number of reads (total CD4+ T cells) per condition is indicated at the center of the pie. Significant differences are highlighted (Wilcoxon or Fisher’s exact test; p<0.05, *; p<0.01**; p<0.001, ***; p<0.0001 ****).
Fig. 6.
Fig. 6.. Limited inducibility of HIV genomes archived during acute infection and persisting on ART.
A. Frequency of p24+ cells measured by HIV-Flow in longitudinal blood samples of participants enrolled at different Fiebig stages (week 0) and after 96 weeks of ART. Frequencies were measured ex vivo to detect productively infected cells and after stimulation with PMA/ionomycin for 24h to detect the inducible reservoir. B. Total RNA from unstimulated or stimulated CD4+ T cells was used to quantify unspliced (LTR-gag) and multiply spliced RNA (tat/rev). HIV transcripts were normalized to the number of input cells. C. Proportion of each memory subset in p24+ cells and total CD4+ T cells at the viremic and on ART time points, both ex vivo or after stimulation with PMA/ionomycin (n = 16 samples). Infected cells were overrepresented in the TEM subset. D. Activation status of infected cells. The frequency of each subset (CD69+, HLA-DR+) is depicted ex vivo or after stimulation with PMA/ionomycin for each participant according to the cell population (p24+ and total CD4+ T cells). E. Phenotype of infected cells. The median fluorescence intensity (MFI) for each marker (HLA-ABC, Bcl2) is depicted ex vivo or after stimulation with PMA/ionomycin for each participant according to the cell population (p24+ and total CD4+ T cells). F. p24 cells were bulk sorted for total (LTR-gag) and integrated (alu/LTR-gag) HIV DNA quantification. Frequency of HIV DNA+ cells are presented in bar charts. Empty bars represent undetectable measures, and the limit of detection is plotted. G. Frequencies of CD4+ T cells harboring unintegrated HIV DNA, integrated HIV DNA and producing p24 proteins during untreated HIV infection. Integrated HIV DNA was measured by alu/LTR-gag PCR. Unintegrated HIV DNA was evaluated by subtracting the measure of integrated HIV DNA from the measure of total HIV DNA. Frequencies of p24+ cells were measured by HIV-Flow. All samples from participants from whom NFL HIV genome sequences were obtained are shown. For each sample, measures performed ex vivo and after 24h stimulation with PMA/ionomycin are represented.
Fig. 7.
Fig. 7.. Intact and non-inducible proviruses are established during acute infection and persist on ART.
A. Near-full length genome amplification was performed in p24 cells to assess the intactness of latent genomes. To assess the inducibility of these proviruses, p24 cells from both the ex vivo and stimulation conditions were included (n=8 participants). Phylogenetic trees representing the proviral landscape of five participants are depicted. Sequences obtained before (week 0, red) and during suppressive ART time point (week 96, burgundy) are included; Sequences obtained from p24 cells sorted directly ex vivo (circle) or after stimulation (triangle), representing the non-productive and the non-induced latent HIV reservoirs, respectively, are also included. Identical sequences are framed and represented on the same tree branch. On the right of the graph, proviral sequences are mapped to the HIV genome, and color-coded as follows: intact sequences in green, inversions in blue, hypermutations in grey, large deletions in orange and stop codons in yellow. B. Pie charts summarizing the frequency of defects and intact proviruses obtained from p24 cells sorted ex vivo (non-productive) and after stimulation (non-induced) before (week 0, n=8) and after ART initiation (week 96, n =8). The total number of sequences per condition is indicated at the center of the pie (sequence color categories are as in A.). C. The frequency of identical proviral sequences before and after ART in p24- cells is represented for each participant. Significant differences are highlighted (Wilcoxon or Fisher’s exact test; p<0.05, *; p<0.01**; p<0.001, ***; p<0.0001 ****).

Comment in

  • HIV establishes an early foothold.
    Moran JA, Marsden MD. Moran JA, et al. Cell Host Microbe. 2023 Apr 12;31(4):571-573. doi: 10.1016/j.chom.2023.03.012. Cell Host Microbe. 2023. PMID: 37054675

Similar articles

Cited by

References

    1. Barre-Sinoussi F, Chermann JC, Rey F, Nugeyre MT, Chamaret S, Gruest J, Dauguet C, Axler-Blin C, Vezinet-Brun F, Rouzioux C, et al. (1983). Isolation of a T-lymphotropic retrovirus from a patient at risk for acquired immune deficiency syndrome (AIDS). Science 220, 868–871. 10.1126/science.6189183. - DOI - PubMed
    1. Whitney JB, Hill AL, Sanisetty S, Penaloza-MacMaster P, Liu J, Shetty M, Parenteau L, Cabral C, Shields J, Blackmore S, et al. (2014). Rapid seeding of the viral reservoir prior to SIV viraemia in rhesus monkeys. Nature 512, 74–77. 10.1038/nature13594. - DOI - PMC - PubMed
    1. Miller CJ, Li Q, Abel K, Kim EY, Ma ZM, Wietgrefe S, La Franco-Scheuch L, Compton L, Duan L, Shore MD, et al. (2005). Propagation and dissemination of infection after vaginal transmission of simian immunodeficiency virus. J Virol 79, 9217–9227. 10.1128/JVI.79.14.9217-9227.2005. - DOI - PMC - PubMed
    1. Zhang ZQ, Wietgrefe SW, Li Q, Shore MD, Duan L, Reilly C, Lifson JD, and Haase AT (2004). Roles of substrate availability and infection of resting and activated CD4+ T cells in transmission and acute simian immunodeficiency virus infection. Proc Natl Acad Sci U S A 101, 5640–5645. 10.1073/pnas.0308425101. - DOI - PMC - PubMed
    1. Gordon SN, Klatt NR, Bosinger SE, Brenchley JM, Milush JM, Engram JC, Dunham RM, Paiardini M, Klucking S, Danesh A, et al. (2007). Severe depletion of mucosal CD4+ T cells in AIDS-free simian immunodeficiency virus-infected sooty mangabeys. J Immunol 179, 3026–3034. 10.4049/jimmunol.179.5.3026. - DOI - PMC - PubMed

Publication types

Substances