. 2023 Apr 11;56(4):768-782.e9.
doi: 10.1016/j.immuni.2023.01.027. Epub 2023 Feb 17.

Non-canonical pattern recognition of a pathogen-derived metabolite by a nuclear hormone receptor identifies virulent bacteria in C. elegans

Affiliations

Non-canonical pattern recognition of a pathogen-derived metabolite by a nuclear hormone receptor identifies virulent bacteria in C. elegans

Nicholas D Peterson et al. Immunity. .

Abstract

Distinguishing infectious pathogens from harmless microorganisms is essential for animal health. The mechanisms used to identify infectious microbes are not fully understood, particularly in metazoan hosts that eat bacteria as their food source. Here, we characterized a non-canonical pattern-recognition system in Caenorhabditis elegans (C. elegans) that assesses the relative threat of virulent Pseudomonas aeruginosa (P. aeruginosa) to activate innate immunity. We discovered that the innate immune response in C. elegans was triggered by phenazine-1-carboxamide (PCN), a toxic metabolite produced by pathogenic strains of P. aeruginosa. We identified the nuclear hormone receptor NHR-86/HNF4 as the PCN sensor in C. elegans and validated that PCN bound to the ligand-binding domain of NHR-86/HNF4. Activation of NHR-86/HNF4 by PCN directly engaged a transcriptional program in intestinal epithelial cells that protected against P. aeruginosa. Thus, a bacterial metabolite is a pattern of pathogenesis surveilled by nematodes to identify a pathogen in its bacterial diet.

Keywords: Caenorhabditis elegans; Pseudomonas aeruginosa; host-pathogen interactions; innate immunity; intestinal epithelial cells; nuclear hormone receptor; pathogen sensing; pattern recognition receptor; patterns of pathogenesis; phenazines.


Conflict of interest statement

Declaration of interests The authors declare no competing interests.

Figures

Figure 1.
Figure 1.. The pathogen-derived metabolite phenazine-1-carboxamide (PCN) activates anti-pathogen defenses in the C. elegans intestine.
(A) Images of C. elegans irg-4p∷gfp transcriptional reporter expression in animals either uninfected or infected with the indicated P. aeruginosa strains, (scale bar, 200 μM). (B) Heat map of the 27 genes that are induced in C. elegans during P. aeruginosa infection in a manner dependent on the production of phenazines (q<0.05). Gene expression from biological replicates in each condition were scaled by calculating the row z-score for each gene (n=3). See also Table S1A. (C) A schematic of P. aeruginosa phenazine metabolism (PCA, phenazine-1-carboxylic acid; PCN, phenazine-1-carboxamide; PYO, pyocyanin; 1-HP, 1-hydroxyphenazine). (D and E) Images of C. elegans irg-4p∷gfp animals during infection with P. aeruginosa Δphz (D) or grown under standard conditions (uninfected) (E) on media that was supplemented with the indicated phenazines, (scale bar, 200 μM). (F) qRT-PCR analysis of the indicated anti-pathogen genes in wild-type animals exposed to the indicated phenazines in the absence of infection. Data are the average of biological replicates with error bars giving SEM (n=4). *equals p<0.05 (Brown-Forsythe and Welch ANOVA with Dunnett’s T3 multiple comparisons test). Concentration of phenazines used in (D), (E) and (F) are 112 μM PCN, 112 μM PCA, 119 μM PYO, and 25 μM 1-HP. (G) Images of C. elegans irg-4p∷gfp animals infected with the indicated P. aeruginosa strains. (scale bar, 200 μM). (H) Data from mRNA-sequencing experiments comparing genes differentially regulated in wild-type animals exposed to PCN (y-axis) with genes differentially expressed in wild-type animals during P. aeruginosa infection (x-axis). All genes are shown in gray. Genes that are differentially expressed in both datasets are shown in black (q<0.05), and the differentially expressed genes annotated as anti-pathogen genes (innate immune effector or detoxification genes) are shown in red. The Pearson correlation coefficient (r) between the indicated transcriptional signatures is shown. The location of the genes irg-4, irg-5, cyp-35C1, and ugt-13, whose regulation is examined throughout this manuscript, are shown. See also Table S1B. Source data for this figure is in Table S3. See also Fig. S1.
Figure 2.
Figure 2.. The anti-pathogen transcriptional program induced by PCN requires the C. elegans nuclear hormone receptor nhr-86.
(A and B) Images of C. elegans irg-4p∷gfp (A) and cyp-35C1gfp (B) transcriptional reporters with indicated RNAi conditions either exposed to PCN in the absence of infection or during P. aeruginosa infection, (scale bar, 200 μM). (C) Images of C. elegans irg-4p∷gfp transcriptional reporters with indicated genotypes and conditions, (scale bar, 200 μM). (D-K) qRT-PCR analysis of the indicated innate immune genes in wild-type and NHR-86∷AID animals exposed to either PCN in the absence of infection (n=3) (D-G) or during infection with P. aeruginosa (n=4) (H-K). All conditions are in the presence of auxin. Data are the mean of biological replicates with error bars giving SEM. *equals p<0.05 (two-way ANOVA with Tukey’s multiple comparisons test) (L) Data from mRNA-sequencing experiments comparing genes differentially regulated in nhr-86(RNAi) versus control RNAi-treated animals exposed to PCN (y-axis) are compared with genes differentially expressed in wild-type animals exposed to PCN (x-axis). All genes are shown in gray. Genes that are differentially expressed in both datasets are shown in black (q<0.05), and the differentially expressed genes annotated as anti-pathogen genes (innate immune effector or detoxification genes) are shown in red. The Pearson correlation coefficient (r) between the indicated transcriptional signatures is shown. The location of the genes irg-4, irg-5, cyp-35C1, and ugt-13, whose regulation is examined throughout this manuscript, are shown. (n=3) See also Table S1C. (M-R) ChIP-qPCR analysis of NHR-86 binding to the indicated DNA regions in wild-type and NHR-86∷GFP animals exposed to solvent control or PCN. Protein-DNA complexes were immunoprecipitated with a α-GFP antibody. Data are the mean of biological replicates with error bars giving SEM (n=3). *equals p<0.05 (two-way ANOVA with Tukey’s multiple comparisons test). Source data for this figure is in Table S3. See also Fig. S2.
Figure 3.
Figure 3.. The bacterial metabolite PCN and synthetic immunostimulatory molecule R24 bind to the ligand-binding domain of NHR-86.
(A and B) Intrinsic tryptophan fluorescence intensity of the purified ligand-binding domain (LBD) of NHR-86 treated with the indicated concentrations of PCN (A), PCA (A), and R24 (B), each normalized to the solvent control-treated samples. Curves represent a non-linear regression fit of the scaled fluorescence intensity data points for each condition. An equilibrium dissociation constant (Kd) and goodness of fit calculation (R2) are shown for each curve. Data in (A) and (B) are the average of biological replicate samples (n=3) with error bars giving SEM. SDS-PAGE analysis of purified NHR(LBD) is shown in Fig. S3A. (C) A representative immunoblot of a cellular thermal shift assay (CETSA) experiment using an anti-FLAG antibody that probed whole cell lysates from a transgenic C. elegans strain in which NHR-86 was tagged with 3xFLAG at its endogenous locus. (D) A representative densitometric quantification from a CETSA experiment that characterized the interaction of PCN (400–500 μM) (n=7), PCA (400–500 μM) (n=6), and R24 (70 μM) (n=6) with 3xFLAG∷NHR-86. (E) The area under the curve was quantified from each biological replicate experiment for the experiment described in (D) and normalized to the solvent control condition. All biological replicates for this experiment are shown in Fig. S3B. (F) Quantification of NHR-12∷3xFLAG immunoblot band intensities for each treatment condition and temperature from a representative experiment. (G) The area under the curve was quantified from each biological replicate for the experiment described in (F) and normalized to the solvent control condition (n=3). All biological replicates for this experiment are shown in Fig. S3C. Data in (E) and (G) are the average of all biological replicates with error bars giving SEM. *equals p<0.05 (two-tailed, unpaired t-test with Welch’s correction). The structures of R24, PCN and PCA are show in Fig. S3D. Source data for this figure is in Table S3. See also Fig. S3.
Figure 4.
Figure 4.. The phenylalanine at position 379 of NHR-86 is required for binding of PCN and R24.
(A) In silico molecular modeling of full-length apo NHR-86 as a homodimer. The identified ligand-binding pocket is indicated in red. (B) Average free energy of ligand-binding for PCA, PCN, and R24 calculated using the molecular mechanics/generalized Born surface area (MM/GBSA). See also Supplemental Video S1. (C-F) qRT-PCR analysis of wild-type animals exposed to either solvent control (1% DMSO) or 100 μM R24 or 100 μM PCN. Data are the average of biological replicates (n=3) with error bars giving SEM. *equals p<0.05 (Brown-Forsythe and Welch ANOVA with Dunnett’s multiple comparisons test). (G) An in silico model of PCN bound to the identified binding pocket in the NHR-86(LBD). The interaction of phenylalanine 379 (F379) (cyan) and PCN (white) is shown. (H) A representative immunoblot of a CETSA experiment using an anti-FLAG antibody that probed whole cell lysates from C. elegans 3xFLAG∷NHR-86 and 3xFLAG∷NHR-86F379H strains treated with indicated conditions. (I) A representative densitometric quantification from a CETSA experiment that characterized the interaction of solvent control, PCN, and R24 with 3xFLAG∷NHR-86 and 3xFLAG∷NHR-86F379H (n=3) (J) The area under the curve was quantified from each biological replicate for the experiment described in (I) and normalized to the solvent control condition of 3xFLAG∷NHR-86 (n=3). All biological replicates for this experiment are shown in Fig. S4B. Data are the average of all biological replicates with error bars giving SEM. *equals p<0.05 (two-tailed, unpaired t-test with Welch’s correction). (K) Intrinsic tryptophan fluorescence intensity of the purified ligand-binding domain (LBD) of wild-type NHR-86 and NHR-86 containing the F379H mutation treated with the indicated concentrations of PCN and R24 each normalized to the solvent control-treated samples. Curves represent a non-linear regression fit of the scaled fluorescence intensity data points for each condition. Data are the average of biological replicate samples (n=3) with error bars giving SEM. *equals p<0.05 (unpaired t-test with Welch’s correction) for equilibrium dissociation constant (Kd) between the wild-type NHR-86(LBD) and the NHR-86F379H mutant protein. SDS-PAGE analysis of purified NHR(LBD)F379H is shown in Fig. S3A. (L) Images of indicated C. elegans irg-4p∷gfp animals grown on media that was supplemented with PCN (448 μM) or solvent control, as indicated, (scale bar, 200 μM). (M-P) qRT-PCR analysis of the indicated innate immune genes in wild-type and NHR-86F379H animals exposed to either solvent control or PCN (448 μM) in the absence of infection. Data are the mean of biological replicates (n=3) with error bars giving SEM. *equals p<0.05 (two-way ANOVA with Tukey’s multiple comparisons test). Source data for this figure is in Table S3. See also Fig. S4.
Figure 5.
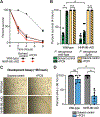
Figure 5.. The bacterial metabolite PCN is a pattern of pathogenesis sensed by C. elegans NHR-86 to activate innate immunity.
(A) A phenazine toxicity assay in C. elegans (also called the “fast kill” assay) with P. aeruginosa and C. elegans of the indicted genotypes either treated with solvent control or PCN (448 μM). Data are representative of three trials. The difference between PCN-treated wild-type and NHR-86∷AID animals is significant (p<0.05, log-rank test, n=3). Survival curves for these strains exposed to the P. aeruginosa Δphz mutant are shown in Fig. S5A. Sample sizes, four-hour survival, and p-values for each replicate are shown in Table S2. (B) Survival data at four hours after exposure to the indicated conditions is shown for the experiment described in (A). Data are the average of three biological replicates each containing three trials with error bars showing SEM (n=9). *equals p<0.05 (two-way ANOVA with Tukey’s multiple comparisons test). Sample sizes, four-hour survival, and p-values for each replicate are shown in Table S2. (C and D) A development assay with wild-type and NHR-86∷AID C. elegans. Animals of the indicated genotypes were allowed to lay their brood in the presence or absence of PCN, as indicated, and (C) photographed after approximately 96 hours or (D) scored for the number of alive animals (n=5). All assay plates contained 50 μM auxin. *p<0.05 for the indicated comparisons (two-way ANOVA with Šídák’s multiple comparisons test). n.s.=not significant. Source data for this figure is in Table S3. See also Fig. S5.
Figure 6.
Figure 6.. C. elegans sense PCN to assess the relative threat of virulent P. aeruginosa, but not other pathogenic bacteria.
(A-C) HPLC-UV spectroscopy was used to quantify the individual phenazines in the indicated P. aeruginosa strains. (A) PCN production was compared to PCA production in biological replicates of the indicated P. aeruginosa strains (n=3). See Fig. S6 for the comparison of PCN production with 1-HP (Fig. S6A) and PYO (Fig. S6B) in these strains. (B) PCN production was compared to the pathogenicity of P. aeruginosa towards C. elegans in the phenazine toxicity assay, as quantified by percent nematode survival at four hours. n.d.=PCN was not detected. (C) Liquid chromatography-UV chromatograms of P. aeruginosa PA14 or PAO1 strains that express pqsE in multicopy (pqsE) or a control plasmid (vector control). See Fig. S6 for a comparison of PCA (Fig. S6D) and PCN (Fig. S6E) production in these strains. (D) HPLC-UV spectroscopy data showing the comparison of PCN production versus PCA production in biological replicates of the indicated P. aeruginosa strains. Pearson correlation coefficient (r) is significant (p<0.05, n=3). (E) Images of C. elegans irg-4p∷gfp animals infected with the indicated P. aeruginosa strains, (scale bar, 200 μM). (F) Phenazine toxicity assay with wild-type C. elegans and indicated P. aeruginosa strains. The difference between the PAO1 control vector and pqsE overexpression is significant (p<0.05, log-rank test, n=3). Data is representative of three biological replicates. (G) Survival data at two hours for strains of the indicated genotypes is shown for the experiment described (F). Data are the average of three biologicals replicates each containing three trials with error bars showing SEM (n=9). *equals p<0.05 (two-way ANOVA with Tukey’s multiple comparisons test). Sample sizes, two-hour survival, and p-values for each replicate are shown in Table S2. (H) Comparison of PCN production in the indicated P. aeruginosa genotypes with their pathogenicity toward C. elegans in the phenazine toxicity assay is presented. Pearson correlation coefficient (r) from biological replicates is significant (p<0.05, n=3). See also Table S3 for the HPLC-UV and LC-MS/MS phenazine retention times and abundance for the data shown in (A-D) and (H). (I) Gene set enrichment analysis (GSEA) examining the genes that are differentially regulated in wild-type C. elegans exposed to PCN, as determined by mRNA-seq (See Fig. 1H). Fold change in expression of genes in uninfected animals exposed to PCN are presented in rank order on the x-axis from higher expression (red) to lower expression (blue) and compared to the genes that are induced upon exposure to the indicated pathogens. (J) GSEA normalized enrichment score (NES) and q-value for the comparisons shown in (I). Only the comparison of genes whose transcription changes in the presence of PCN and during P. aeruginosa infection was significant (q<0.05). (K) A similar GSEA as described in (I) except genes whose transcription depend on nhr-86 during PCN treatment (See Fig. 2L) are compared to genes induced upon exposure to the indicated pathogens. (L) GSEA normalized enrichment score (NES) and q-value for the experiment described in (K) are shown. As in (J), only the comparison with genes induced during P. aeruginosa infection was significant (q<0.05). Source data for this figure is in Table S3. See also Fig. S6.

Comment in

Similar articles

Cited by

References

    1. Ausubel FM (2005). Are innate immune signaling pathways in plants and animals conserved? Nat Immunol 6, 973–979. 10.1038/ni1253. - DOI - PubMed
    1. Brennan JJ, and Gilmore TD (2018). Evolutionary Origins of Toll-like Receptor Signaling. Mol Biol Evol 35, 1576–1587. 10.1093/molbev/msy050. - DOI - PubMed
    1. Irazoqui JE, Urbach JM, and Ausubel FM (2010). Evolution of host innate defence: insights from Caenorhabditis elegans and primitive invertebrates. Nat Rev Immunol 10, 47–58. 10.1038/nri2689. - DOI - PMC - PubMed
    1. Kim DH, and Ewbank JJ (2018). Signaling in the innate immune response. WormBook 2018, 1–35. 10.1895/wormbook.1.83.2. - DOI - PMC - PubMed
    1. Pukkila-Worley R, and Ausubel FM (2012). Immune defense mechanisms in the Caenorhabditis elegans intestinal epithelium. Curr Opin Immunol 24, 3–9. 10.1016/j.coi.2011.10.004. - DOI - PMC - PubMed

Publication types

MeSH terms

Substances