. 2023 Feb 20;13(1):2984.
doi: 10.1038/s41598-023-29797-1.

Network evolution of regional brain volumes in young children reflects neurocognitive scores and mother's education

Collaborators, Affiliations

Network evolution of regional brain volumes in young children reflects neurocognitive scores and mother's education

Yidong Zhou et al. Sci Rep. .

Abstract

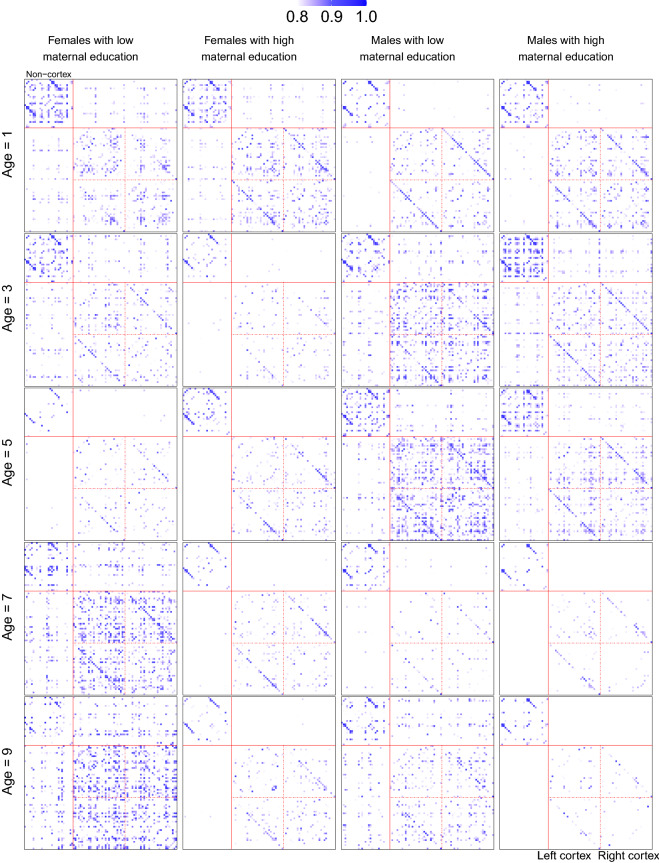
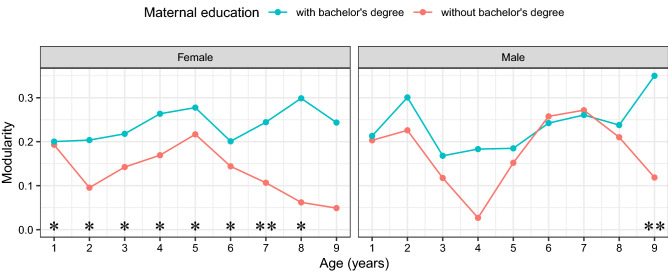
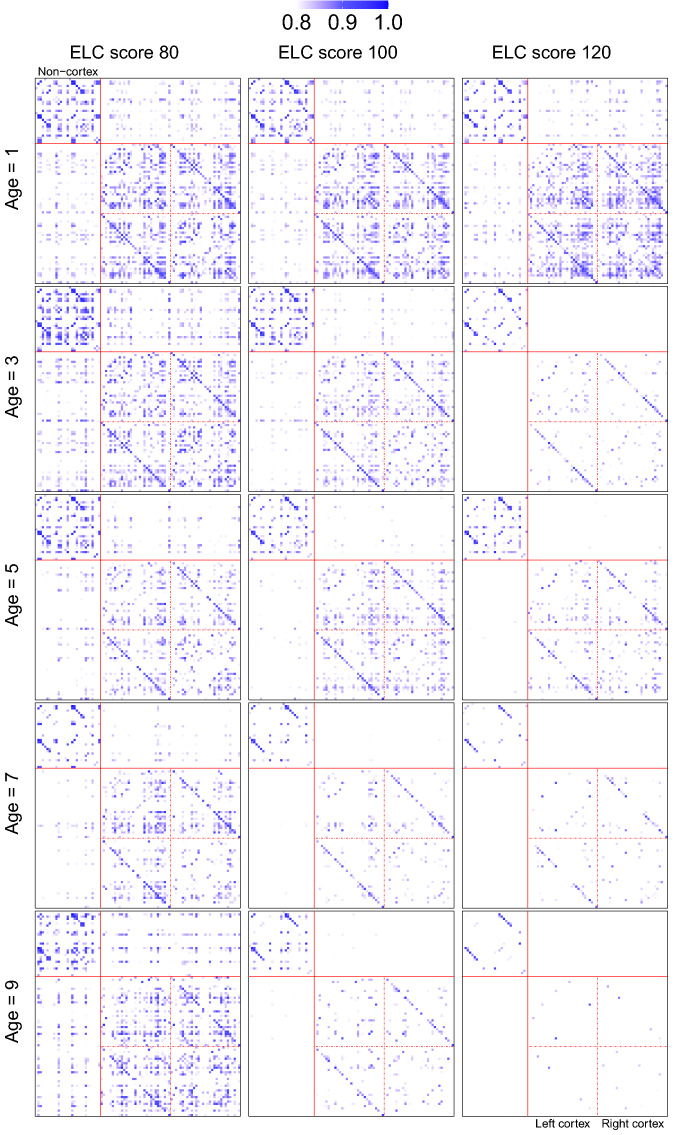
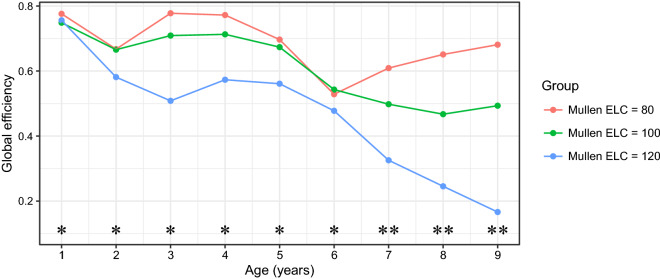
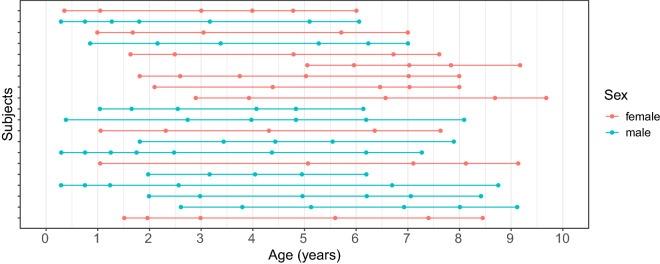
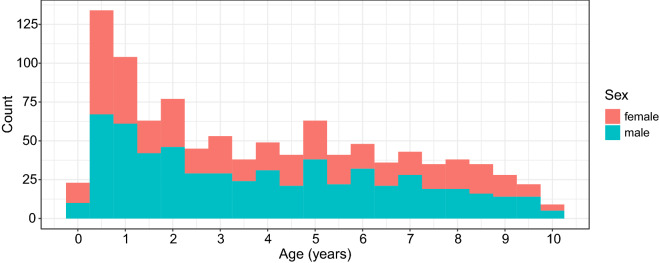
The maturation of regional brain volumes from birth to preadolescence is a critical developmental process that underlies emerging brain structural connectivity and function. Regulated by genes and environment, the coordinated growth of different brain regions plays an important role in cognitive development. Current knowledge about structural network evolution is limited, partly due to the sparse and irregular nature of most longitudinal neuroimaging data. In particular, it is unknown how factors such as mother's education or sex of the child impact the structural network evolution. To address this issue, we propose a method to construct evolving structural networks and study how the evolving connections among brain regions as reflected at the network level are related to maternal education and biological sex of the child and also how they are associated with cognitive development. Our methodology is based on applying local Fréchet regression to longitudinal neuroimaging data acquired from the RESONANCE cohort, a cohort of healthy children (245 females and 309 males) ranging in age from 9 weeks to 10 years. Our findings reveal that sustained highly coordinated volume growth across brain regions is associated with lower maternal education and lower cognitive development. This suggests that higher neurocognitive performance levels in children are associated with increased variability of regional growth patterns as children age.


Conflict of interest statement

The authors declare no competing interests.

Figures

Figure 1
Figure 1
SCNs represented as heatmaps at ages 1, 3, 5, 7, 9 years for the four groups divided by sex and maternal education. Rows from top to bottom correspond to the five ages. Columns from left to right correspond to the four groups: females with low maternal education, females with high maternal education, males with low maternal education, males with high maternal education. The top left block contains the non-cortex regions, while the bottom right contains the left and right cortex regions; see supplementary material S1 for details of ROIs.
Figure 2
Figure 2
Modularity of SCNs at ages 1–9 for the four groups divided by sex and maternal education. Significance of differences is indicated separately for each comparison (*0.05, **0.01).
Figure 3
Figure 3
SCNs represented as heatmaps at ages 1, 3, 5, 7, 9 years for ELC scores 80, 100, and 120. Rows from top to bottom correspond to the five selected ages. Columns from left to right correspond to the three ELC scores. The top left block contains the non-cortex regions, while the bottom right contains the left and right cortex regions; see supplementary material S1 for details of ROIs.
Figure 4
Figure 4
Global efficiency of SCNs at ages 1–9 with one year apart for three different ELC scores 80, 100, 120. Significance of differences is indicated separately for each comparison (*0.05, **0.01).
Figure 5
Figure 5
A longitudinal event plot demonstrating the distribution of ages of visits per child for the 10 females and 10 males with the most visits. Each row corresponds to a child, where dots denote the event times where visits took place.
Figure 6
Figure 6
Histogram for ages at time of visits for the RESONANCE cohort.

Similar articles

Cited by

References

    1. Knickmeyer RC, et al. A structural MRI study of human brain development from birth to 2 years. J. Neurosci. 2008;28:12176–12182. doi: 10.1523/JNEUROSCI.3479-08.2008. - DOI - PMC - PubMed
    1. Bullmore E, Sporns O. Complex brain networks: graph theoretical analysis of structural and functional systems. Nat. Rev. Neurosci. 2009;10:186–198. doi: 10.1038/nrn2575. - DOI - PubMed
    1. Alexander-Bloch A, Giedd JN, Bullmore E. Imaging structural co-variance between human brain regions. Nat. Rev. Neurosci. 2013;14:322–336. doi: 10.1038/nrn3465. - DOI - PMC - PubMed
    1. Gilmore JH, Knickmeyer RC, Gao W. Imaging structural and functional brain development in early childhood. Nat. Rev. Neurosci. 2018;19:123–137. doi: 10.1038/nrn.2018.1. - DOI - PMC - PubMed
    1. Huang H, et al. Development of human brain structural networks through infancy and childhood. Cereb. Cortex. 2015;25:1389–1404. doi: 10.1093/cercor/bht335. - DOI - PMC - PubMed

Publication types