. 2023 Mar 8;8(5):e166848.
doi: 10.1172/jci.insight.166848.

Effect of host factors and COVID-19 infection on the humoral immune repertoire in treated HIV

Affiliations

Effect of host factors and COVID-19 infection on the humoral immune repertoire in treated HIV

Samuel R Schnittman et al. JCI Insight. .

Abstract

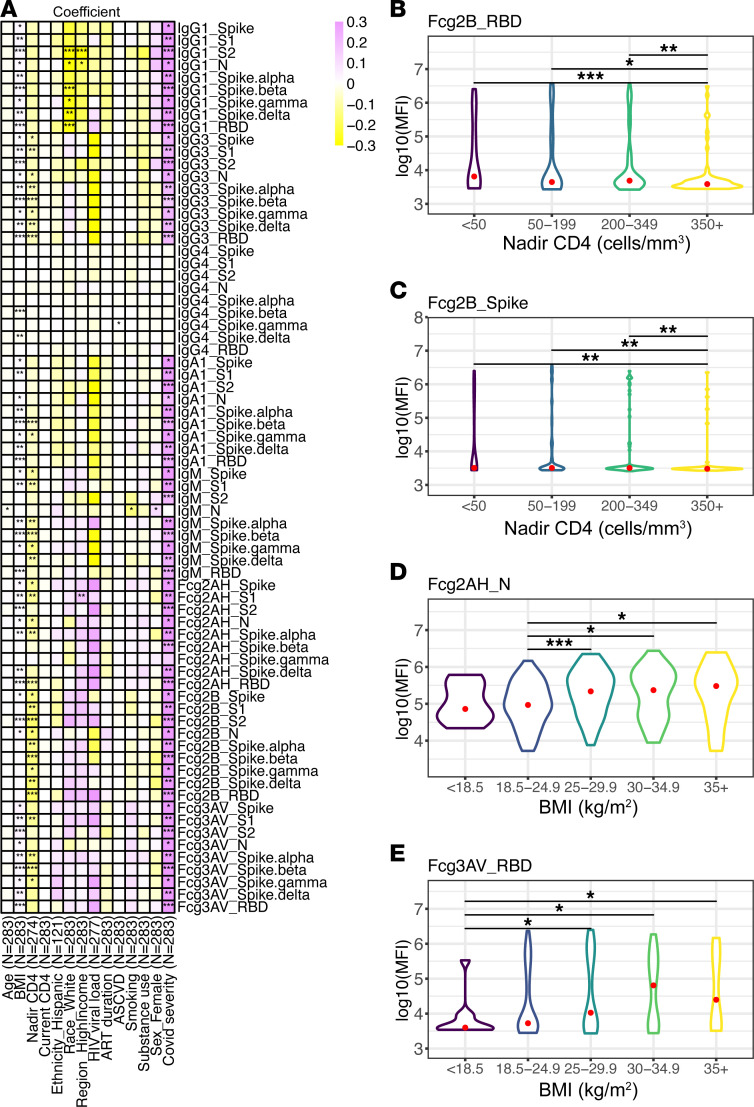
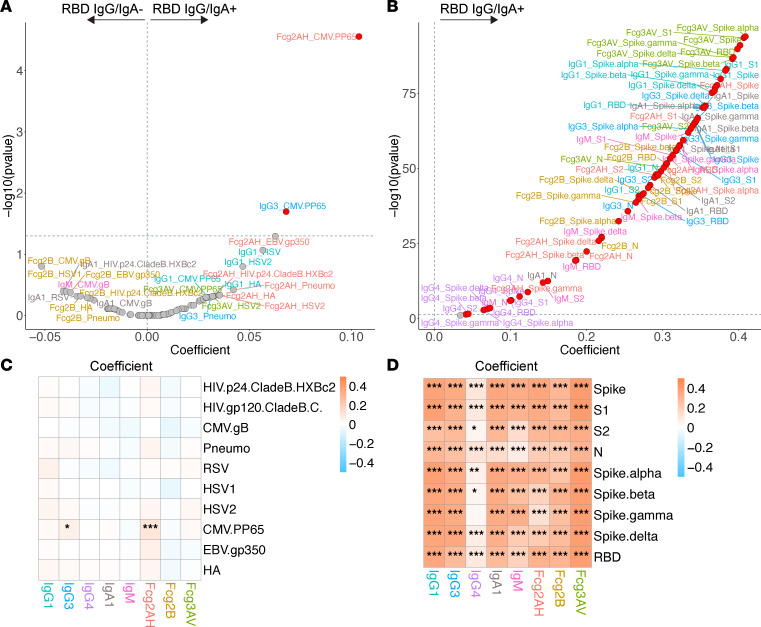
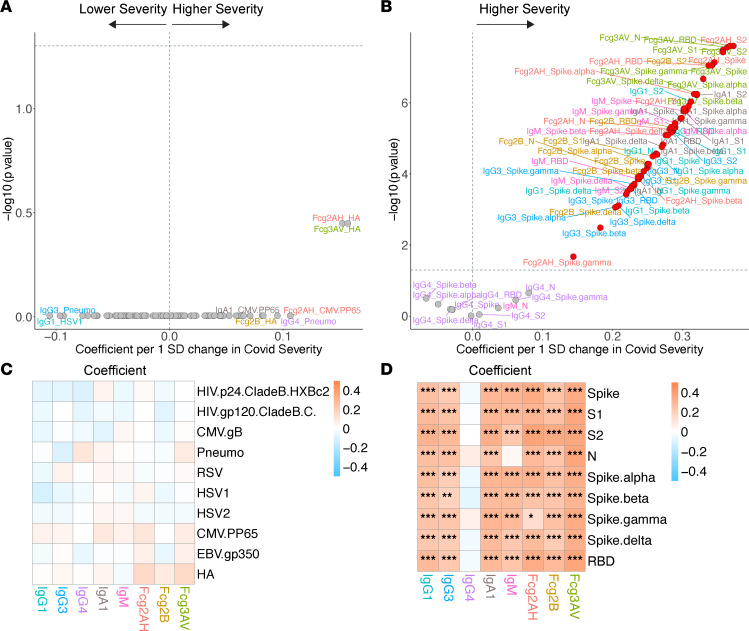
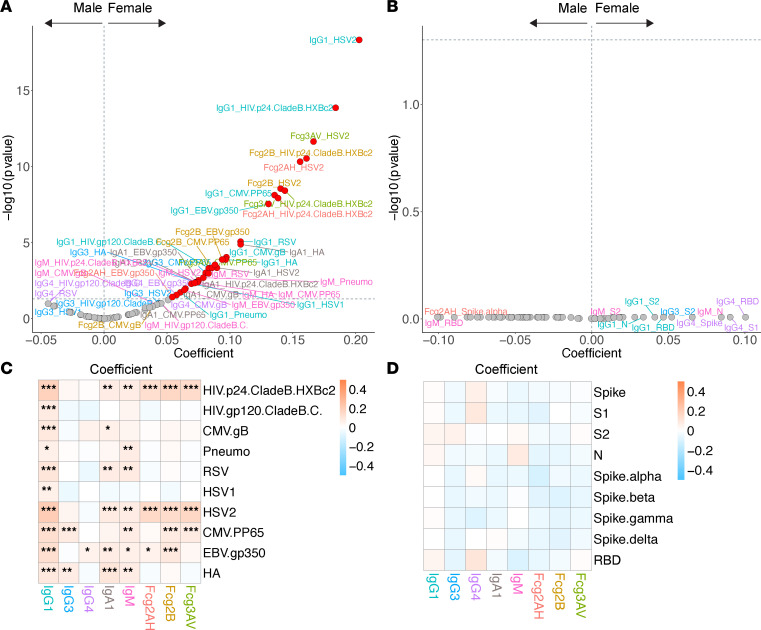
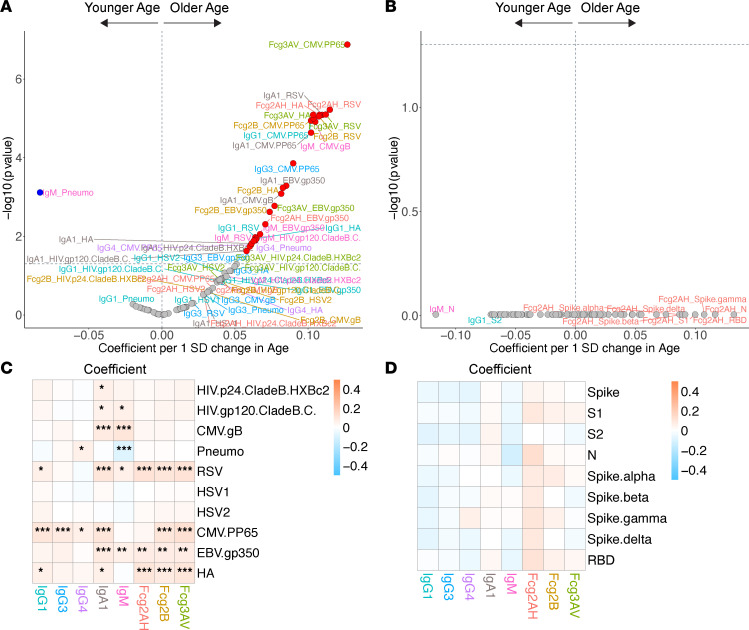
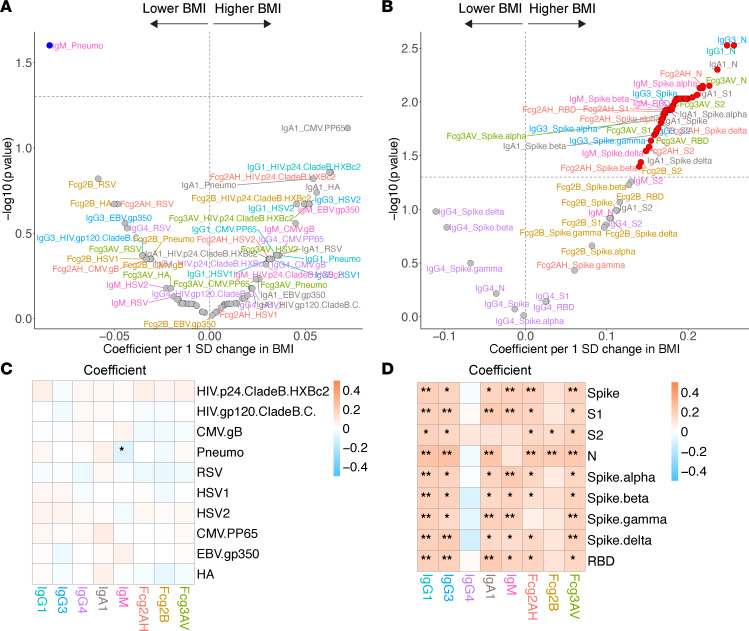
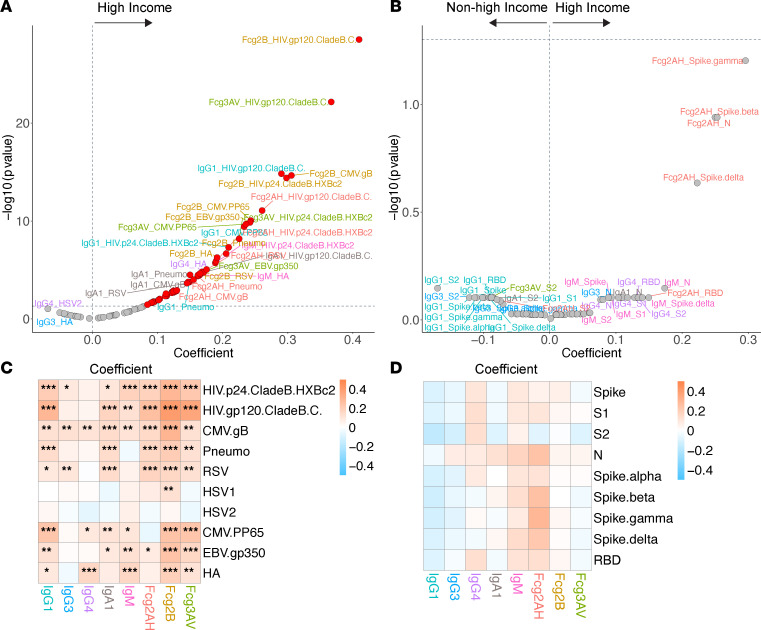
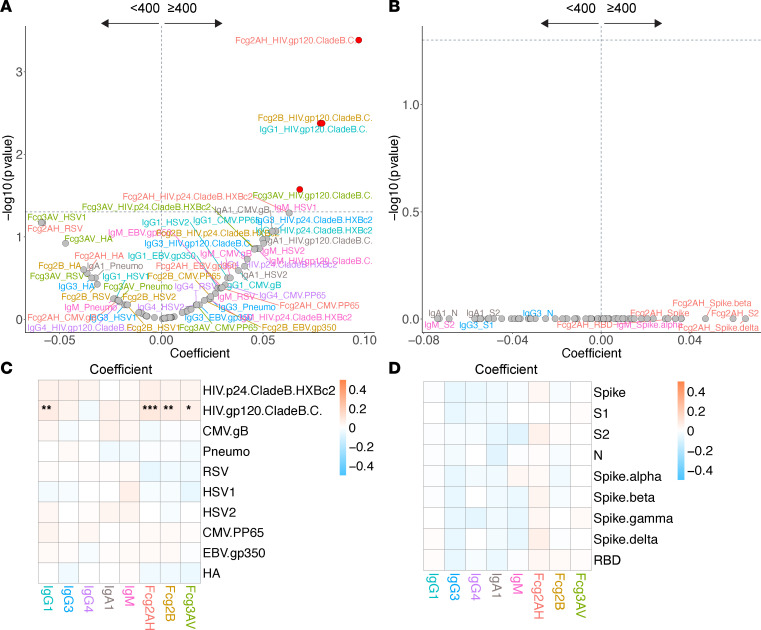
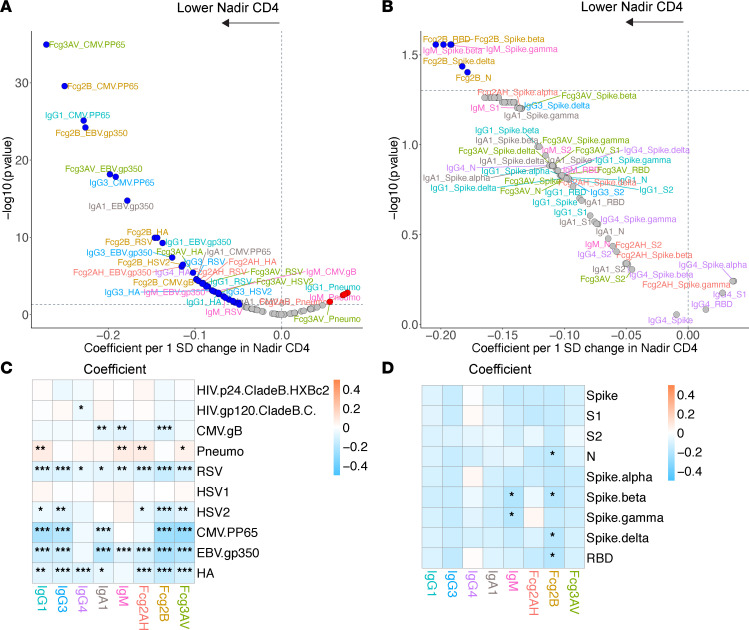
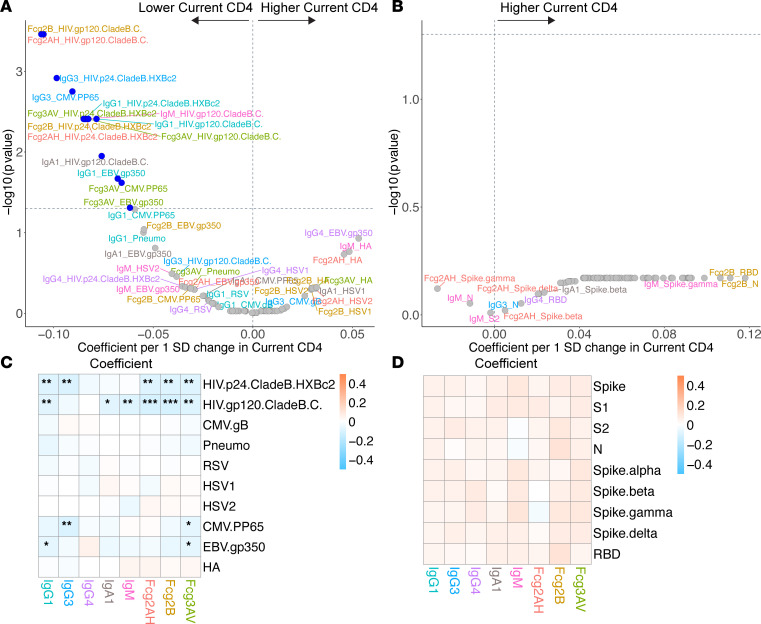
People with HIV (PWH) appear to be at higher risk for suboptimal pathogen responses and for worse COVID-19 outcomes, but the effects of host factors and COVID-19 on the humoral repertoire remain unclear. We assessed the antibody isotype/subclass and Fc-receptor binding Luminex arrays of non-SARS-CoV-2 and SARS-CoV-2 humoral responses among antiretroviral therapy-treated (ART-treated) PWH. Among the entire cohort, COVID-19 infection was associated with higher cytomegalovirus (CMV) responses (vs. the COVID- cohort ), potentially signifying increased susceptibility or a consequence of persistent inflammation. Among the COVID+ participants, (a) higher BMI was associated with a striking amplification of SARS-CoV-2 responses, suggesting exaggerated inflammatory responses, and (b) lower nadir CD4 was associated with higher SARS-CoV-2 IgM and FcγRIIB binding capacity, indicating poorly functioning extrafollicular and inhibitory responses. Among the COVID-19- participants, female sex, older age, and lower nadir CD4 were associated with unique repertoire shifts. In this first comprehensive assessment of the humoral repertoire in a global cohort of PWH, we identify distinct SARS-CoV-2-specific humoral immune profiles among PWH with obesity or lower nadir CD4+ T cell count, underlining plausible mechanisms associated with worse COVID-19-related outcomes in this setting. Host factors associated with the humoral repertoire in the COVID-19- cohort enhance our understanding of these important shifts among PWH.

Keywords: AIDS/HIV; Adaptive immunity; COVID-19; Immunoglobulins; Obesity.


Figures

Figure 1
Figure 1. Study design.
(A) Consort diagram. (B) Venn diagram describing breakdown of RBD IgG/IgA-positive participants based on RBD IgG/IgA status and COVID-19–like symptoms.
Figure 2
Figure 2. Univariate associations among COVID-19+ participants.
(A) Univariate heatmap relating COVID-19 severity and host factors to SARS-CoV-2–specific antibody isotype and subclass and Fc-receptor binding. Coefficients derived from unadjusted linear regression modeling. (B and C) Violin plots of RBD-specific FcγRIIB (B) and Spike-specific FcγRIIB (C) across nadir CD4 groups are shown. (D and E) Violin plots of N-specific FcγRIIA (D) and RBD-specific FcγRIIIA (E) across BMI groups. Significance testing was performed via Wilcoxon rank-sum test and is shown as *P < 0.05, **P < 0.01, or ***P < 0.001.
Figure 3
Figure 3. Volcano plots and heatmaps of effect of SARS-CoV-2 RBD IgG/IgA positivity on the humoral immune repertoire among all participants.
(A and B) Volcano plots of effect of SARS-CoV-2 RBD IgG/IgA positivity on the non–SARS-CoV-2 humoral repertoire (A) and SARS-CoV-2 humoral repertoire (B) among all participants. Volcano plots constructed from linear regression models, adjusted for age, sex, GBD region, nadir CD4, and HIV viral load, with horizontal dashed line of significance displayed for FDR-corrected P = 0.05. Responses higher in the antibody-positive fall toward the right of the vertical dashed line, while responses higher in the antibody-negative fall toward the left of the vertical dashed line. (C and D) Respective heatmaps of the volcano plot coefficients for the non–SARS-CoV-2 (C) and SARS-CoV-2 (D) humoral responses. Coefficients > 0 reflect higher antibody responses in the antibody-positive participants, while coefficients < 0 reflect higher antibody responses in the antibody-negative participants. Significance in the heatmaps is shown as FDR-corrected *P < 0.05, **P < 0.01, or ***P < 0.001. Specific antibody isotype, subclass, and Fc-receptor responses are color-coded between the volcano plots and heatmaps.
Figure 4
Figure 4. Volcano plots and heatmaps of effect of COVID-19 severity on the humoral immune repertoire among COVID-19+ participants.
(A and B) Adjusted volcano plots of effect of COVID-19 severity on the non–SARS-CoV-2 humoral repertoire (A) and SARS-CoV-2 humoral repertoire (B) among COVID-19+ participants. Coefficients reflect the effect of a 1 SD increase in severity, which was Z scored for each participant from the ordinal scale of none reported/asymptomatic, mild, moderate, or severe. (C and D) Respective heatmaps of the volcano plot coefficients for the non–SARS-CoV-2 (C) and SARS-CoV-2 (D) humoral responses. Significance in the heatmaps is shown as FDR-corrected *P < 0.05, **P < 0.01, or ***P < 0.001.
Figure 5
Figure 5. Volcano plots and heatmaps of effect of natal sex on the humoral immune repertoire.
(A and B) Adjusted volcano plots of effect of natal sex on the non–SARS-CoV-2 humoral repertoire (A) among the COVID-19 cohort and SARS-CoV-2 humoral repertoire (B) among the COVID-19+ cohort. (C and D) Respective heatmaps of the volcano plot coefficients for the non–SARS-CoV-2 (C) and SARS-CoV-2 (D) humoral responses. Significance in the heatmaps is shown as FDR-corrected *P < 0.05, **P < 0.01, or ***P < 0.001.
Figure 6
Figure 6. Volcano plots and heatmaps of effect of age on the humoral immune repertoire.
(A and B) Adjusted volcano plots of effect of age on the non–SARS-CoV-2 humoral repertoire (A) among the COVID-19 cohort and SARS-CoV-2 humoral repertoire (B) among COVID-19+ cohort. Coefficients reflect the effect of a 1 SD increase in age, which was Z scored for each participant. (C and D) Respective heatmaps of the volcano plot coefficients for the non–SARS-CoV-2 (C) and SARS-CoV-2 (D) humoral responses. Significance in the heatmaps is shown as FDR-corrected *P < 0.05, **P < 0.01, or ***P < 0.001.
Figure 7
Figure 7. Volcano plots and heatmaps of effect of BMI on the humoral immune repertoire.
(A and B) Adjusted volcano plots of effect of BMI on the non–SARS-CoV-2 humoral repertoire (A) among the COVID-19 cohort and SARS-CoV-2 humoral repertoire (B) among COVID-19+ cohort. Coefficients reflect the effect of a 1 SD increase in BMI, which was Z scored for each participant. (C and D) Respective heatmaps of the volcano plot coefficients for the non–SARS-CoV-2 (C) and SARS-CoV-2 (D) humoral responses. Significance in the heatmaps is shown as FDR-corrected *P < 0.05 or **P < 0.01.
Figure 8
Figure 8. Volcano plots and heatmaps of effect of GBD region on the humoral immune repertoire.
(A and B) Adjusted volcano plots of effect of high-income GBD region (vs. non–high-income) on the non–SARS-CoV-2 humoral repertoire (A) among the COVID-19 cohort and SARS-CoV-2 humoral repertoire (B) among the COVID-19+ cohort. (C and D) Respective heatmaps of the volcano plot coefficients for the non–SARS-CoV-2 (C) and SARS-CoV-2 (D) humoral responses. Significance in the heatmaps is shown as FDR-corrected *P < 0.05, **P < 0.01, or ***P < 0.001.
Figure 9
Figure 9. Volcano plots and heatmaps of effect of HIV viremia on the humoral immune repertoire.
(A and B) Adjusted volcano plots of effect of HIV viremia (≥400 vs. <400 copies/mL) on the non–SARS-CoV-2 humoral repertoire (A) among the COVID-19 cohort and SARS-CoV-2 humoral repertoire (B) among the COVID-19+ cohort. (C and D) Respective heatmaps of the volcano plot coefficients for the non–SARS-CoV-2 (C) and SARS-CoV-2 (D) humoral responses. Significance in the heatmaps is shown as FDR-corrected *P <0.05, **P < 0.01, or ***P < 0.001.
Figure 10
Figure 10. Volcano plots and heatmaps of effect of nadir CD4 on the humoral immune repertoire.
(A and B) Adjusted volcano plots of effect of nadir CD4 on the non–SARS-CoV-2 humoral repertoire (A) among the COVID-19 cohort and SARS-CoV-2 humoral repertoire (B) among the COVID-19+ cohort. Coefficients reflect the effect of a 1 SD increase in nadir CD4, which was Z scored for each participant from the ordinal scale of < 50, 50–199, 200–349, or ≥ 350 cells/mm3. (C and D) Respective heatmaps of the volcano plot coefficients for the non–SARS-CoV-2 (C) and SARS-CoV-2 (D) humoral responses. Significance in the heatmaps is shown as FDR-corrected *P < 0.05, **P < 0.01, or ***P < 0.001.
Figure 11
Figure 11. Volcano plots and heatmaps of effect of current CD4 on the humoral immune repertoire.
(A and B) Adjusted volcano plots of effect of current CD4 (without nadir CD4 adjustment) on the non–SARS-CoV-2 humoral repertoire (A) among the COVID-19 cohort and SARS-CoV-2 humoral repertoire (B) among COVID-19+ cohort. Coefficients reflect the effect of a 1 SD increase in current CD4 (cells/mm3), which was Z scored for each participant. (C and D) Respective heatmaps of the volcano plot coefficients for the non–SARS-CoV-2 (C) and SARS-CoV-2 (D) humoral responses. Significance in the heatmaps is shown as FDR-corrected *P < 0.05, **P < 0.01, or ***P < 0.001.

References

    1. Moir S, et al. Evidence for HIV-associated B cell exhaustion in a dysfunctional memory B cell compartment in HIV-infected viremic individuals. J Exp Med. 2008;205(8):1797–1805. doi: 10.1084/jem.20072683. - DOI - PMC - PubMed
    1. Cubas RA, et al. Inadequate T follicular cell help impairs B cell immunity during HIV infection. Nat Med. 2013;19(4):494–499. doi: 10.1038/nm.3109. - DOI - PMC - PubMed
    1. Kityo C, et al. Lymphoid tissue fibrosis is associated with impaired vaccine responses. J Clin Invest. 2018;128(7):2763–2773. doi: 10.1172/JCI97377. - DOI - PMC - PubMed
    1. Moysi E, et al. Altered immune cell follicular dynamics in HIV infection following influenza vaccination. J Clin Invest. 2018;128(7):3171–3185. doi: 10.1172/JCI99884. - DOI - PMC - PubMed
    1. Schacker TW, et al. Amount of lymphatic tissue fibrosis in HIV infection predicts magnitude of HAART-associated change in peripheral CD4 cell count. AIDS. 2005;19(18):2169–2171. doi: 10.1097/01.aids.0000194801.51422.03. - DOI - PubMed

Publication types