. 2023 Feb;5(2):248-264.
doi: 10.1038/s42255-023-00742-w. Epub 2023 Feb 20.

Proteome-wide Mendelian randomization implicates nephronectin as an actionable mediator of the effect of obesity on COVID-19 severity

Affiliations

Proteome-wide Mendelian randomization implicates nephronectin as an actionable mediator of the effect of obesity on COVID-19 severity

Satoshi Yoshiji et al. Nat Metab. 2023 Feb.

Abstract

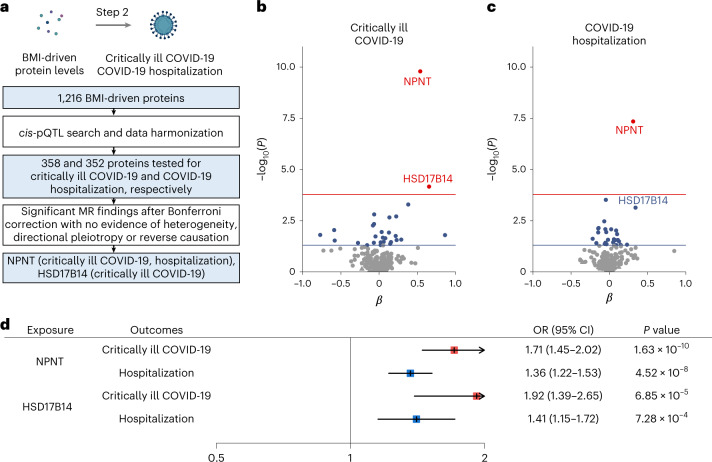
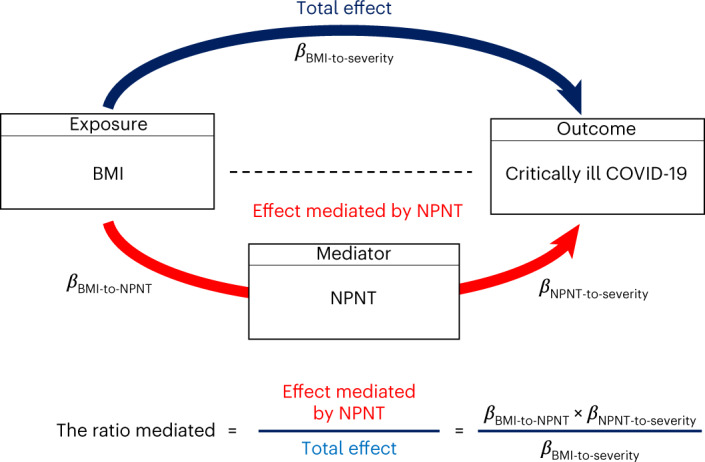
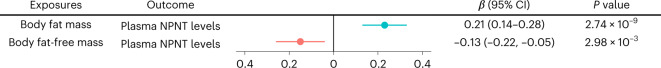
Obesity is a major risk factor for Coronavirus disease (COVID-19) severity; however, the mechanisms underlying this relationship are not fully understood. As obesity influences the plasma proteome, we sought to identify circulating proteins mediating the effects of obesity on COVID-19 severity in humans. Here, we screened 4,907 plasma proteins to identify proteins influenced by body mass index using Mendelian randomization. This yielded 1,216 proteins, whose effect on COVID-19 severity was assessed, again using Mendelian randomization. We found that an s.d. increase in nephronectin (NPNT) was associated with increased odds of critically ill COVID-19 (OR = 1.71, P = 1.63 × 10⁻¹⁰). The effect was driven by an NPNT splice isoform. Mediation analyses supported NPNT as a mediator. In single-cell RNA-sequencing, NPNT was expressed in alveolar cells and fibroblasts of the lung in individuals who died of COVID-19. Finally, decreasing body fat mass and increasing fat-free mass were found to lower NPNT levels. These findings provide actionable insights into how obesity influences COVID-19 severity.


Conflict of interest statement

J.B.R. has served as an advisor to GlaxoSmithKline and Deerfield Capital. The institution of J.B.R. has received investigator-initiated grant funding from Eli Lilly, GlaxoSmithKline and Biogen for projects unrelated to this research. J.B.R. is the CEO of 5 Prime Sciences (www.5primesciences.com), which provides research services for biotech, pharma and venture capital companies for projects unrelated to this research. T.L. and V.F. are employees of 5 Prime Sciences. T.N. has received speaking fees from Boehringer Ingelheim and AstraZeneca regarding the projects unrelated to this research. The other authors declare no competing interests.

Figures

Fig. 1
Fig. 1. Study overview and summary.
We identified circulating proteins mediating the effect of obesity on COVID-19 severity using a two-step MR approach: First, we estimated the effect of BMI on 4,907 plasma proteins using MR, which yielded 1,216 BMI-driven proteins (step 1 MR). Second, we estimated the effect of the BMI-driven proteins on COVID-19 severity outcomes, again using MR (step 2 MR). This was followed by multiple validity assessments and follow-up analyses.
Fig. 2
Fig. 2. MR analyses for the effect of BMI on plasma protein levels.
a, Flow diagram of the step 1 MR analyses. b, Volcano plot illustrating the effect of BMI on each plasma protein from the MR analyses using inverse variance weighted method. Red and gray horizontal lines represent P = 1.0 × 10−5 (Bonferroni correction for 4,907 proteins: 0.05 / 4,907) and 0.05, respectively. A proteins’ shape denotes whether the protein passed all sensitivity tests (heterogeneity, directional pleiotropy and reverse-causation assessment) (circle) or failed any of them (triangle). c, MR scatter-plot for the effect of BMI on plasma NPNT levels. d, MR scatter-plot for the effect of BMI on plasma HSD17B14 levels. A genetically predicted increase in BMI by one s.d. was associated with increased levels of NPNT (β = 0.145, 95% CI 0.084–0.206, P = 3.03 × 10−6) and HSD17B14 (β = 0.144, 95% CI 0.085–0.202, P = 1.71 × 10−6) using the inverse variance weighted method. MR-Egger, weighted median and weighted mode methods yielded directionally consistent results with the inverse variance weighted method. Source data
Fig. 3
Fig. 3. MR analyses of BMI-driven proteins on COVID-19 outcomes.
a, Flow diagram of the step 2 MR analyses. b,c, Volcano plot illustrating the effect of BMI-driven proteins on critically ill COVID-19 (b) and COVID-19 hospitalization (c) from the MR analyses using the inverse variance weighted method or Wald ratio when only one SNP was available as an instrumental variable. Red and blue horizontal lines represent P = 1.4 × 10−4 (Bonferroni correction for 358proteins: 0.05 of 358) and 0.05, respectively. A proteins’ shape denotes whether the protein passed (circle) all sensitivity tests (heterogeneity, directional pleiotropy and reverse causation assessment) or failed any of them (triangle). d, Forest plot of the MR results for NPNT and HSD17B14, showing the OR per one s.d. increased in plasma levels of NPNT and HSD17B14 for critically ill COVID-19 and hospitalization outcomes. Source data
Fig. 4
Fig. 4. Colocalization analyses of cis-pQTL for NPNT or HSD17B14 with COVID outcomes in the 1-Mb region around rs34712979.
a,b, We evaluated whether the cis-pQTL for NPNT (a) and HSD17B14 (b) shared the same causal variant with critically ill COVID-19 or COVID-19 hospitalization outcomes using colocalization. Source data
Fig. 5
Fig. 5. Colocalization analyses of cis-pQTL with sQTL and eQTL for NPNT.
We evaluated whether the cis-pQTL for NPNT shared the same causal variant with eQTL or sQTL of NPNT in the lung using colocalization. Source data
Fig. 6
Fig. 6. NPNT expression levels in lung cell types from COVID-19 lung autopsy samples at single-cell resolution.
a, NPNT expression levels of each cell type at single-cell resolution in the 16 lung donors with COVID-19. UMAP, Uniform Manifold and Projection. b, Thirty-nine annotated cell types of the lung. EC, endothelial cell; Treg, regulatory T; NK, natural killer; RBC, red blood cell. c, NPNT expression status in 106,449 SARS-CoV-2 non-infected cells (viral infection−, top) or 343 SARS-CoV-2-infected cells (viral infection+, bottom) in 16 lung donors. NPNT expression levels of 39 cell types in the two groups are shown in a box plot. In each box, the horizontal line denotes a median value of the expression levels and the asterisk inside each box denotes the mean value. Each box extends from the 25th to the 75th percentile of each group. Whiskers extend 1.5 × interquartile range from the top and bottom of the box. Log (TP10K + 1) was calculated by normalizing original gene counts by total unique molecular identifier counts, multiplying by 10,000 (TP10K) and then taking the natural logarithm. Source data
Fig. 7
Fig. 7. MR mediation analysis illustrated by the directed acyclic graph.
The dark blue arrow represents the total effect of BMI on critically ill COVID-19. The red arrow represents the effect of BMI on critically ill COVID-19 mediated by NPNT. For the effect of BMI on critically ill COVID-19 mediated by NPNT, the product of coefficients method calculates the proportion mediated by multiplying βBMI-to-NPNT and βNPNT-to-severity and subsequently dividing it by βBMI-to-severity, where βBMI-to-NPNT is the effect of BMI on NPNT, βNPNT-to-severity is the effect of NPNT on critically ill COVID-19, and βBMI-to-severity is the total effect of BMI on critically ill COVID-19. We evaluated the proportion mediated for the effect of obesity-related exposures (BMI, body fat percentage and body fat mass) on COVID-19 severity outcomes (critically ill COVID-19 and COVID-19 hospitalization).
Fig. 8
Fig. 8. Multivariable MR analysis for evaluating independent effects of body fat and fat-free mass on plasma NPNT levels.
We performed multivariable MR with the inverse variance weighted method using body fat and fat-free mass as the exposures and plasma NPNT levels as the outcome. Source data

Comment in

References

    1. Johns Hopkins University. COVID-19 Global Maphttps://coronavirus.jhu.edu/map.html (2022).
    1. COVID-19 Host Genetics Initiative. Mapping the human genetic architecture of COVID-19. Nature600, 472–477 (2021). - PMC - PubMed
    1. Stefan N, Birkenfeld AL, Schulze MB, Ludwig DS. Obesity and impaired metabolic health in patients with COVID-19. Nat. Rev. Endocrinol. 2020;16:341–342. doi: 10.1038/s41574-020-0364-6. - DOI - PMC - PubMed
    1. Foulkes AS, et al. Understanding the link between obesity and severe COVID-19 outcomes: causal mediation by systemic inflammatory response. J. Clin. Endocrinol. Metab. 2021;107:e698–e707. doi: 10.1210/clinem/dgab629. - DOI - PMC - PubMed
    1. Zickler M, et al. Replication of SARS-CoV-2 in adipose tissue determines organ and systemic lipid metabolism in hamsters and humans. Cell. Metab. 2022;34:1–2. doi: 10.1016/j.cmet.2021.12.002. - DOI - PMC - PubMed

Publication types