. 2023 Feb 20;15(1):11.
doi: 10.1186/s13073-023-01160-z.

TREM2 splice isoforms generate soluble TREM2 species that disrupt long-term potentiation

Affiliations

TREM2 splice isoforms generate soluble TREM2 species that disrupt long-term potentiation

Miguel Moutinho et al. Genome Med. .

Abstract

Background: TREM2 is a transmembrane receptor expressed by myeloid cells and acts to regulate their immune response. TREM2 governs the response of microglia to amyloid and tau pathologies in the Alzheimer's disease (AD) brain. TREM2 is also present in a soluble form (sTREM2), and its CSF levels fluctuate as a function of AD progression. Analysis of stroke and AD mouse models revealed that sTREM2 proteins bind to neurons, which suggests sTREM2 may act in a non-cell autonomous manner to influence neuronal function. sTREM2 arises from the proteolytic cleavage of the membrane-associated receptor. However, alternatively spliced TREM2 species lacking a transmembrane domain have been postulated to contribute to the pool of sTREM2. Thus, both the source of sTREM2 species and its actions in the brain remain unclear.

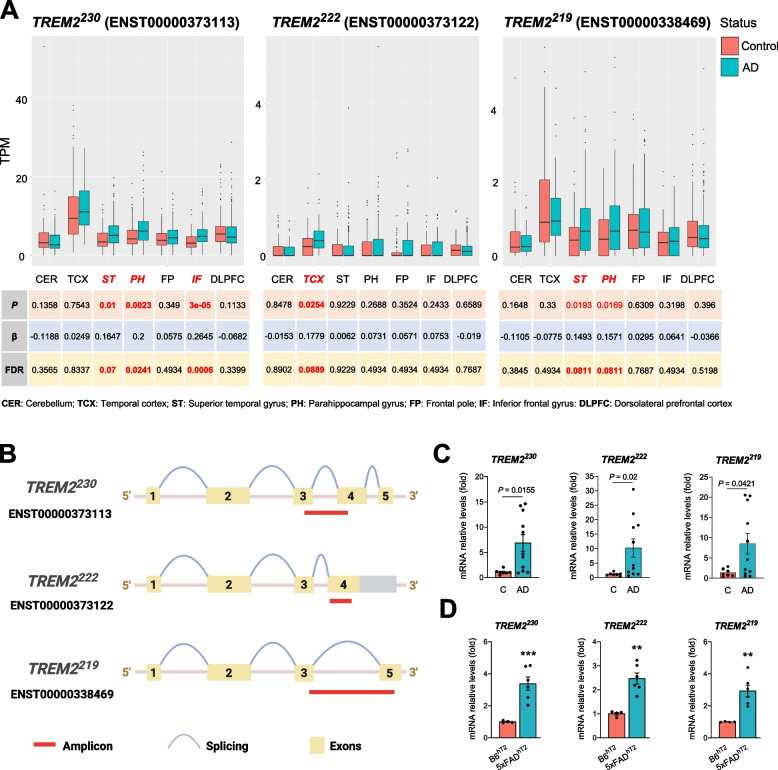
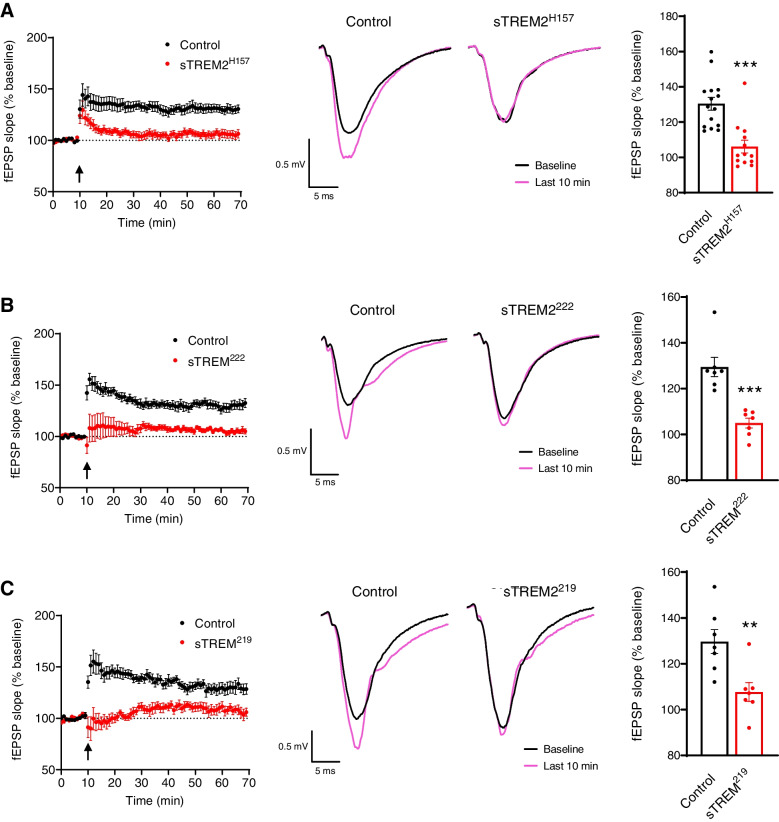
Methods: The expression of TREM2 isoforms in the AD brain was assessed through the analysis of the Accelerating Medicines Partnership for Alzheimer's Disease Consortium transcriptomics data, as well as qPCR analysis using post-mortem samples of AD patients and of the AD mouse model 5xFAD. TREM2 cleavage and secretion were studied in vitro using HEK-293T and HMC3 cell lines. Synaptic plasticity, as evaluated by induction of LTP in hippocampal brain slices, was employed as a measure of sTREM2 actions.

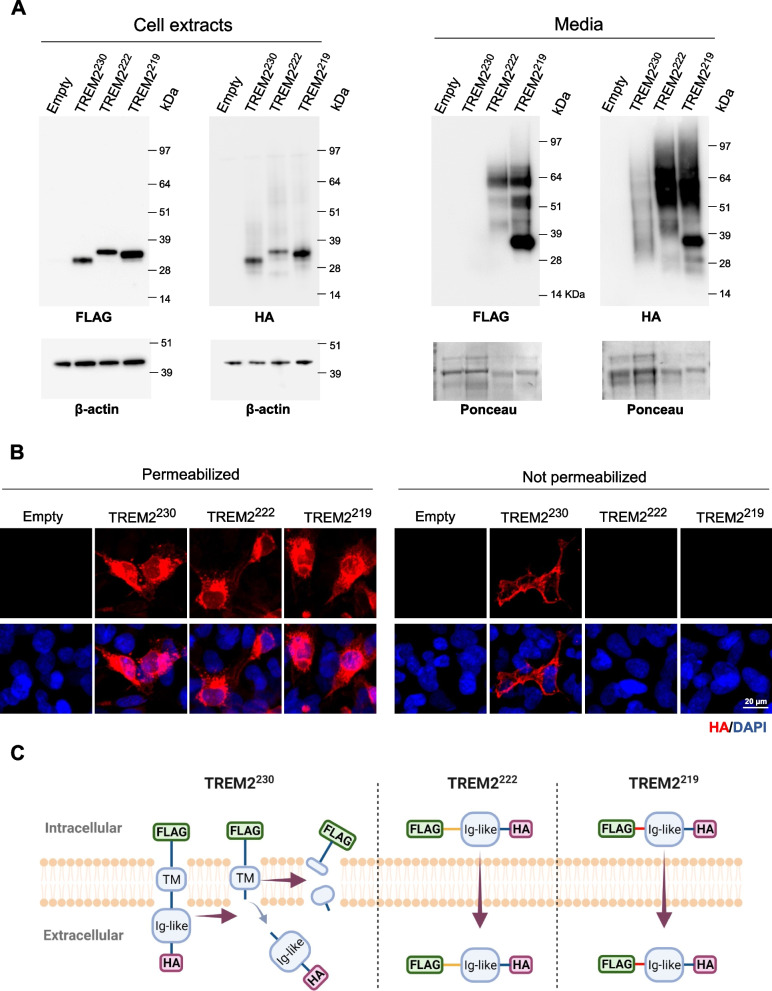
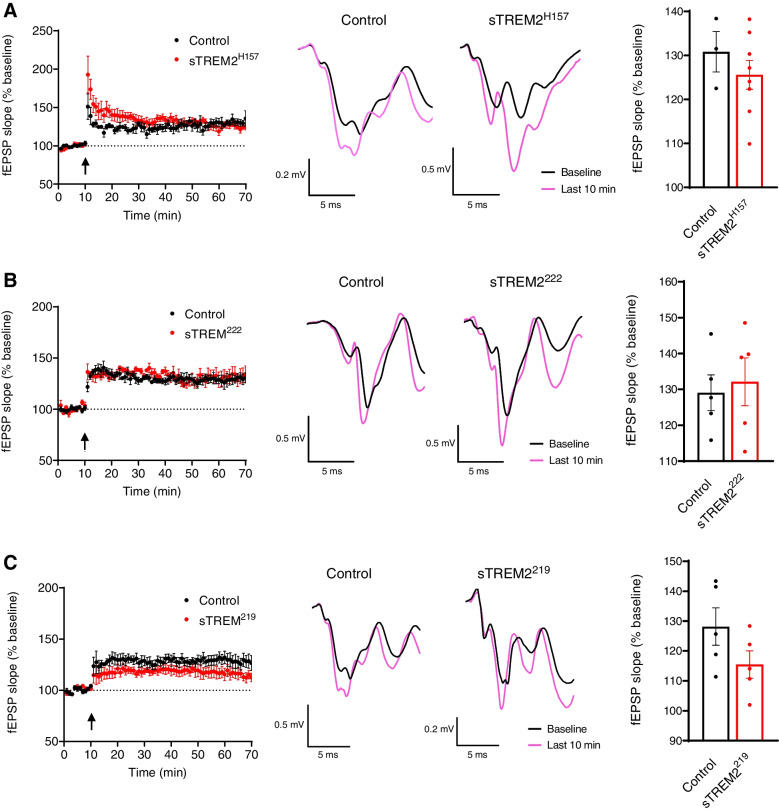
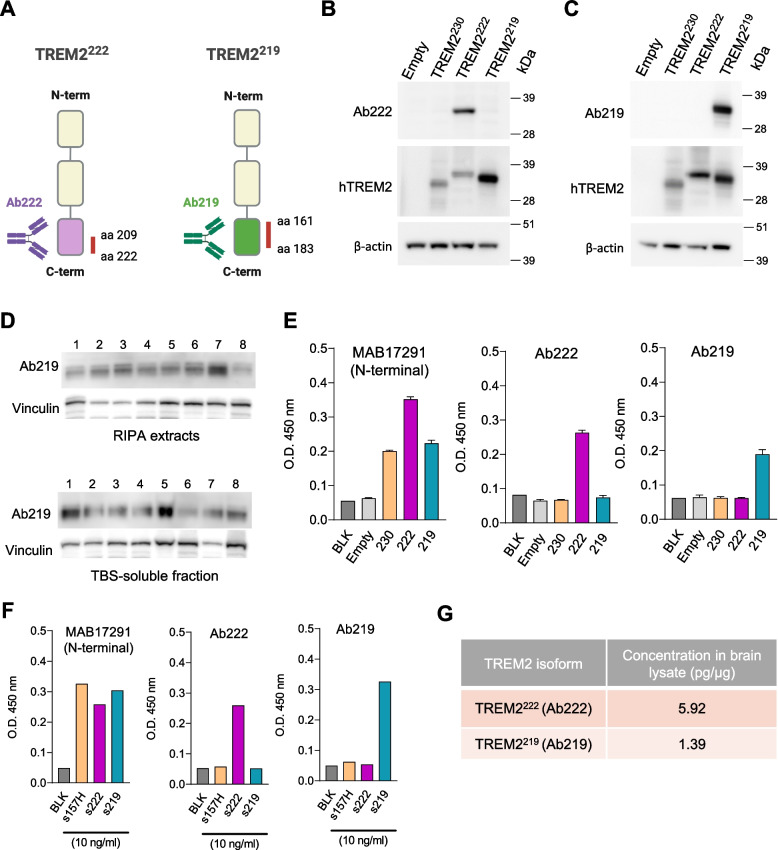
Results: Three distinct TREM2 transcripts, namely ENST00000373113 (TREM2230), which encodes the full-length transmembrane receptor, and the alternatively spliced isoforms ENST00000373122 (TREM2222) and ENST00000338469 (TREM2219), are moderately increased in specific brain regions of patients with AD. We provide experimental evidence that TREM2 alternatively spliced isoforms are translated and secreted as sTREM2. Furthermore, our functional analysis reveals that all sTREM2 species inhibit LTP induction, and this effect is abolished by the GABAA receptor antagonist picrotoxin.

Conclusions: TREM2 transcripts can give rise to a heterogeneous pool of sTREM2 which acts to inhibit LTP. These results provide novel insight into the generation, regulation, and function of sTREM2 which fits into the complex biology of TREM2 and its role in human health and disease. Given that sTREM2 levels are linked to AD pathogenesis and progression, our finding that sTREM2 species interfere with LTP furthers our understanding about the role of TREM2 in AD.

Keywords: Alzheimer’s disease; Soluble TREM2; TREM2; TREM2 splicing.


Conflict of interest statement

The Indiana CTSI Eli Lilly-Stark Neurosciences Post-Doctoral Research Fellowship in Neurodegeneration does not constitute a competing interest. The authors declare that they have no competing interests.

Figures

Fig. 1
Fig. 1
TREM2 isoforms expression increases in Alzheimer’s disease. A Expression analysis of TREM2 isoforms (TREM2230, TREM2222, and TREM2219) in different brain regions in control subjects (Control) and patients with late-onset Alzheimer’s disease (AD) using the AMP-AD dataset. B Design of qPCR primers to specifically detect TREM2 isoforms. C qPCR expression analysis of TREM2 isoforms in middle frontal gyrus tissue of control subjects (C) and patients with Alzheimer’s disease (AD). Statistical analysis was performed by the Student t-test for TREM2230 and Mann-Whitney test for TREM2222 and TREM2219. D qPCR expression analysis of TREM2 isoforms in brain cortical tissue of 7-month-old control and 5xFAD mice expressing human TREM2 gene (B6hT2and 5xFADhT2). Animals from both sexes were analyzed together (3 males and 1 female B6hT2; 3 males and 3 females 5xFADhT2). Statistical analysis was performed by the Student t-test. Data are expressed as mean values ± SEM (**P < 0.01; ***P < 0.001)
Fig. 2
Fig. 2
Secretion of TREM2 isoforms. A Western blot analysis of TREM2 isoforms C-terminus (FLAG-tagged) and N-terminus (HA-tagged) in cell extracts (left panel) and media (right panel) of HEK-293T transfected with tagged TREM2 isoforms. The FLAG and HA antibodies were used to detect the C- and N-terminus, respectively. β-Actin and Ponceau staining were used as loading controls for cell extracts and media, respectively. B Immunocytochemistry in permeable and non-permeable conditions (presence and absence of detergents, respectively) was performed in HMC3 cells transfected with TREM2-tagged isoforms. The HA antibody was used to detect all TREM2 isoforms and DAPI to stain cell nuclei. C Scheme of the processing of TREM2 isoforms based on the transfection model
Fig. 3
Fig. 3
Soluble TREM2 species inhibit long-term potentiation (LTP). Electrophysiology analysis of LTP in C57BL/6J mice brain slices incubated with soluble TREM2 species at 15 ng/ml. A–C Incubations with sTREM2H157, sTREM2222, and sTREM2219, respectively. For each isoform, a time course with the average fESP slopes (% baseline) is shown with an arrow that indicates the time of stimulation (left panel) accompanied by a representative fEPSP trace (middle panel) and the quantification of the last 10 min of fESP slope measurements (% baseline) (right panel). A Fifteen recordings from 10 animals for control and 13 recordings from 6 animals for sTREM2H157. B, C Seven recordings from 6 animals for both control and proteins. Statistical analysis was performed by the Mann-Whitney tests for sTREM2H157 and sTREM2222 and the Student t-test for sTREM2219. Data are expressed as mean values ± SEM (**P < 0.01; ***P < 0.001)
Fig. 4
Fig. 4
Inhibition of GABAA receptors abolishes the effect of soluble TREM2 species on long-term potentiation (LTP). Electrophysiology analysis of LTP in C57BL/6J mice brain slices incubated with soluble TREM2 species at 15 ng/ml and picrotoxin 50 μM. A–C Incubations with sTREM2H157, sTREM2222, and sTREM2219, respectively. For each isoform, a time course with the average fESP slopes (% baseline) is shown with an arrow that indicates the time of stimulation (left panel) accompanied by a representative fEPSP trace (middle panel) and the quantification of the last 10 min of fESP slope measurements (% baseline) (right panel). A Three slices from 2 animals for control and 8 slices from 6 animals for sTREM2H157 were recorded. B, C Five slices from 5 animals for both control and proteins were recorded. Statistical analysis was performed by the Student t-tests. Data are expressed as mean values ± SEM
Fig. 5
Fig. 5
Detection of TREM2 alternative isoforms protein expression in the human brain. A Design of customized antibodies to specifically detect human TREM2222 (Ab222) and TREM2219 (Ab219). B, C Western blot of TREM2222 and TREM2219 in cell extracts from HEK-293T transfected with tagged TREM2 isoforms (TREM2230, TREM2222, and TREM2219) using Ab222 (B), Ab219 (C), anti-human TREM2, and anti-β-actin antibodies. D Western blot analysis of TREM2219 expression in RIPA (upper blot) and TBS-soluble extracts (bottom blot) from the brain tissue of control human subjects (CTRL) and patients with Alzheimer’s disease (AD) using Ab219 and vinculin as a loading control. E ELISA of lysates from HMC3 cells transfected with TREM2 isoforms or empty plasmid (n = 3). The capture antibodies used were MAB17291 (N-terminal), Ab222, and Ab219. Data are shown as mean values ± SEM of optical density at 450 nm (O.D. 450 nm). F ELISA of purified soluble TREM2 proteins (10 ng/ml) using a TREM2 N-terminal capture antibody (MAB17291), as well as Ab222 and Ab219 to assess their specificity. Data are shown as O.D. 450 nm. G Concentration of TREM2222 and TREM2219 in a pool of human brain lysate determined by ELISA

References

    1. Selkoe DJ, Hardy J. The amyloid hypothesis of Alzheimer’s disease at 25 years. EMBO Mol Med. 2016;8:595–608. doi: 10.15252/emmm.201606210. - DOI - PMC - PubMed
    1. Hansen DV, Hanson JE, Sheng M. Microglia in Alzheimer’s disease. J Cell Biol. 2018;217:459–472. doi: 10.1083/jcb.201709069. - DOI - PMC - PubMed
    1. Karch CM, Goate AM. Alzheimer’s disease risk genes and mechanisms of disease pathogenesis. Biol Psychiatry. 2015;77:43–51. doi: 10.1016/j.biopsych.2014.05.006. - DOI - PMC - PubMed
    1. Sims R, van der Lee SJ, Naj AC, Bellenguez C, Badarinarayan N, Jakobsdottir J, Kunkle BW, Boland A, Raybould R, Bis JC, et al. Rare coding variants in PLCG2, ABI3, and TREM2 implicate microglial-mediated innate immunity in Alzheimer’s disease. Nat Genet. 2017;49:1373–1384. doi: 10.1038/ng.3916. - DOI - PMC - PubMed
    1. Guerreiro R, Wojtas A, Bras J, Carrasquillo M, Rogaeva E, Majounie E, Cruchaga C, Sassi C, Kauwe JS, Younkin S, et al. TREM2 variants in Alzheimer’s disease. N Engl J Med. 2013;368:117–127. doi: 10.1056/NEJMoa1211851. - DOI - PMC - PubMed

Publication types