

Longitudinal trajectories in negative symptoms and changes in brain cortical thickness: 10-year follow-up study
- PMID: 36805840
- PMCID: PMC10331319
- DOI: 10.1192/bjp.2022.192
Longitudinal trajectories in negative symptoms and changes in brain cortical thickness: 10-year follow-up study
Abstract
Background: Understanding the evolution of negative symptoms in first-episode psychosis (FEP) requires long-term longitudinal study designs that capture the progression of this condition and the associated brain changes.
Aims: To explore the factors underlying negative symptoms and their association with long-term abnormal brain trajectories.
Method: We followed up 357 people with FEP over a 10-year period. Factor analyses were conducted to explore negative symptom dimensionality. Latent growth mixture modelling (LGMM) was used to identify the latent classes. Analysis of variance (ANOVA) was conducted to investigate developmental trajectories of cortical thickness. Finally, the resulting ANOVA maps were correlated with a wide set of regional molecular profiles derived from public databases.
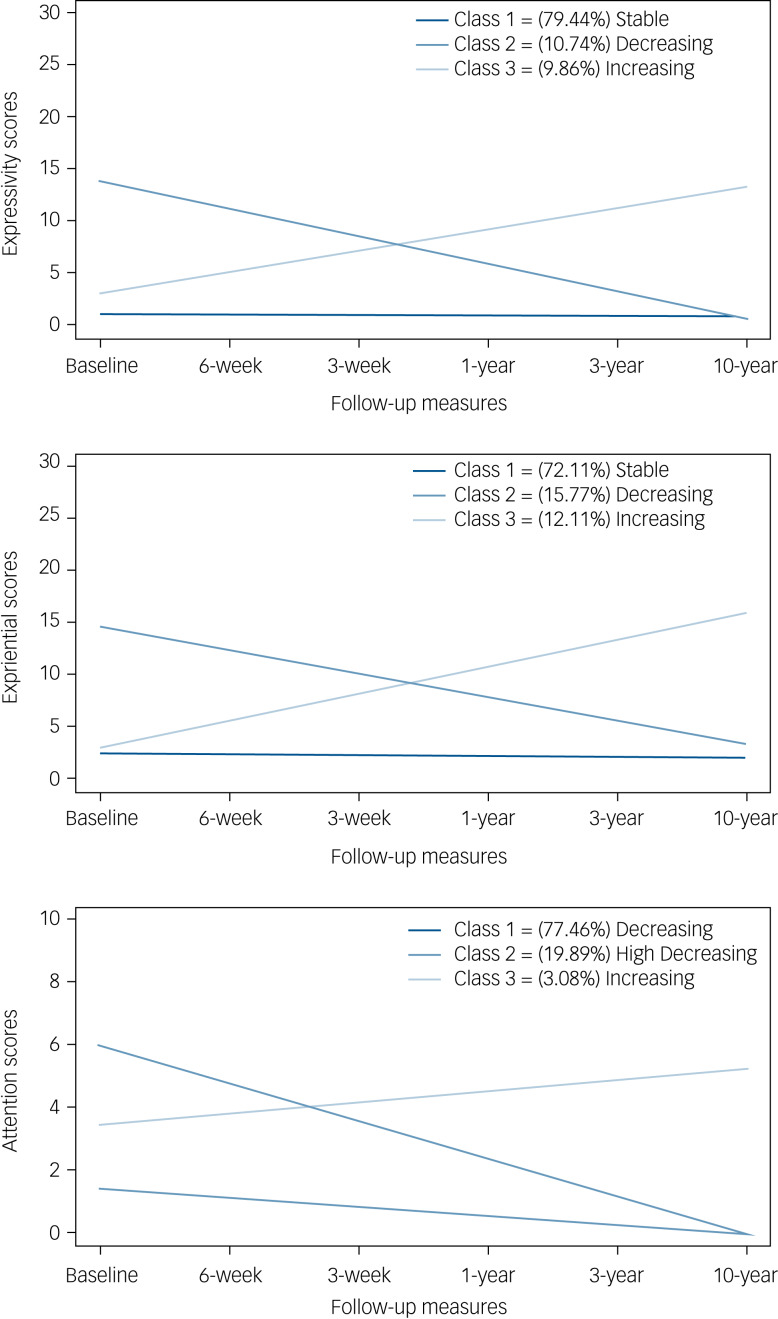
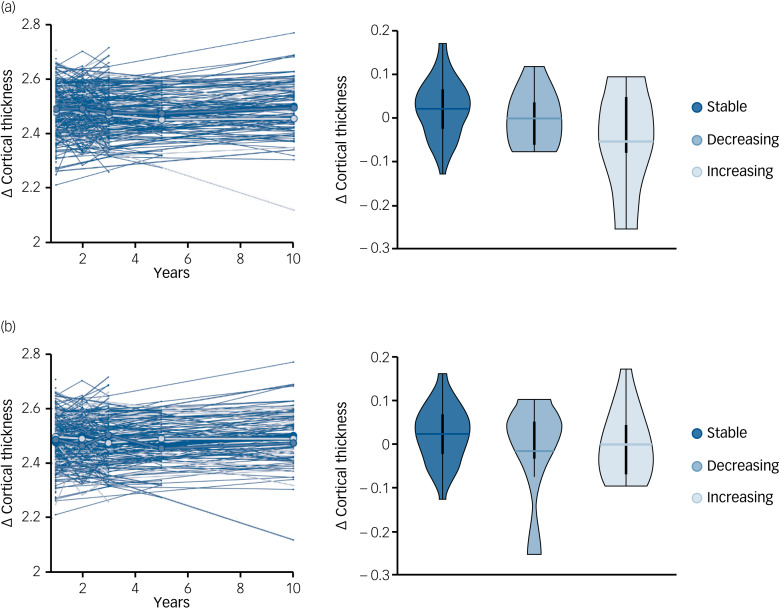
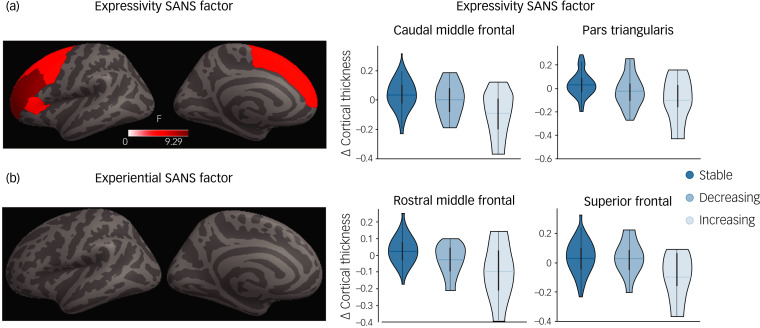
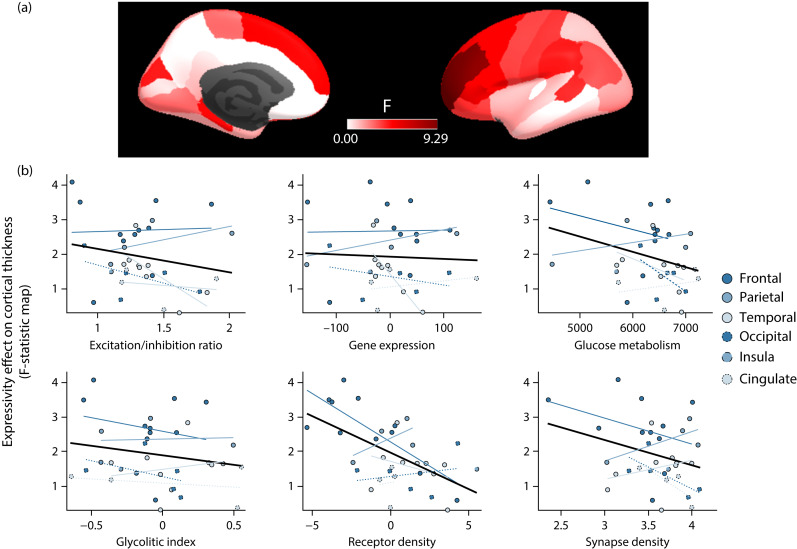
Results: Three trajectories (stable, decreasing and increasing) were found in each of the three factors (expressivity, experiential and attention) identified by the factor analyses. Patients with an increasing trajectory in the expressivity factor showed cortical thinning in caudal middle frontal, pars triangularis, rostral middle frontal and superior frontal regions from the third to the tenth year after the onset of the psychotic disorder. The F-statistic map of cortical thickness expressivity differences was associated with a receptor density map derived from positron emission tomography data.
Conclusions: Stable and decreasing were the most common trajectories. Additionally, cortical thickness abnormalities found at relatively late stages of FEP onset could be exploited as a biomarker of poor symptom outcome in the expressivity dimension. Finally, the brain areas with less density of receptors spatially overlap areas that discriminate the trajectories of the expressivity dimension.
Keywords: MRI; Negative symptoms; cortical thickness; factor analysis; first episode psychosis.
Conflict of interest statement
None.
Figures
References
-
- Bleuler E. Dementia Praecox or the Group of Schizophrenias [1911]. International Universities Press, 1950.
-
- Malaspina D, Walsh-Messinger J, Gaebel W, Smith LM, Gorun A, Prudent V, et al. Negative symptoms, past and present: a historical perspective and moving to DSM-5. Eur Neuropsychopharmacol 2014; 24: 710–24. - PubMed
-
- Carpenter WT Jr. Negative symptoms: a brief story and advances in Spain. Rev Psiquiatr y Salud Ment J Psychiatry Ment Heal 2022; 15: 1–2. - PubMed
-
- Rekhi G, Ang MS, Chan YH, Fernandez-Egea E, Kirkpatrick B, Lee J. Defining negative symptoms remission in schizophrenia using the brief negative symptom scale. Rev Psiquiatr y Salud Ment 2022; 15: 3–13. - PubMed
-
- Jung T, Wickrama KAS. An introduction to latent class growth analysis and growth mixture modeling. Soc Personal Psychol Compass 2008; 2: 302–17.
