

MorphoSim: an efficient and scalable phase-field framework for accurately simulating multicellular morphologies
- PMID: 36806172
- PMCID: PMC9938209
- DOI: 10.1038/s41540-023-00265-w
MorphoSim: an efficient and scalable phase-field framework for accurately simulating multicellular morphologies
Abstract
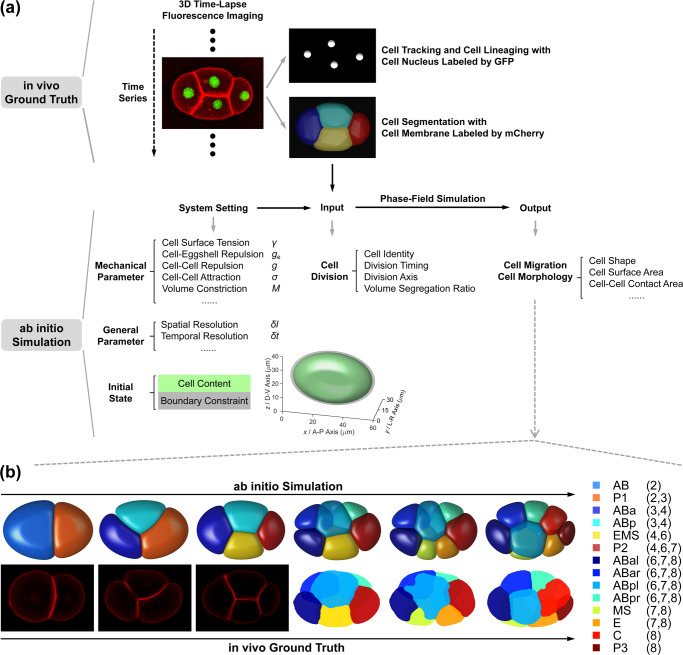
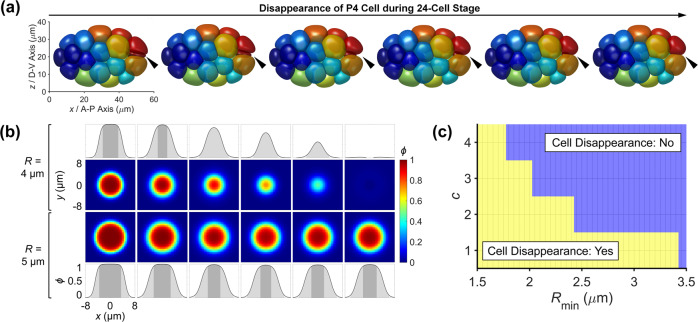
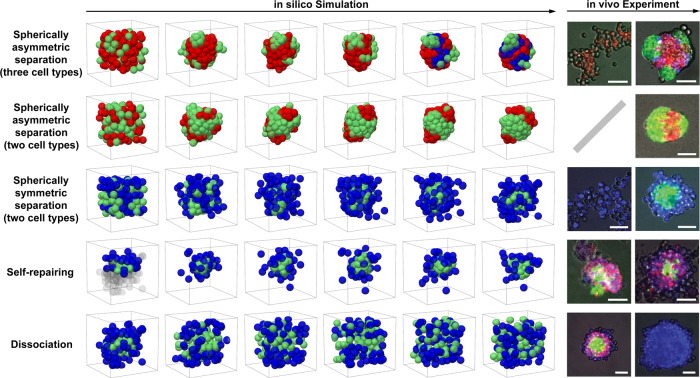
The phase field model can accurately simulate the evolution of microstructures with complex morphologies, and it has been widely used for cell modeling in the last two decades. However, compared to other cellular models such as the coarse-grained model and the vertex model, its high computational cost caused by three-dimensional spatial discretization hampered its application and scalability, especially for multicellular organisms. Recently, we built a phase field model coupled with in vivo imaging data to accurately reconstruct the embryonic morphogenesis of Caenorhabditis elegans from 1- to 8-cell stages. In this work, we propose an improved phase field model by using the stabilized numerical scheme and modified volume constriction. Then we present a scalable phase-field framework, MorphoSim, which is 100 times more efficient than the previous one and can simulate over 100 mechanically interacting cells. Finally, we demonstrate how MorphoSim can be successfully applied to reproduce the assembly, self-repairing, and dissociation of a synthetic artificial multicellular system - the synNotch system.
© 2023. The Author(s).
Conflict of interest statement
The authors declare no competing interests.
Figures


Similar articles
-
Modeling cell apoptosis for simulating three-dimensional multicellular morphogenesis based on a reversible network reconnection framework.Biomech Model Mechanobiol. 2016 Aug;15(4):805-16. doi: 10.1007/s10237-015-0724-7. Epub 2015 Sep 11. Biomech Model Mechanobiol. 2016. PMID: 26361766
-
Coupling intercellular molecular signalling with multicellular deformation for simulating three-dimensional tissue morphogenesis.Interface Focus. 2015 Apr 6;5(2):20140095. doi: 10.1098/rsfs.2014.0095. Interface Focus. 2015. PMID: 25844156 Free PMC article.
-
Effective mechanical potential of cell-cell interaction explains three-dimensional morphologies during early embryogenesis.PLoS Comput Biol. 2023 Aug 7;19(8):e1011306. doi: 10.1371/journal.pcbi.1011306. eCollection 2023 Aug. PLoS Comput Biol. 2023. PMID: 37549166 Free PMC article.
-
Three-dimensional vertex model for simulating multicellular morphogenesis.Biophys Physicobiol. 2015 Aug 18;12:13-20. doi: 10.2142/biophysico.12.0_13. eCollection 2015. Biophys Physicobiol. 2015. PMID: 27493850 Free PMC article. Review.
-
Origin of multicellular organisms as an inevitable consequence of dynamical systems.Anat Rec. 2002 Nov 1;268(3):327-42. doi: 10.1002/ar.10164. Anat Rec. 2002. PMID: 12382328 Review.
Cited by
-
Delineating the mechanisms and design principles of Caenorhabditis elegans embryogenesis using in toto high-resolution imaging data and computational modeling.Comput Struct Biotechnol J. 2022 Aug 19;20:5500-5515. doi: 10.1016/j.csbj.2022.08.024. eCollection 2022. Comput Struct Biotechnol J. 2022. PMID: 36284714 Free PMC article. Review.
-
A mathematical framework for understanding the spontaneous emergence of complexity applicable to growing multicellular systems.PLoS Comput Biol. 2024 Jun 5;20(6):e1011882. doi: 10.1371/journal.pcbi.1011882. eCollection 2024 Jun. PLoS Comput Biol. 2024. PMID: 38838038 Free PMC article.
-
Stability of asymmetric cell division: A deformable cell model of cytokinesis applied to C. elegans.Biophys J. 2023 May 16;122(10):1858-1867. doi: 10.1016/j.bpj.2023.04.017. Epub 2023 Apr 20. Biophys J. 2023. PMID: 37085996 Free PMC article.
-
Capturing nematic order on tissue surfaces of arbitrary geometry.Nat Commun. 2025 Aug 15;16(1):7596. doi: 10.1038/s41467-025-62694-x. Nat Commun. 2025. PMID: 40817333 Free PMC article.
-
Characterizing Cellular Physiological States with Three-Dimensional Shape Descriptors for Cell Membranes.Membranes (Basel). 2024 Jun 7;14(6):137. doi: 10.3390/membranes14060137. Membranes (Basel). 2024. PMID: 38921504 Free PMC article.
References
Grants and funding
- 12225102/National Natural Science Foundation of China (National Science Foundation of China)
- 12050002/National Natural Science Foundation of China (National Science Foundation of China)
- 12090053/National Natural Science Foundation of China (National Science Foundation of China)
- 32088101/National Natural Science Foundation of China (National Science Foundation of China)
LinkOut - more resources
Full Text Sources
