. 2023 Feb 20;13(1):2917.
doi: 10.1038/s41598-023-28841-4.

Low-data interpretable deep learning prediction of antibody viscosity using a biophysically meaningful representation

Affiliations

Low-data interpretable deep learning prediction of antibody viscosity using a biophysically meaningful representation

Brajesh K Rai et al. Sci Rep. .

Abstract

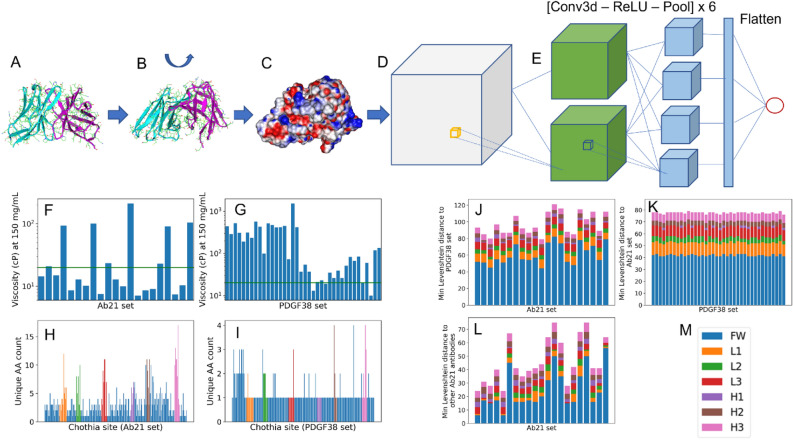
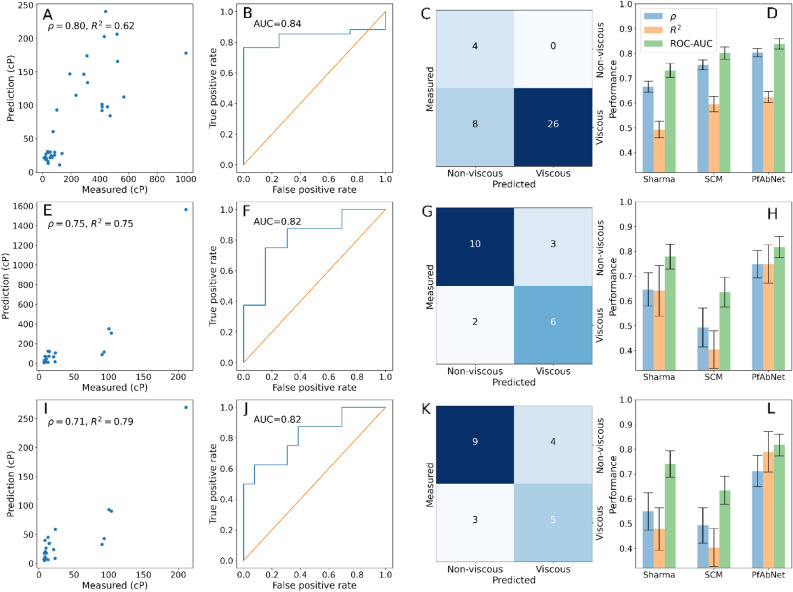
Deep learning, aided by the availability of big data sets, has led to substantial advances across many disciplines. However, many scientific problems of practical interest lack sufficiently large datasets amenable to deep learning. Prediction of antibody viscosity is one such problem where deep learning methods have not yet been explored due to the relative scarcity of relevant training data. In this work, we overcome this limitation using a biophysically meaningful representation that enables us to develop generalizable models even under limited training data. We present, PfAbNet-viscosity, a 3D convolutional neural network architecture, to predict high-concentration viscosity of therapeutic antibodies. We show that with the electrostatic potential surface of the antibody variable region as the only input to the network, the models trained on as few as couple dozen datapoints can generalize with high accuracy. Our feature attribution analysis shows that PfAbNet-viscosity has learned key biophysical drivers of viscosity. The applicability of our approach to other biological systems is discussed.


Conflict of interest statement

The authors declare no competing interests.

Figures

Figure 1
Figure 1
The PfAbNet pipeline and the datasets. (A) The starting Fv domain structure or homology model. (B) Training data augmentation and inference ensemble generation through random rotation of the starting Fv structure. (C) Generation of molecular surface and ESP. (D) Cubic grid with ESP surface shell. (E) Illustration of the 3D-CNN architecture. (F,G) Experimental viscosity of the Ab21 (F) and PDGF38 (G) antibodies at 150 mg/mL concentration. The horizontal line in these panels represent the 20 cP threshold that defines the low- and high-viscosity classes. (H,I) Amino acid variability in the Ab21 (H) and PDGF38 (I) datasets at different Chothia positions across the variable region sequence. (JL) Minimum Levenshtein distance between the variable region sequence of the Ab21 antibodies with respect to the PDGF38 set (J), PDGF38 antibodies with respect to the Ab21 set (K), and Ab21 antibodies with respect to the other antibodies in the same set (L). (M) The coloring scheme used in depicting the contribution from the framework and CDR loop regions to the distributions in (HL).
Figure 2
Figure 2
Performance of PfAbNet and previous sequence- and structure-based methods. All predictions and experimental values correspond to viscosity at 150 mg/mL concentration. (A) PfAbNet-Ab21 predictions for the PDGF38 antibodies. (B,C) Classification performance of PfAbNet-Ab21 on the PDGF38 test set: ROC curve (B) and confusion matrix (C). (D) Performance of PfAbNet-Ab21 and previous methods (re-trained Sharma model and SCM) on the PDGF38 test set based on Spearman rank-order correlation, R2, and ROC-AUC metrics. (Middle row) The performance of PfAbNet-PDGF and previous methods on the Ab21 test set: (E) PfAbNet-PDGF prediction vs experimental viscosity, (F) classification performance using ROC curve, (G) confusion matrix, and (H) Spearman rank-order correlations, R2, and ROC-AUC. (Bottom row) The leave-one-out performance of the PfAbNet, SCM, and re-trained Sharma models on the Ab21 test set: (I) PfAbNet-LOOCV prediction vs experimental viscosity, (J,K) classification performance shown using ROC curve (J) and confusion matrix (K), (L) Spearman rank-order correlation, R2, and ROC-AUC. The error bars represent the 95% confidence interval estimated with 500 bootstrap samples. Each confusion matrix was calculated using the optimal operating point, derived from the corresponding ROC curve, as the cutoff for viscous vs. non-viscous class.
Figure 3
Figure 3
PfAbNet feature attribution maps and patch-size distributions in test set molecules. (AH) Attribution maps and the variable region structure of four antibodies in the Ab21 (AD) and PDGF38 (EH) sets. The grid points with “significant attribution” (absolute attribution score greater than one standard deviation from the zero-attribution baseline) are shown. The light and heavy chain of each Fv structure are shown in cyan and magenta, respectively. Separate depictions of positive- (red dots, top row) and negative- (blue dots, bottom row) attribution maps highlight the greater size and density of the positive attribution map compared to the negative attribution map in each molecule. These examples were selected to illustrate the differences between the lowest- and highest-viscosity molecules in the Ab21 (A vs. B, C vs. D) and PDGF38 (E vs. F, G vs. H) sets. The contrast between the positive attribution maps of the highest- and lowest-viscosity (B vs. A, F vs. E) antibodies is particularly notable. (I,J) Patch-size distributions of up to five largest positive- and negative-attribution patches (contiguous segments of significant attribution grid points) in Ab21 (I) and PDGF38 (J). To highlight the dependence of patch size on measured viscosity, the antibodies in these panels are arranged based on their experimental viscosity, lowest to highest. The error bars represent the 95% confidence interval estimated using an ensemble of 100 predictions for each test set antibody (“Methods”).
Figure 4
Figure 4
Influence of proximal positive charges on positive attributions around sidechain carboxyl groups. (A,B) Positive-attribution map and variable region structure of the highest-viscosity antibody in Ab21 (A) and PDGF38 (B) set. The light and heavy chain of each Fv structure are shown in cyan and magenta, respectively. The effect of proximal positive charges on the attribution maps is highlighted by orange, ball-and-stick depiction of relevant amino acids. (C,D) Average attribution score of Asp/Glu carboxylates in the proximity of (proximal, d ≤ 3.5 Å) or away from (distal, d ≥ 5 Å) a positive charge center (positively charged nitrogen in Lys or the Guanidine group in Arg) in Ab21 (C) and PDGF38 (D). The error bars represent the 95% confidence interval estimated using an ensemble of 100 predictions for each test set antibody.
Figure 5
Figure 5
Key biophysical determinants of high viscosity. (AD) The composition of the largest (A,C) and the five largest (B,D) positive-attribution patches in Ab21 (A,B) and PDGF38 (C,D). (E,F) The largest positive-attribution patch and the variable region structure of two high-viscosity antibodies from Ab21 (E, mAb4) and PDGF38 (F, R1-003). Negatively charged amino acids at either ends of each patch combine with the nearby surface aromatic residue(s) to form large contiguous attribution patches. The light and heavy chain of each Fv structure are shown in cyan and magenta, respectively. The error bars represent the 95% confidence interval estimated using an ensemble of 100 predictions for each test set antibody.

References

    1. Kaplon H, Reichert JM. Antibodies to watch in 2021. MAbs. 2021;13:1860476. doi: 10.1080/19420862.2020.1860476. - DOI - PMC - PubMed
    1. Xu Y, et al. Structure, heterogeneity and developability assessment of therapeutic antibodies. MAbs. 2019;11:239–264. doi: 10.1080/19420862.2018.1553476. - DOI - PMC - PubMed
    1. Raybould MI, et al. Five computational developability guidelines for therapeutic antibody profiling. Proc. Natl. Acad. Sci. 2019;116:4025–4030. doi: 10.1073/pnas.1810576116. - DOI - PMC - PubMed
    1. Sydow JF, et al. Structure-based prediction of asparagine and aspartate degradation sites in antibody variable regions. PLoS ONE. 2014;9:e100736. doi: 10.1371/journal.pone.0100736. - DOI - PMC - PubMed
    1. Chennamsetty N, Voynov V, Kayser V, Helk B, Trout BL. Design of therapeutic proteins with enhanced stability. Proc. Natl. Acad. Sci. U.S.A. 2009;106:11937–11942. doi: 10.1073/pnas.0904191106. - DOI - PMC - PubMed