. 2023 Mar 16;83(6):994-1011.e18.
doi: 10.1016/j.molcel.2023.01.023. Epub 2023 Feb 17.

Evolutionary origins and interactomes of human, young microproteins and small peptides translated from short open reading frames

Affiliations

Evolutionary origins and interactomes of human, young microproteins and small peptides translated from short open reading frames

Clara-L Sandmann et al. Mol Cell. .

Abstract

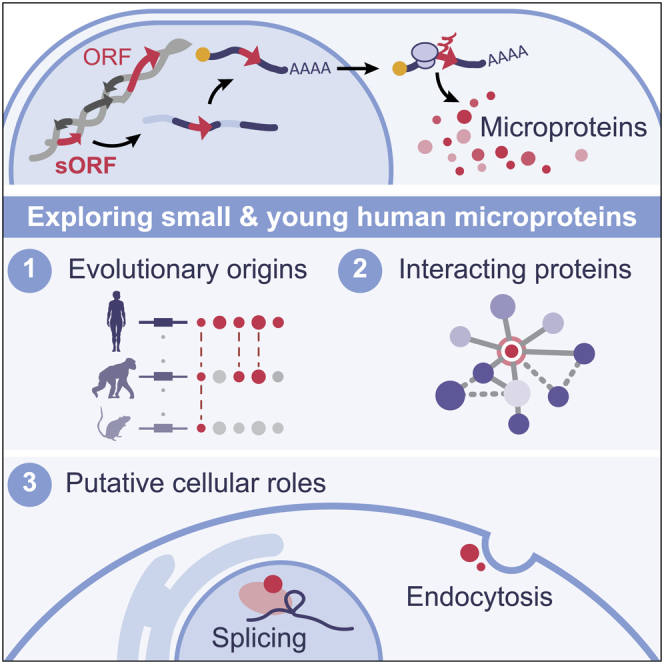
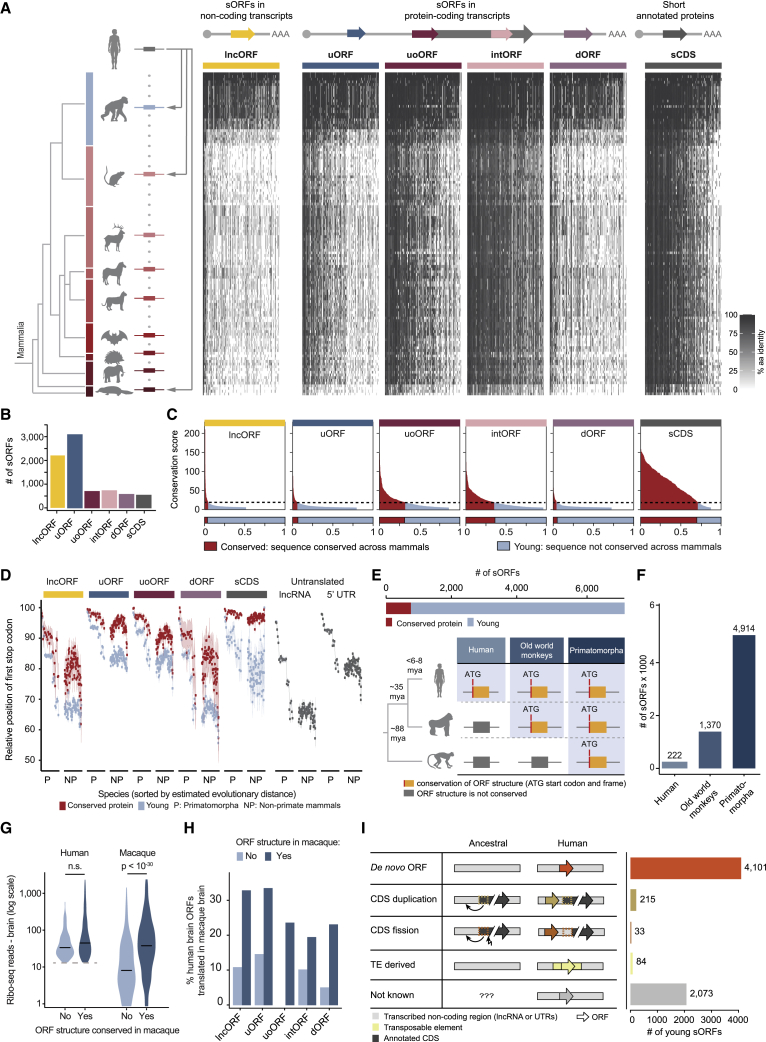
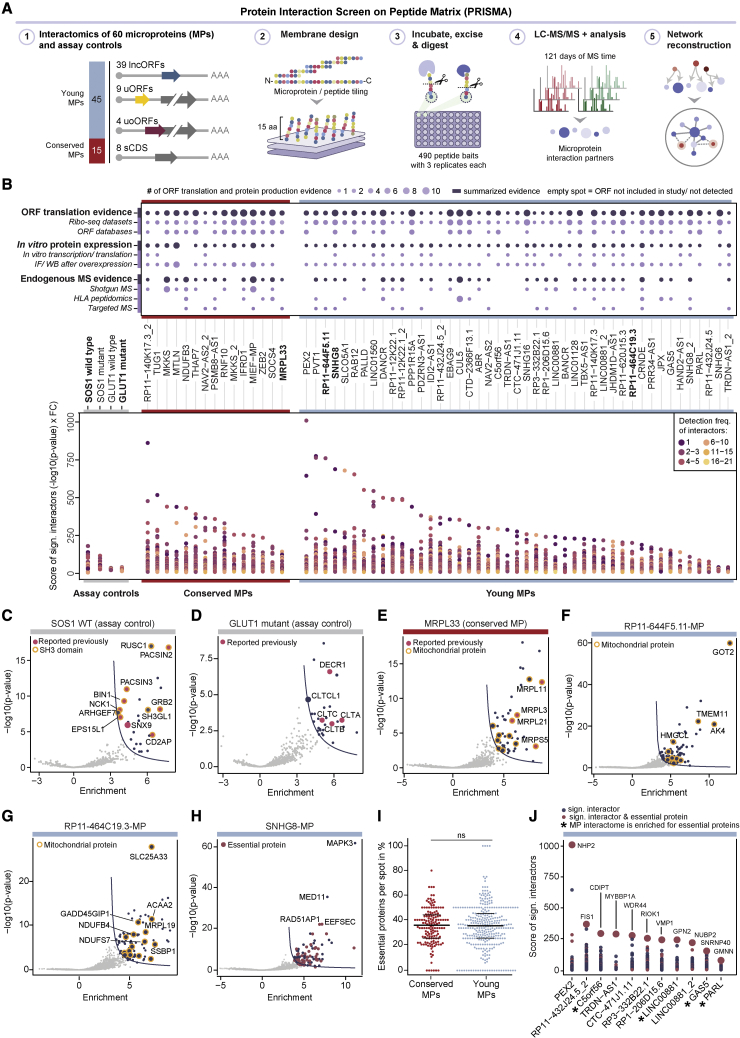
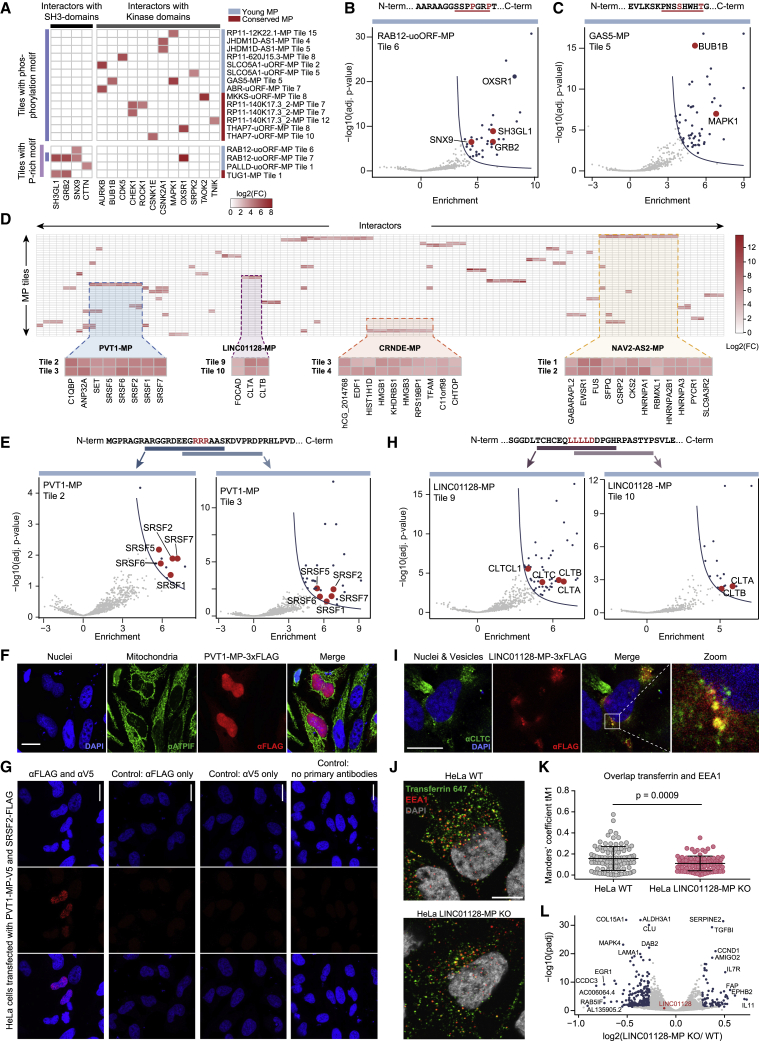
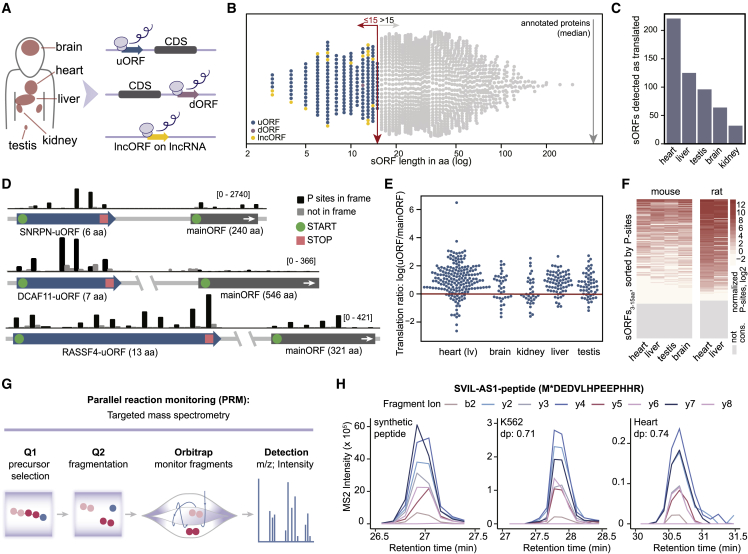
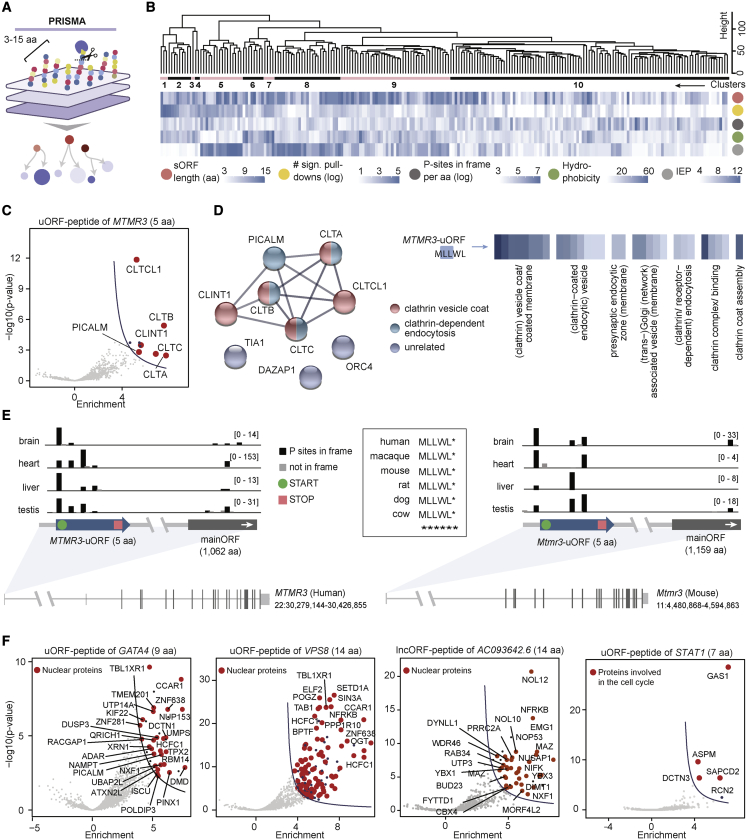
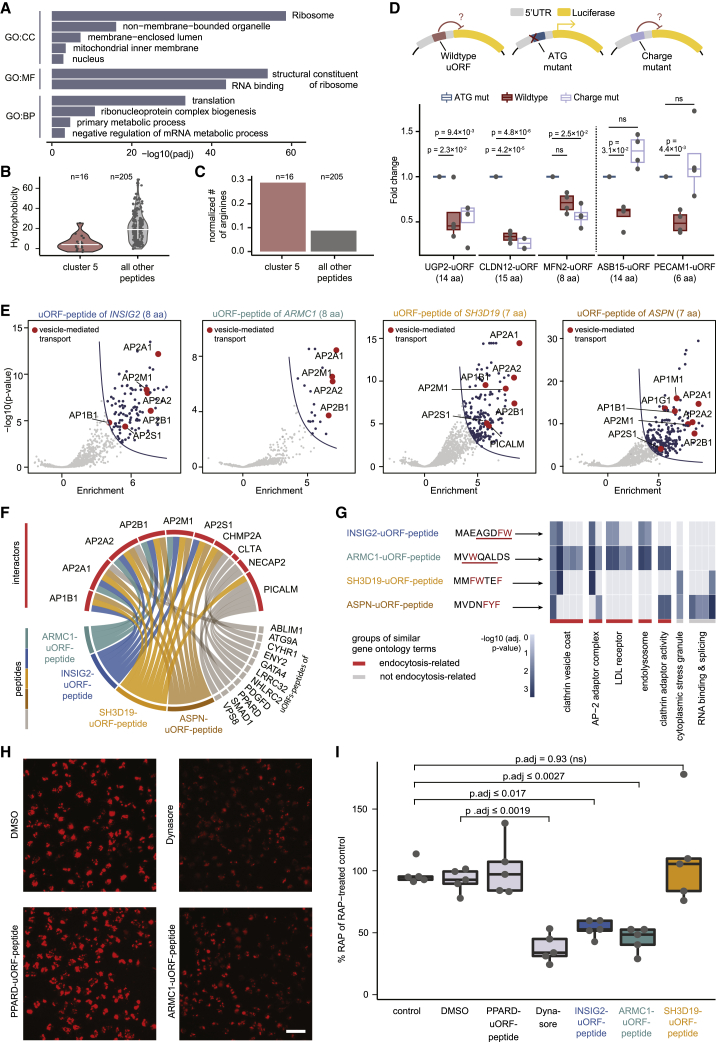
All species continuously evolve short open reading frames (sORFs) that can be templated for protein synthesis and may provide raw materials for evolutionary adaptation. We analyzed the evolutionary origins of 7,264 recently cataloged human sORFs and found that most were evolutionarily young and had emerged de novo. We additionally identified 221 previously missed sORFs potentially translated into peptides of up to 15 amino acids-all of which are smaller than the smallest human microprotein annotated to date. To investigate the bioactivity of sORF-encoded small peptides and young microproteins, we subjected 266 candidates to a mass-spectrometry-based interactome screen with motif resolution. Based on these interactomes and additional cellular assays, we can associate several candidates with mRNA splicing, translational regulation, and endocytosis. Our work provides insights into the evolutionary origins and interaction potential of young and small proteins, thereby helping to elucidate this underexplored territory of the human proteome.

Keywords: PRISMA; de novo genes; microproteins; primate-specific proteins; protein evolution; protein interactome; ribosome profiling; short ORFs; short linear motifs, SLiMs; short peptides.


Conflict of interest statement

Declaration of interests The authors declare no competing interests.

Figures

None
Graphical abstract
Figure 1
Figure 1
Most human sORFs are young and have emerged de novo (A) Phylogenetic tree of the mammalian taxa comprising 120 mammalian species used for sORF genomic alignments (n = 7,264). sORFs were classified into lncRNA-ORFs (lncORFs), upstream ORFs (uORFs), upstream overlapping ORFs (uoORFs), internal ORFs (intORFs), and downstream ORFs (dORFs). For comparison, we included 527 sCDS. The heatmap displays the pairwise aa identity (%) of all sORFs and sCDSs (columns) across the 120 species’ genomes (rows). (B) Numbers of evaluated sORFs and sCDS separated by ORF biotype. (C) Conservation scores (CSs) calculated across non-primate mammalian species. Dotted lines represent the CS cutoff of 8 (STAR Methods). sORFs and sCDS with (red) or without (light blue) significant protein sequence conservation are displayed below. (D) Dot plots displaying the average and 95% confidence interval of sORF, sCDS, and untranslated ORF truncation introduced by the most upstream stop codon in the aligned counterpart regions of the sequences. sORFs are divided by biotype and conservation of aa sequences. Internal sORFs (intORFs) were not considered due to additional constraints acting to preserve the frame of the sequence. (E) Top: total numbers of conserved (CS ≥ 8) and young sORFs (CS < 8). Bottom: schematic of the classification of young sORFs (n = 6,506) based on conservation of ORF structures. We defined three levels of conservation: humans, old world monkeys, and primatomorpha. (F) Numbers of evolutionarily young sORFs per level of conservation of ORF structures. (G) Violin plots with the numbers of human (left) and macaque (right) brain Ribo-seq reads mapped to human brain translated ORFs (n = 830), by absence (light blue) or presence (dark blue) of conservation in macaque. Statistical differences were assessed by Wilcoxon signed-rank test. Horizontal bars represent the median values. ns, not significant. (H) Percentages of sORFs translated in the human brain with aligned counterpart regions translated in macaque. sORFs are divided by biotype and by the presence (dark blue) or absence (rlight blue) of conservation in macaques. (I) Schematic of modes of sORF evolution and numbers of young sORFs per category.
Figure 2
Figure 2
Interactome profiling of microproteins translated from young sORFs with PRISMA (A) Schematic of PRISMA including 60 microproteins and four assay controls. (B) Top: protein evidence per microprotein (Table S2). Bottom: conserved (red) and young (blue) microproteins were sorted based on the highest interaction score (product of fold change and p value). (C–H) Volcano plots with interactomes of the (C) SOS1 wild-type (WT) control peptide, (D) GLUT1 mutant control peptide, and (E) annotated mitochondrial microprotein MRPL33 (interactors from all tiles are summarized). Additional examples of conserved microproteins are shown in Figure S2M. Volcano plots of summarized interactome results of the three young microproteins (F) RP11-644F5.11-MP, (G) RP11-464C19.3-MP, and (H) SNHG8-MP, the latter being enriched for essential proteins (52 out of 106 interactors; padj = 0.00013; Fisher’s exact test). Additional examples of young microproteins are shown in Figure S2N. (I) Percentage of essential proteins detected in the interactomes of conserved and young microproteins. No statistical differences were found among both groups (assessed by two-tailed Student’s t test). The horizontal lines indicate 25%, 50%, and 75% quartiles, respectively. (J) Interaction scores for eleven young microproteins whose top interactor is an essential protein. Asterisks mark microprotein interactomes significantly enriched for essential proteins (assessed by Fisher’s exact test, FDR < 0.05) (Table S3).
Figure 3
Figure 3
SLiMs may drive microprotein-protein interactions (A) Heatmap with fold changes of kinases and SH3-domain-containing proteins that interact with microproteins carrying a phosphorylation/kinase-docking motif or a proline-rich motif. (B) Peptide sequence and volcano plot with PRISMA results of a RAB12-uoORF-MP-derived peptide carrying a proline-rich motif (underlined). SH3-domain-containing proteins are highlighted in red. (C) Peptide sequence and volcano plot with PRISMA results of the GAS5-MP-derived peptide carrying a phosphorylation motif (underlined). Kinases are highlighted in red. (D) Heatmap with fold changes of interactors detected in two overlapping peptides within one microprotein. Only microprotein tiles that share at least three interactors are plotted (Table S3). (E) Peptide sequences and volcano plots with PRISMA results of tile 2 and tile 3 of PVT1-MP. Splicing factors are highlighted in red. (F) Immunofluorescence stainings of FLAG-tagged PVT1-MP after overexpression in HeLa cells. Cell nuclei were stained with DAPI, mitochondria with anti-ATPIF1 antibody, and PVT1-MP-3xFLAG with anti-FLAG antibody. Scale bar represents 20 μm. (G) PLA in HeLa cells transfected with V5-tagged PVT1-MP and FLAG-tagged SRSF2. Red spots indicate PVT1-MP-V5 and SRSF2-FLAG interactions (additional images in Figure S3C). Cell nuclei were stained with DAPI. Controls: anti-FLAG single primary antibody only; anti-V5 single primary antibody only; both primary antibodies were omitted. As an additional control, the PLA was performed in untransfected HeLa cells (Figure S3C). Scale bar represents 20 μm. (H) Peptide sequences and volcano plots with PRISMA results of tile 9 and tile 10 of LINC01128-MP. Tile 10 lacks the first amino acid of the clathrin box motif. Clathrins are highlighted in red. (I) Immunofluorescence stainings of FLAG-tagged LINC01128-MP after overexpression in HeLa cells. Cell nuclei were stained with DAPI, mitochondria with anti-ATPIF1 antibody, CLTC with anti-CLTC antibody, and LINC01128-MP-3xFLAG with anti-FLAG antibody. Scale bar represents 20 μm. (J) Representative images of fluorescently labeled transferrin (green) and EEA1 (red) detection in HeLa WT and LINC01128-MP knockout (KO) cells. Cell nuclei were stained with DAPI (gray) and EEA1 with anti-EEA1 antibody. Scale bar represents 10 μm. Images with lower magnification are shown in Figure S3H. (K) Beeswarm plot for quantification of transferrin and EEA1 co-localization in HeLa WT and LINC01128-MP KO cells using Manders’ coefficient tM1. Each dot represents one analyzed cell. Per experiment, an average of 30 cells were quantified (n = 3). Statistical significance was determined using Student’s t test. (L) Volcano plot depicting significantly differentially expressed genes (in blue, −0.26 ≤ log2(FC) ≥ 0.26, padj = 0.05) in RNA-seq data of wild-type versus LINC01128-MP KO cells. LINC01128 is highlighted in red and its transcript levels are not differentially expressed between wild-type and KO cells (padj = 0.15); also see Figure S3H.
Figure 4
Figure 4
sORFs smaller than 16 aa (sORFs3–15 aa) are highly translated in multiple tissues and often conserved across mammals (A) Detection of 221 candidate sORFs3–15 aa using ribosome profiling in five human tissues. (B) Distribution of sORF3–15 aa length separated by sORF biotype and source (gray: GENCODE catalog). (C) Numbers of sORFs called in each human tissue. (D) Genomic view of three loci with uORFs3–15 aa and the respective mainORFs. The gene orientation of SNRPN was reversed for clarity. (E) Ratio of P-sites per aa of the uORFs3–15 aa versus their respective mainORFs. (F) Normalized P-sites for all candidate sORFs3–15 aa whose structures are mapped and conserved in mouse (n = 166) and rat (n = 150). Gray bars represent sORFs3–15 aa without conserved structures or with a length of less than 70% of the human ORF. Heatmaps are individually sorted by mean P-sites of the respective tissues. (G) Schematic of the PRM-MS assay. (H) Peptide sequence and chromatograms of fragment ions from synthetic and endogenous signature peptides of the SVIL-AS1-peptide3–15 aa in K562 cells and the human heart. The star represents the oxidation of methionine. The dot product (dp) indicates the similarity to the matching spectrum of the synthetic peptide and ranges from 0 to 1 with higher scores indicating better similarities. We note that the detected peptide also matches an alternative microprotein isoform of SVIL-AS1 of 81 aa (Table S4).
Figure 5
Figure 5
Peptides encoded by sORFs3–15 aa have distinct interaction profiles (A) Schematic of the PRISMA approach with all 221 sORF-encoded peptides3–15 aa. (B) Hierarchical clustering of the enrichment values of all interacting proteins per peptide3–15 aa (STAR Methods). Factors potentially influencing the clustering (length, number of pull-downs per peptide3–15 aa [logarithmic scale], in-frame P-sites per aa [logarithmic scale], hydrophobicity, and isoelectric point) are depicted below the heatmap. (C) Volcano plot of the peptide encoded by MTMR3-uORF. Proteins assigned to the GO term clathrin-dependent endocytosis (GO:0072583) as well as the clathrin-binding protein CLINT1 are highlighted in red. (D) Left: string network of all significantly bound proteins of the MTMR3-uORF-peptide. Lines indicate confidence based on experiments, databases, and co-occurrence; high confidence (0.7). Right: MTMR3-uORF-peptide sequence (di-leucine motif highlighted) and GO enrichment analysis of its interactors. (E) Genomic view and sequence alignment of the highly conserved MTMR3-uORF locus in four human (left) and four mouse (right) tissues., (F) Volcano plots summarizing the PRISMA results of the peptides3–15 aa translated from GATA4-uORF, VPS8-uORF, AC093642.6-lncORF, and STAT1-uORF.
Figure 6
Figure 6
Peptide interactomes can predict modulators of cellular functions (A) GO enrichment analysis of all interacting proteins of 16 ribosome-binding peptides3–15 aa compared with all other peptides. (B) Violin plot with hydrophobicity values of the 16 ribosome-binding peptides3–15 aa compared with all other peptides3–15 aa. Horizontal lines indicate the mean ± standard deviation. (C) Number of arginines of the 16 ribosome-binding peptides3–15 aa compared with all other peptides3–15 aa, normalized to the total number of amino acids. (D) Schematic and results of the luciferase reporter assay performed with five randomly selected ribosome-binding peptides3–15 aa. The significance was calculated using ANOVA and Tukey post hoc test. (E) Volcano plots of four AP-binding peptides3–15 aa. Proteins assigned to the GO term vesicle-related transport (GO:0016192) are highlighted in red. (F) Circos plot of all peptides3–15 aa that interact with endocytic proteins. (G) Peptide sequences of the four AP-binding peptides3–15 aa (aromatic aa highlighted in red, di-hydrophobic motifs underlined) and GO enrichment analysis of their interactomes. (H) Representative immunofluorescence images of fluorescently labeled RAP internalized by BN16 cells treated with DMSO, dynasore, PPARD- and ARMC1-uORF-peptide, respectively. Scale bar represents 200 μm. (I) Results of the RAP endocytosis assay (five replicates per condition). Values were normalized to total protein content, and samples without RAP treatment were subtracted and then normalized to the treatment with RAP only (=100%). The PPARD-uORF-peptide, which did not bind APs, was included as a control (Figure S6J). The statistical significance was calculated using ANOVA and Tukey post hoc test.

References

    1. Ingolia N.T., Ghaemmaghami S., Newman J.R.S., Weissman J.S. Genome-wide analysis in vivo of translation with nucleotide resolution using ribosome profiling. Science. 2009;324:218–223. - PMC - PubMed
    1. Mudge J.M., Ruiz-Orera J., Prensner J.R., Brunet M.A., Calvet F., Jungreis I., Gonzalez J.M., Magrane M., Martinez T.F., Schulz J.F., et al. Standardized annotation of translated open reading frames. Nat. Biotechnol. 2022;40:994–999. - PMC - PubMed
    1. Wright B.W., Yi Z., Weissman J.S., Chen J. The dark proteome: translation from noncanonical open reading frames. Trends Cell Biol. 2022;32:243–258. - PMC - PubMed
    1. Makarewich C.A., Olson E.N. Mining for micropeptides. Trends Cell Biol. 2017;27:685–696. - PMC - PubMed
    1. Prensner J.R., Enache O.M., Luria V., Krug K., Clauser K.R., Dempster J.M., Karger A., Wang L., Stumbraite K., Wang V.M., et al. Noncanonical open reading frames encode functional proteins essential for cancer cell survival. Nat. Biotechnol. 2021;39:697–704. - PMC - PubMed

Publication types