. 2023 Feb 20;14(1):937.
doi: 10.1038/s41467-023-36520-1.

Four-dimensional trapped ion mobility spectrometry lipidomics for high throughput clinical profiling of human blood samples

Affiliations

Four-dimensional trapped ion mobility spectrometry lipidomics for high throughput clinical profiling of human blood samples

Raissa Lerner et al. Nat Commun. .

Abstract

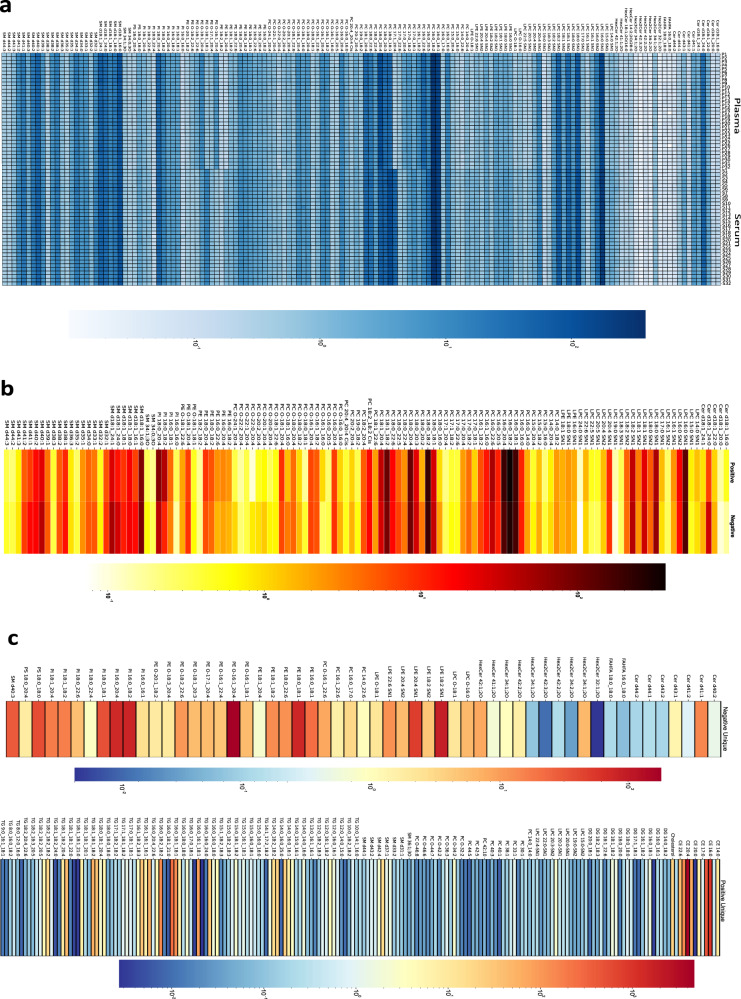
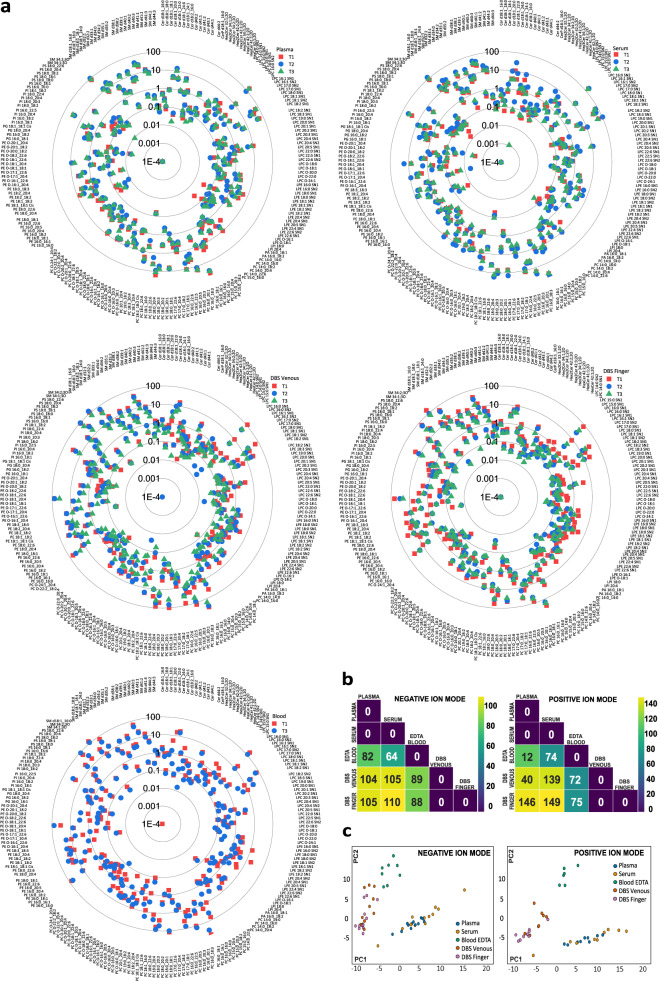
Lipidomics encompassing automated lipid extraction, a four-dimensional (4D) feature selection strategy for confident lipid annotation as well as reproducible and cross-validated quantification can expedite clinical profiling. Here, we determine 4D descriptors (mass to charge, retention time, collision cross section, and fragmentation spectra) of 200 lipid standards and 493 lipids from reference plasma via trapped ion mobility mass spectrometry to enable the implementation of stringent criteria for lipid annotation. We use 4D lipidomics to confidently annotate 370 lipids in reference plasma samples and 364 lipids in serum samples, and reproducibly quantify 359 lipids using level-3 internal standards. We show the utility of our 4D lipidomics workflow for high-throughput applications by reliable profiling of intra-individual lipidome phenotypes in plasma, serum, whole blood, venous and finger-prick dried blood spots.


Conflict of interest statement

The authors declare no competing interests.

Figures

Fig. 1
Fig. 1. Comparison of automated vs manual extraction of NIST human plasma standard reference material (SRM) and assessment of analysis reproducibility.
a Direct comparison of automated vs manual extraction. Depicted are analyte peak areas, normalized to respective internal standard (ISTD) peak areas, of representative lipids for each analyzed lipid class, whose extraction was either manual (light blue dots, empty bars) or automated (dark blue dots, blue bars) from NIST plasma SRM. Each dot represents an independent extraction (n = 8). Black numbers indicate the coefficient of variation (CV) values for manual extraction, whereas blue values indicate CV for automated extraction. Two-tailed multiple unpaired t-test with multiple comparison correction (Holm–Sidak method) was used (tPS 36:0(14) = 4.111, p = 0.012630; tCholesterol(14) = 4.424, p = 0.007482). Bars represent mean values ± standard deviation (SD). *p < 0.05; **p < 0.01. b Depicted are values from representative lipid species extracted from NIST plasma SRM, normalized to their corresponding ISTDs. Measurement was conducted in negative ion mode. The displayed numbers show the CV. Each dot represents an independent extraction (n = 32). Bars represent mean values ± (SD). Source data are provided as a Source data file and in Supplementary Data 6.
Fig. 2
Fig. 2. Comparison of chromatographic vs mobility separation.
a Three-dimensional (m/z, collisional cross section (CCS), retention time (RT) (bubble size) distribution of identified lipids from NIST human plasma standard reference material (SRM) in negative (left) and positive (right) ion mode (average value of each dimension from n = 32 sample measurements in each mode). b Chromatogram and mobilogram traces for the separation of a 1:1 synthetic mixture of cis and trans phosphatidylcholine (PC) PC 18:1_18:1 and of cis and trans phosphatidylglycerol (PG) PG 18:1_18:1, run over the 20 min profiling method in neg ion mode. Source data are provided as a Source data file.
Fig. 3
Fig. 3. Confident annotation and feature selection.
a Scheme representing the workflow for the manual curation of all the features from a data set (negative ion mode) to the confident annotation of 193 lipid species and the identification of stable unique features. 15,899 features are obtained from the repetition analyses of the 32 NIST human plasma standard reference material (SRM) samples without applying rules for filtering of the features. 3013 features are found in 32 out of 32 analyses when the filter for recursive feature extraction is set to 1 out of 32. 1445 features are found in 32 out of 32 analyses when the filter for recursive feature extraction is set to 17 out of 32. 1436 features are present after background subtraction (methanol/Isopropanol sample). 1243 features are left after the subtraction of 193 annotated features (including internal standards (ISTDs)). 698 features overlap with the dilution experiment, with tolerance values set to <0.002 m/z, 0.1 retention time (RT), and 0.2 collisional cross section (CCS). 470 features out of the overlapping features exhibit a dilution response (Pearson correlation ≥0.9 and standard deviation of the mean values from the dilution experiment >0.1). The dilution experiment was performed in triplicates with n = 3 measurements per dilution step, ranging from 2–0.0625 µl plasma on the column. The box plots show median and mean values and 25% and 75% quartiles within a colored box. Gray whiskers indicate the lower and upper extremes. b The cubic plot shows CCS and RT as a function of m/z for all the features identified in a NIST plasma SRM. All the major identified lipid classes are shown with distinguishing-colored bubbles, whereas the unknown features are marked with gray bubbles. Source data are provided in Supplementary Data 3, 5, 6, and 15.
Fig. 4
Fig. 4. Bioanalytical method validation and quantification strategies.
a Concentration range and limit of detection (LOD) – limit of quantification (LOQ) of each lipid class determined using representative lipid standards in both ionization modes, that passed the accepted criterion of bioanalytical method validation for the LOD-LOQ determination. b Concentration of 125 lipid species in nmol/mL plotted against lipid species identified from the NIST human plasma standard reference material (SRM) samples processed on different days. The black and gray dots represent quantified values, using set 1 standards, from intra-day measurement (n = 32 extractions using 1 plate) and remeasurement (of the n = 32 extractions), respectively. Light and dark blue dots in the graph represent quantified values, using set 2 standards, from the inter-day extraction analysis (n = 32 extractions per plate; 2 plates), respectively. Gray coefficient of variation (CV) values indicate the variation in quantified values for the intra-day measurement (n = 32 extractions) combined with the remeasurement thereof (n = 64 equivalent to black and gray dots), blue CV values stand for the inter-day extraction (n = 64 samples equivalent to light and dark blue dots), and black CV values for the comparison of the first intra-day measurement (set 1 standards) (n = 32 samples) with the inter-day extraction (set 2 standards) (n = 64 samples equivalent to black, light and dark blue dots). c Concentration of 125 lipid species in nmol/mL plotted against lipid species identified from 32 NIST plasma SRM samples and quantified using multi- and one-point calibration. For the one-point calibration, various calibration points were compared. The red circles represent the quantified values via multi-point quantification whereas the gray, blue, and black triangles represent the quantified values via one-point quantification using 2nd, 4th, and 6th Calibrant point of Set 1 standards. Source data are provided as a Source data file and in Supplementary Data 6 and 7.
Fig. 5
Fig. 5. Comparison and cross-validation of quantified lipid concentrations.
a Heatmap visualization of the quantified values for 149 lipid species commonly identified between NIST human plasma and serum standard reference materials (SRMs) (n = 32 samples for each SRM). b Heatmap of the quantified values for 125 lipid species commonly identified in both ionization modes (n = 32 samples in each mode). c Ion mode unique lipid species. Heatmap visualization of the values obtained by the quantification of the lipids uniquely identified in negative (55) and positive (191) ion mode analysis of NIST plasma SRM (n = 32 samples in each mode). For each heatmap, log10 of the quantified values (nmol/mL) was used for the visualization. Source data are provided as a Source data file and in Supplementary Data 6.
Fig. 6
Fig. 6. Comparison and cross-validation of quantified lipid concentrations.
Comparison of the quantified lipid species between the positive and negative mode 4-Dimensional (4D) lipidomics (n = 32 samples in each mode) and multiple reaction monitoring (MRM) (n = 10 measurements) analysis. Source data are provided as a Source data file and in Supplementary Data 6.
Fig. 7
Fig. 7. Radar plot and statistical output for the quantified results from the negative mode in the LBlooD study.
a The radar plots represent the log10 concentration of the quantified lipid species in all five biological matrices for an individual over the three-time points. b The two-sided Wilcoxon signed-rank test output shows the similarities and dissimilarities between different biological matrices for an individual in negative ion mode (left) and positive ion mode (right). The color scale represents the index of similarity between any two biological matrices at a time with 0 representing similarity and the highest number representing the most dissimilarity. c Visualization of the first two principal components of the principal component analysis (PCA) to show the variability between biological matrices in negative ion mode (left) and positive ion mode (right). Source data are provided as a Source data file and in Supplementary Data 9 and 10.
Fig. 8
Fig. 8. Workflow of sample collection for the LBlooD study.
Schematic representation of the sampling and pre-processing strategy for lipid extraction from five different biological matrices in an individual. The same extraction procedure was followed for sample preparation on the 0th day, 1 week from the 0th day, and 1 month from the 0th day. This procedure was followed for the sample collection from all participating individuals in the study.

References

    1. Lobasso S, Lobaccaro J-MA, Angelini R. Editorial: The multifaceted roles of lipids in physiological and pathophysiological states. Front. Physiol. 2022;13:1–2. doi: 10.3389/fphys.2022.930962. - DOI - PMC - PubMed
    1. Chang C-Y, Ke D-S, Chen J-Y. Essential fatty acids and human brain. Acta Neurol. Taiwan. 2009;18:231–241. - PubMed
    1. Hazel JR, Williams E. E. The role of alterations in membrane lipid composition in enabling physiological adaptation of organisms to their physical environment. Prog. Lipid Res. 1990;29:167–227. doi: 10.1016/0163-7827(90)90002-3. - DOI - PubMed
    1. Gencer B, et al. Plasma ceramide and phospholipid-based risk score and the risk of cardiovascular death in patients after acute coronary syndrome. Eur. J. Prev. Cardiol. 2020;29:895–902. doi: 10.1093/eurjpc/zwaa143. - DOI - PubMed
    1. Hornemann T. Lipidomics in Biomarker Research. Handb. Exp. Pharm. 2022;270:493–510. doi: 10.1007/164_2021_517. - DOI - PubMed

Publication types