. 2023 Apr;10(10):e2204988.
doi: 10.1002/advs.202204988. Epub 2023 Feb 19.

Hypoxia-Induced FUS-circTBC1D14 Stress Granules Promote Autophagy in TNBC

Affiliations

Hypoxia-Induced FUS-circTBC1D14 Stress Granules Promote Autophagy in TNBC

Ying Liu et al. Adv Sci (Weinh). 2023 Apr.

Abstract

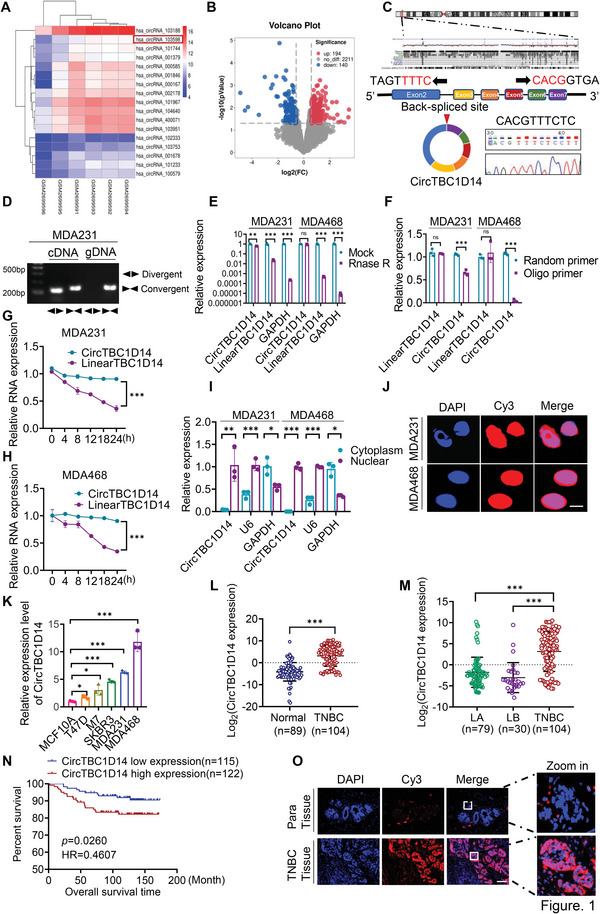
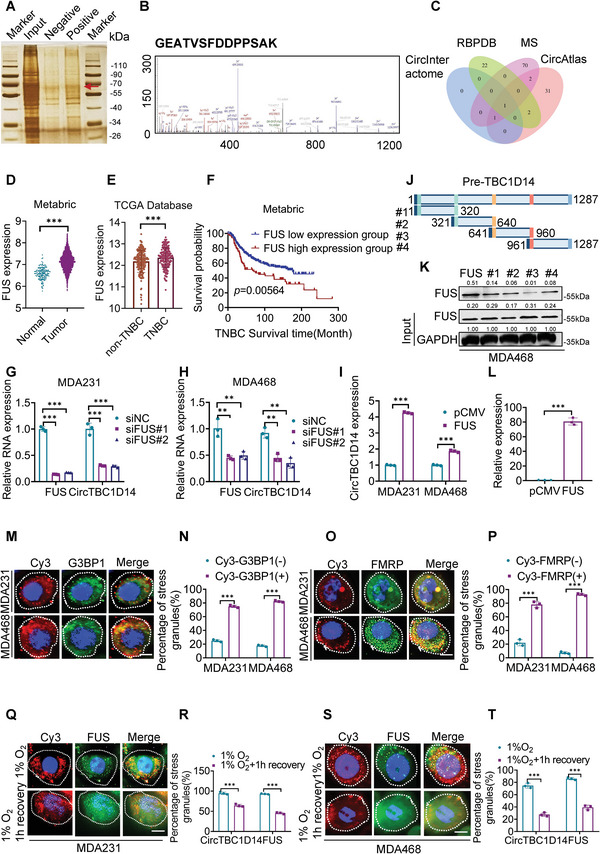
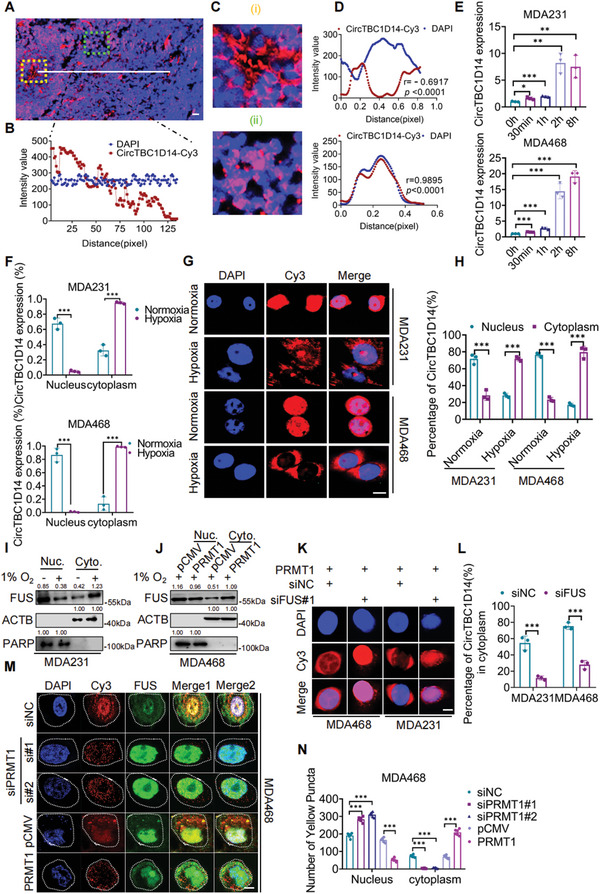
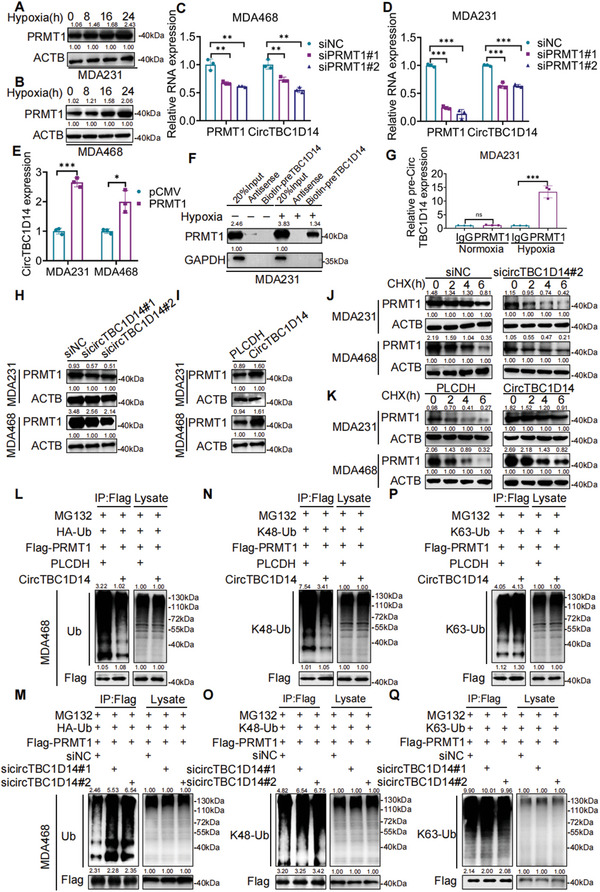
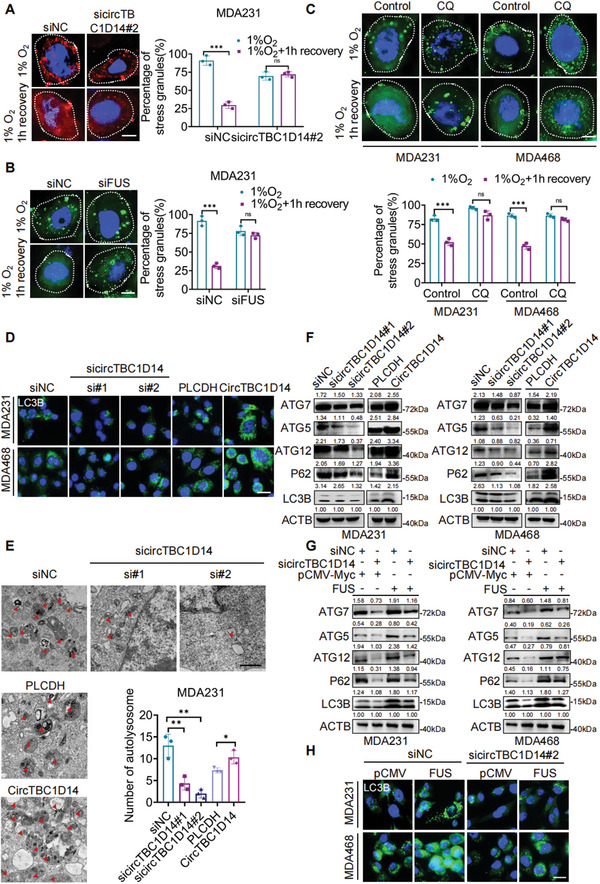
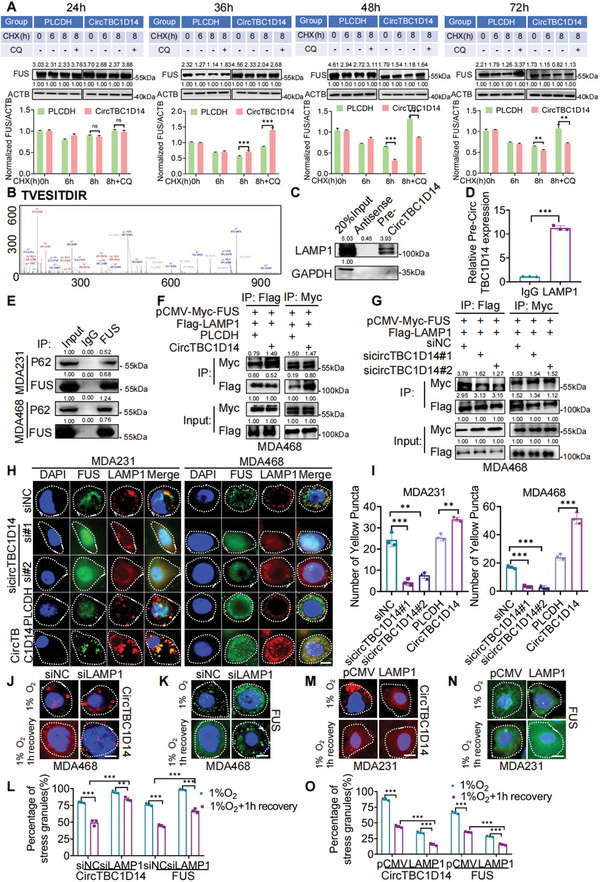
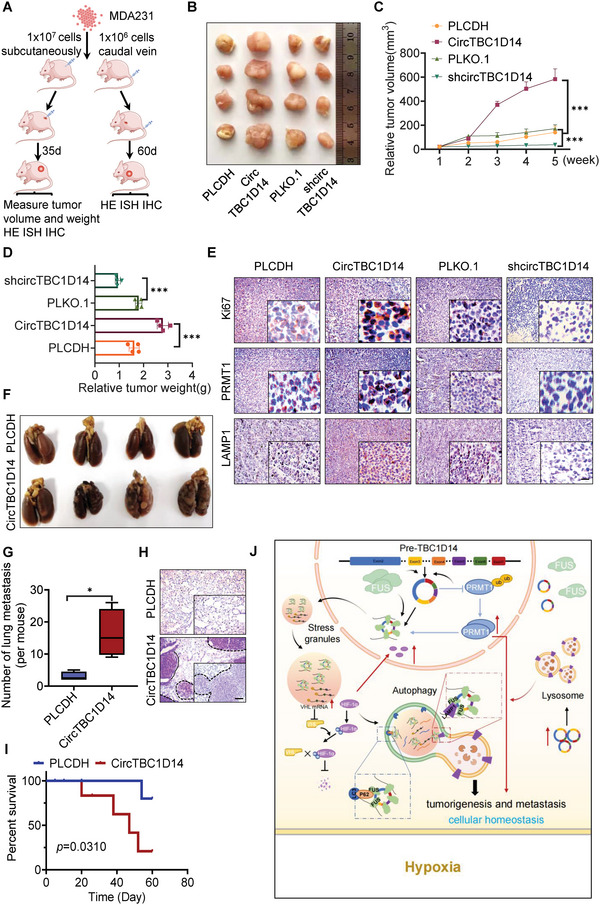
Triple-negative breast cancer (TNBC) is a highly aggressive subtype of breast cancer that is suggested to be associated with hypoxia. This study is the first to identify a novel circular RNA (circRNA), circTBC1D14, whose expression is significantly upregulated in TNBC. The authors confirm that high circTBC1D14 expression is associated with a poor prognosis in patients with breast cancer. circTBC1D14-associated mass spectrometry and RNA-binding protein-related bioinformatics strategies indicate that FUS can interact with circTBC1D14, which can bind to the downstream flanking sequence of circTBC1D14 to induce cyclization. FUS is an essential biomarker associated with stress granules (SGs), and the authors find that hypoxic conditions can induce FUS-circTBC1D14-associated SG formation in the cytoplasm after modification by protein PRMT1. Subsequently, circTBC1D14 increases the stability of PRMT1 by inhibiting its K48-regulated polyubiquitination, leading to the upregulation of PRMT1 expression. In addition, FUS-circTBC1D14 SGs can initiate a cascade of SG-linked proteins to recognize and control the elimination of SGs by recruiting LAMP1 and enhancing lysosome-associated autophagy flux, thus contributing to the maintenance of cellular homeostasis and promoting tumor progression in TNBC. Overall, these findings reveal that circTBC1D14 is a potential prognostic indicator that can serve as a therapeutic target for TNBC treatment.

Keywords: autophagy; circTBC1D14; fused in sarcoma (FUS); hypoxia; stress granule.


Conflict of interest statement

The authors declare no conflict of interest.

Figures

Figure 1
Figure 1
circTBC1D14 was significantly upregulated in TNBCs and contributed to the poor prognosis of patients. A) The circRNAs cluster heat map of TNBC tumor tissues and normal breast tissues. The red and blue strips indicated upregulated and downregulated circRNAs. B) The volcano plot of circRNAs expression profiles. C) Schematic diagram of circTBC1D14 formation by the circulation of exon2 to exon7 in TBC1D14 genes. The back‐spliced junction sequences of circTBC1D14 were validated by Sanger sequencing. D) Gel electrophoresis analysis to detect the existence of circTBC1D14 and TBC1D14 from gDNA and cDNA in MDA231 and MDA468 cells respectively. E) RT‐qPCR of total RNA with or without RNase R treatment in MDA231 and MDA468 cells with convergent and divergent primers. two‐tailed unpaired t‐test. F) Reverse transcription experiments with random hexamer or oligo dT primers in MDA231 and MDA468 cells. Two‐tailed unpaired t‐test. G,H) RT‐qPCR assay with Actinomycin D treatments of circTBC1D14 and linear TBC1D14 in MDA231 and MDA468 cells. Two‐tailed unpaired t‐test. I) RT‐qPCR of the relative distribution of circTBC1D14 in MDA231 and MDA468 cells. U6 served as the nuclear RNA marker and GAPDH served as the cytoplasmic RNA marker. Two‐tailed unpaired t‐test. J) RNA fluorescence in situ hybridization (FISH) of circTBC1D14 in MDA231 and MDA468 cells. The red region showed the distribution of the circTBC1D14 probe, and the blue region showed the nuclei staining by DAPI. Scale bar, 10 µm. K) RT‐qPCR analysis of circTBC1D14 expression in different breast cancer cells. two‐tailed unpaired t‐test. L) RT‐qPCR analysis of circTBC1D14 in normal tissues (n = 89) and TNBC tissues (n = 104) from Qilu hospital. Two‐tailed unpaired t‐test. M) RT‐qPCR analysis of circTBC1D14 in luminal A tissues (n = 79), luminal B tissues (n = 30), and TNBC tissues (n = 104) from Qilu hospital. Two‐tailed unpaired t‐test. N) Kaplan–Meier survival analysis of breast cancer patients from Qilu hospital according to the expression level of circTBC1D14 using the log‐rank test (n = 237). O) RNA FISH assays in human paired TNBC tissues and para tissues. The red region showed the distribution of the circTBC1D14 probe, and the blue region showed the nuclei staining by DAPI. Scale bar, 10 µm. The data are shown as the mean ± SD, NS (no significance) *p < 0.05 **p < 0.01, ***p < 0.001.
Figure 2
Figure 2
FUS regulated the back splicing of circTBC1D14 and contributed to hypoxia‐induced stress granules formation with circTBC1D14. A) Silver staining images of PAGE gels of circTBC1D14/proteins complex from pull‐down experiments of MDA231 cells. The red arrow represented the specific protein bands in the pull‐down complex by circTBC1D14 sense sequence compared with the antisense sequence. B) The peak map of FUS from the RNA pull‐down mass spectrometry. C) Venn diagram of the bioinformatic strategies from indicated databases and our RNA pulldown mass spectrometry. D) FUS expression analysis in the Metabric database. Two‐tailed unpaired t‐test. E) FUS expression analysis in TCGA database. Two‐tailed unpaired t‐test. F) Kaplan–Meier survival analysis of breast cancer patients from the Metabric database according to the expression level of FUS using the log‐rank test (n = 419). G and H) RT‐qPCR of circTBC1D14 and FUS expression with FUS silence in MDA231 and MDA468 cells. Two‐tailed unpaired t‐test. I) RT‐qPCR of circTBC1D14 expression with FUS overexpression in MDA231 and MDA468 cells. Two‐tailed unpaired t‐test. J) Schematic diagram of truncated pre‐TBC1D14 biotin‐labeled probes. K) Western blot of RNA pull‐down assays. L) RT‐qPCR analysis of RNA immunoprecipitation (RIP) assay in MDA231 cells. Two‐tailed unpaired t‐test. M,N) Immunofluorescence of endogenous circTBC1D14 and SGs (G3BP1) after 8 h hypoxic treatment in MDA231 and MDA468 cells. Right, quantification of the percentage of SGs (G3BP1+) co‐localizing with foci of circTBC1D14. Scale bar, 10 µm. Two‐tailed unpaired t‐test. O,P) Immunofluorescence of endogenous circTBC1D14 and SGs (FMRP) after 8 h hypoxic treatment in MDA231 and MDA468 cells. Right, quantification of the percentage of SGs (G3BP1+) co‐localizing with foci of circTBC1D14. Scale bar, 10 µm. Two‐tailed unpaired t‐test. Q,R) Immunofluorescence of endogenous circTBC1D14 and SGs (FUS) after 8 h hypoxic treatment or 1 h after removal of hypoxia. Right, the percentage of circTBC1D14 and FUS in MDA231cells containing SGs 8 h hypoxic treatment, or 1 h after removal of hypoxia. Scale bar, 10 µm. Two‐tailed unpaired t‐test. S,T) Immunofluorescence of endogenous circTBC1D14 and SGs (FUS) after 8 h hypoxic treatment or 1 h after removal of hypoxia. Right, the percentage of circTBC1D14 and FUS in MDA231 cells containing SGs 8 h hypoxic treatment, or 1 h after removal of hypoxia. Scale bar, 10 µm. Two‐tailed unpaired t‐test. The data are shown as the mean ± SD, NS (no significance) *p < 0.05 **p < 0.01, ***p < 0.001.
Figure 3
Figure 3
Hypoxia‐induced PRMT1 contributed to subcellular localization and formation of FUS‐circTBC1D14‐associated stress granules. A,B) FISH of xenografts in nude mice with circTBC1D14. Scale bars = 50 µm. Right, the intensity variability is calculated with ImageJ. The red region showed the distribution of the circTBC1D14 probe, and the blue region showed the nuclei staining by DAPI. C,D) circTBC1D14 staining in different areas of sections from (A). The yellow region indicates the center of the tumor simulating the hypoxic area, while the green region indicates the margin of the tumor simulating the normoxic area. Right, the intensity variability of the yellow region and green region is calculated with ImageJ. E) RT‐qPCR analysis of circTBC1D14 with hypoxia in time gradient in MDA231 and MDA468 cells. Two‐tailed unpaired t‐test. F) Relative distribution of circTBC1D14 in MDA231 and MDA468 cells with hypoxia treatment or not determined by RT‐qPCR. U6 served as the nuclear RNA marker and GAPDH served as the cytoplasmic RNA marker. Two‐tailed unpaired t‐test. G,H) RNA FISH assays of circTBC1D14 in MDA231 and MDA468 cells. The red region showed the distribution of the circTBC1D14 probe, and the blue region showed the nuclei staining by DAPI. Scale bar, 10 µm. Right, statistic diagram. Two‐tailed unpaired t‐test. I) Western blot of FUS relative distribution in normoxic or hypoxic conditions. J) Western blot of FUS relative distribution with PRMT1 overexpression or not. K,L) FISH of circTBC1D14 in PRMT‐stable expression of MDA231 and MDA468 cells with FUS knockdown or not in hypoxic conditions. Right, statistic diagram. Scale bar, 10 µm. Two‐tailed unpaired t‐test. M,N) Immunofluorescence of co‐localized FUS‐circTBC1D14 SGs in MDA468 cells with PRMT1 overexpression or knockdown in hypoxic conditions. Right, statistic diagram. Scale bar, 10 µm. Two‐tailed unpaired t‐test. The data are shown as the mean ± SD, NS (no significance) *p < 0.05 **p < 0.01, ***p < 0.001.
Figure 4
Figure 4
CircTBC1D14 facilitated TNBC progression by inhibiting the ubiquitination and degradation of PRMT1 in hypoxic conditions. A,B) Western blot of PRMT1 with hypoxia treatments. Right, protein gray values of PRMT1 and ACTB were calculated with ImageJ. C–E) Quantitative real‐time PCR analysis of RNA expression in MDA468 or MDA231 cells with PRMT1 overexpression or knockdown. Statistical significance was determined by a two‐tailed unpaired t‐test. F) Western blot of RNA pull‐down assays. G) RT‐qPCR analysis of RNA immunoprecipitation (RIP) assay in MDA231 cells. Two‐tailed unpaired t‐test. H,I) Western blot analysis of circTBC1D14 overexpression or knockdown in MDA231 and MDA468 cells. J,K) Western blot analysis of the half‐life of PRMT1 in MDA231 and MDA468 cells transfected with circTBC1D14 overexpression or knockdown treated with the protein synthesis inhibitor CHX (400 µg mL−1). L–Q) Ubiquitination of exogenous PRMT1 in MDA468 cells transfected with indicated plasmids based on circTBC1D14 overexpression (up) or circTBC1D14 knockdown (below) with MG132 (20 um) pretreatment. Western blot was detected with indicated antibodies. The data are shown as the mean ± SD, NS (no significance) *p < 0.05 **p < 0.01, ***p < 0.001.
Figure 5
Figure 5
FUS‐circTBC1D14 stress granules contributed to lysosome‐associated autophagy flux. A) Immunofluorescence of SGs (G3BP1) in MDA231 cells with control or sicircTBC1D14 after 8 h hypoxic treatment or 1 h after removal of hypoxia. Right, percentage of cells containing SGs in cells. Scale bar, 10 µm. Two‐tailed unpaired t‐test. B) Immunofluorescence of SGs (G3BP1) in MDA231 cells with control or siFUS after 8 h hypoxic treatment or 1 h after removal of hypoxia. Right, percentage of cells containing SGs in cells. Scale bar, 10 µm. Two‐tailed unpaired t‐test. C) Immunofluorescence of SGs (G3BP1) in MDA231 cells with control or chloroquine (CQ) after 8 h hypoxic treatment, or 1 h after removal of hypoxia. Below, is the percentage of cells containing SGs in cells. Scale bar, 10 µm. Two‐tailed unpaired t‐test. D) Immunofluorescence of LC3B in MDA231 and MDA468 cells with circTBC1D14 overexpression or knockdown. Scale bar, 20 µm. E) Electron microscopy images of MDA231 cells with circTBC1D14 overexpression or knockdown. Scale bar,500 nm. Statistical diagram of autolysosomes in E). Two‐tailed unpaired t‐test. F) Western blot of MDA231 and MDA468 cells with circTBC1D14 overexpression or knockdown. G) Western blot of MDA231 and MDA468 cells with circTBC1D14 knockdown while with FUS overexpression. H) Immunofluorescence of LC3B in MDA231 and MDA468 cells with circTBC1D14 knockdown while with FUS overexpression. Scale bar, 20 µm. The data are shown as the mean ± SD, NS (no significance) *p < 0.05 **p < 0.01, ***p < 0.001.
Figure 6
Figure 6
CircTBC1D14 facilitated lysosome‐associated autophagy flux as a scaffold to reinforce the interaction between FUS and LAMP1. A) Western blot of MDA468 cells with circTBC1D14 and PLCDH expression following treatment with CHX or MG132. Below, are protein gray values of FUS normalized by ACTB. B) The peak map of LAMP1 from the RNA pull‐down mass spectrometry. C) Western blot of RNA pull‐down assays pretreated with hypoxia. D) RT‐qPCR analysis of RNA immunoprecipitation (RIP) assay in MDA468 cells pretreated with hypoxia. Two‐tailed unpaired t‐test. E) Co‐IP assay of FUS and P62 in MDA231 and MDA468 cells in hypoxic conditions. F,G) Co‐IP assay of LAMP1 and FUS in MDA468 cells with circTBC1D14 overexpression or circTBC1D14 knockdown pretreated with hypoxia. H) Immunofluorescence of co‐localized FUS and LAMP1 with circTBC1D14 overexpression or knockdown in MDA231 and MDA468 cells pretreated with hypoxia. Scale bar, 10 µm. I) Statistical diagram of yellow puncta in (H). J–L) Immunofluorescence of SGs (circTBC1D14 or FUS) in MDA468 cells with control or siLAMP1 after 24 h hypoxic treatment or 1 h after removal of hypoxia. Scale bar, 20 µm. Percentage of cells containing SGs (circTBC1D14 or FUS) in cells. Two‐tailed unpaired t‐test. M–O) Immunofluorescence of SGs (circTBC1D14 or FUS) in MDA468 cells with control or LAMP1 overexpression after 24 h hypoxic treatment or 1 h after removal of hypoxia. Scale bar, 20 µm. Percentage of cells containing SGs (circTBC1D14 or FUS) in cells. Two‐tailed unpaired t‐test. The data are shown as the mean ± SD, NS (no significance) *p < 0.05 **p < 0.01, ***p < 0.001.
Figure 7
Figure 7
CircTBC1D14 promoted tumor growth and lung metastasis in vivo. A) Schematic diagram of xenografts in BALB/c nude mice by inoculating MDA231 cells co‐transfected with stable expression of PLCDH, circTBC1D14, sh‐NC, and sh‐circTBC1D14, respectively, at their flanks or tail vein injection. B) Representative images of xenograft tumors. (n = 4, each group). C) Mean tumor volumes on days gradient for each group of xenografts in nude mice. (n = 4, mean ± s.d). D) Tumor weight of each group of xenografts in nude mice. (n = 4, mean ± s.d) E) Immunohistochemistry (IHC) assay of protein expression of Ki‐67, PRMT1, and LAMP1 in tumors from each group of xenografts in nude mice. Scale bars = 100 µm. F) Representative images of pulmonary surface nodules. G) Statistical diagram of (F). H) Hematoxylin and eosin (H&E) of staining in pulmonary surface nodules of the indicated circTBC1D14 genotypes. Scale bars = 100 µm. I) Animal survival of circTBC1D14 overexpression and control group. (n = 8, each group). Log‐rank test. J) Schematic illustration of the roles and molecular mechanisms of circTBC1D14 in hypoxic conditions. CircTB1D14 could interact with FUS and PRMT1, which could induce circTBC1D14 cyclization and expression with hypoxia treatments. Then FUS‐circTBC1D14‐associated SGs were transferred to the cytoplasm after being modified by hypoxia‐induced PRMT1. In turn, circTBC1D14 increased the stability of PRMT1 by inhibiting its K48‐regulated polyubiquitination, leading to enhanced nucleus transport. Meanwhile, VHL mRNA could co‐localize in FUS‐circTBC1D14 positive‐stress granules, leading to an inhibition of VHL translation, which enhanced HIF‐1α overexpression and import to the nucleus. In addition, FUS‐circTBC1D14 could initiate a cascade of SGs‐linked proteins to recognize and control the elimination of stress granules (SGs) by recruiting LAMP1 and enhancing the lysosome‐associated autophagy flux in TNBC. The data are shown as the mean ± SD, NS (no significance) *p < 0.05 **p < 0.01, ***p < 0.001.

Similar articles

Cited by

References

    1. a) Siegel R. L., Miller K. D., Fuchs H. E., Jemal A., Ca‐Cancer J. Clin. 2021, 71, 7; - PubMed
    2. b) Pfeiffer R. M., Webb‐Vargas Y., Wheeler W., Gail M. H., Cancer Epidemiol., Biomarkers Prev. 2018, 27, 1214. - PMC - PubMed
    1. Collin L. J., Gaglioti A. H., Beyer K. M., Zhou Y., Moore M. A., Nash R., Switchenko J. M., Miller‐Kleinhenz J. M., Ward K. C., McCullough L. E., Cancer Epidemiol., Biomarkers Prev. 2021, 30, 53. - PMC - PubMed
    1. Sung H., Ferlay J., Siegel R. L., Laversanne M., Soerjomataram I., Jemal A., Bray F., Ca‐Cancer J. Clin. 2021, 71, 209. - PubMed
    1. Chung C. H., Lu K. Y., Lee W. C., Hsu W. J., Lee W. F., Dai J. Z., Shueng P. W., Lin C. W., Mi F. L., Biomaterials 2020, 257, 120227. - PubMed
    1. Li J., Gao X., Zhang Z., Lai Y., Lin X., Lin B., Ma M., Liang X., Li X., Lv W., Lin Y., Zhang N., Mol Cancer 2021, 20, 138. - PMC - PubMed

Publication types

MeSH terms