. 2023 Feb 17;6(1):189.
doi: 10.1038/s42003-023-04565-z.

Copy number variation-associated lncRNAs may contribute to the etiologies of congenital heart disease

Affiliations

Copy number variation-associated lncRNAs may contribute to the etiologies of congenital heart disease

Yibo Lu et al. Commun Biol. .

Abstract

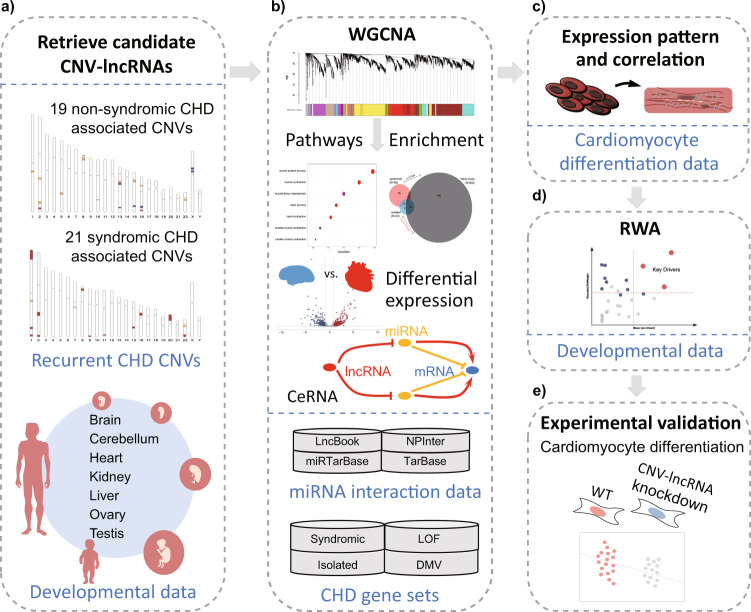
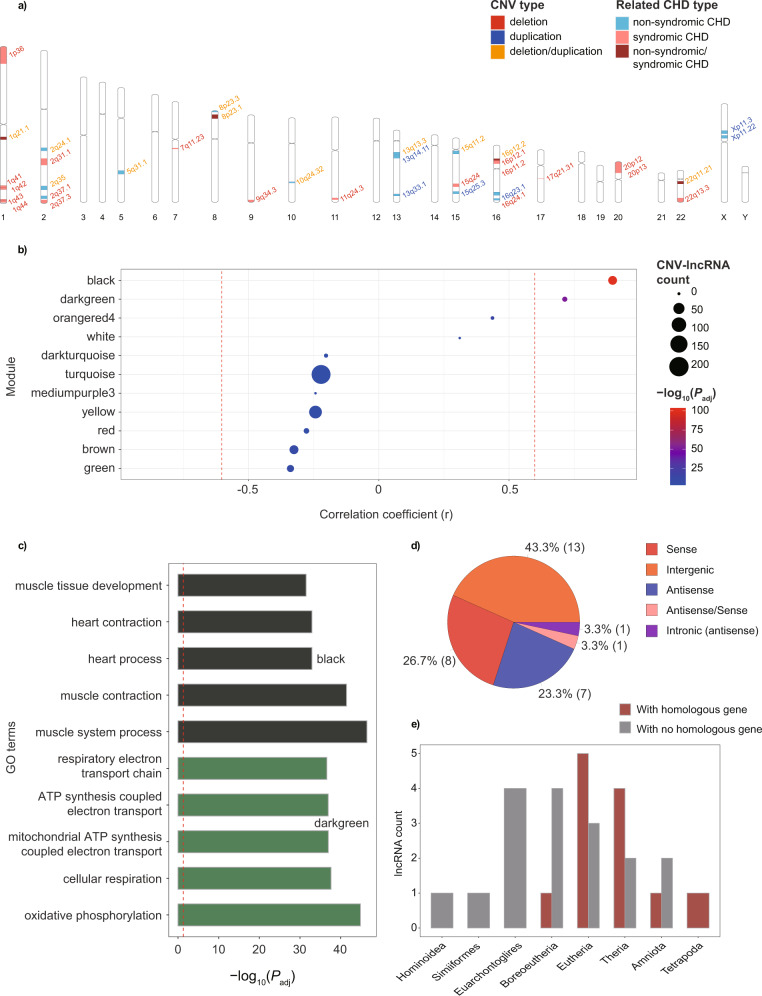
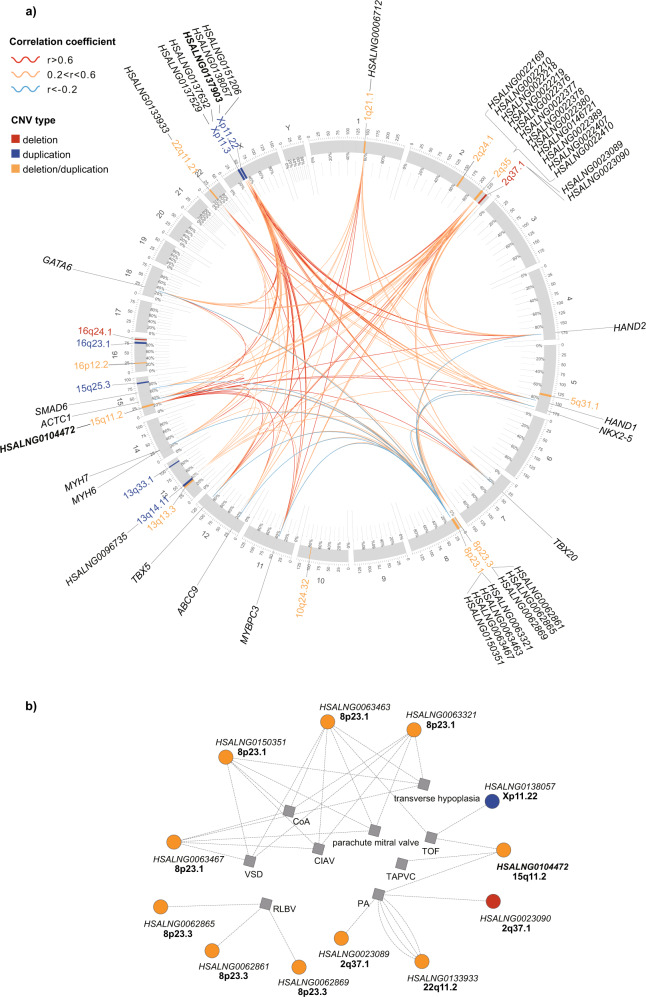
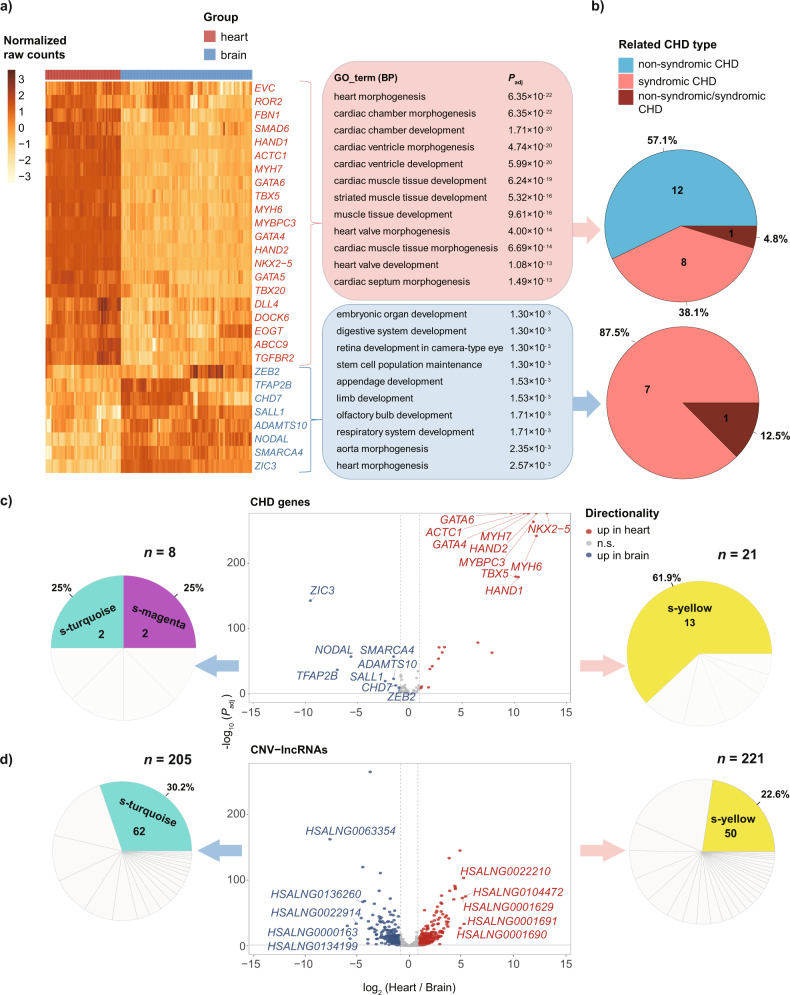
Copy number variations (CNVs) have long been recognized as pathogenic factors for congenital heart disease (CHD). Few CHD associated CNVs could be interpreted as dosage effect due to disruption of coding sequences. Emerging evidences have highlighted the regulatory roles of long noncoding RNAs (lncRNAs) in cardiac development. Whereas it remains unexplored whether lncRNAs within CNVs (CNV-lncRNAs) could contribute to the etiology of CHD associated CNVs. Here we constructed coexpression networks involving CNV-lncRNAs within CHD associated CNVs and protein coding genes using the human organ developmental transcriptomic data, and showed that CNV-lncRNAs within 10 of the non-syndromic CHD associated CNVs clustered in the most significant heart correlated module, and had highly correlated coexpression with multiple key CHD genes. HSALNG0104472 within 15q11.2 region was identified as a hub CNV-lncRNA with heart-biased expression and validated experimentally. Our results indicated that HSALNG0104472 should be a main effector responsible for cardiac defects of 15q11.2 deletion through regulating cardiomyocytes differentiation. Our findings suggested that CNV-lncRNAs could potentially contribute to the pathologies of a maximum proportion of 68.4% (13/19) of non-syndromic CHD associated CNVs. These results indicated that explaining the pathogenesis of CHD associated CNVs should take account of the noncoding regions.


Conflict of interest statement

The authors declare no competing interests.

Figures

Fig. 1
Fig. 1. Study workflow.
a 19 recurrent non-syndromic CHD and 21 syndromic CHD associated CNVs were summarized. We retrieved candidate CNV-lncRNAs which were located within these regions and expressed during heart development based on human organ developmental transcriptomic data (n = 313) from LncExpDB. b Weighted gene coexpression network analysis (WGCNA) was performed to characterize the coexpression profile of CNV-lncRNAs and protein coding genes based on human organ developmental transcriptomic data. Downstream analyses including pathways analyses, enrichment analyses and differential expression analyses were performed to identify CHD-associated modules and hub CNV-lncRNAs. CNV-lncRNA-miRNA-mRNA regulatory networks were also identified based on miRNA interaction data and competing endogenous RNA (ceRNA) molecular mechanism. c Coexpression relationships in heart-associated non-syndromic black module were validated based on in vitro cardiomyocyte differentiation datasets (n = 297) from LncExpDB. d Relative weight analysis (RWA) revealed strong roles of hub CNV-lncRNA HSALNG0104472 in regulating several key CHD genes. e In vitro experiments were performed to validate the predicted regulation of hub CNV-lncRNA HSALNG0104472.
Fig. 2
Fig. 2. Recurrent CHD associated CNV-lncRNAs in heart-correlated coexpression modules.
a Distribution of recurrent non-syndromic (n = 19) and syndromic CHD (n = 21) associated CNVs on human chromosomes are shown. The colors of the bands represent CHD case types in which CNVs were reported. The colors of the fonts represent CNV types. b Positively heart-correlated (r > 0.6, n = 2) coexpression modules (the black and darkgreen modules) constructed with human organ developmental dataset (n = 313) were identified (Supplementary Data 1). The y axis represents different CNV-lncRNA coexpression modules. Values of Pearson correlation coefficient (r) to heart tissue are shown on the x axis. The red dashed lines indicate |r| = 0.6. Sizes of the nodes represent CNV-lncRNAs count in each module. Colors of the nodes represent values of −log10(Padj). Adjusted P value was caluculated with corPvalueStudent function in WGCNA R package. c Functional annotations of the positively heart-correlated coexpression modules are shown (Supplementary Data 2). Horizontal bars represent GO terms, and the colors of the bars represent different CNV-lncRNA coexpression modules. For each positively heart-correlated module, the top five GO terms (ranked by Padj) are listed on the y axis. Values of −log10(Padj) are shown on the x axis. The red dashed line indicates Padj of 0.05. d Classifications of CNV-lncRNAs in the black module. Counts for each class of the CNV-lncRNAs are shown in the parentheses. e Sequence conservation of the CNV-lncRNAs in the black module (Supplementary Data 3).
Fig. 3
Fig. 3. Black module contained co-expressed CNV-lncRNAs and CHD genes.
a Non-syndromic associated CNVs (n = 19), co-expressed CNV-lncRNAs (n = 30, distributing in 10 CNVs) and 12 CHD genes in heart-correlated black module are shown in the circos plot. The colors of CNVs represent CNV types. The colors of lines represent the Pearson correlation coefficient (calculated with human organ developmental dataset, n = 313) of each gene pair. Two hub CNV-lncRNAs in the black module are in bold font. b Correlations between CNV-lncRNAs and the CHD subtypes in the black module. These relationships are identified based on the intersection of CNV-lncRNAs and non-syndromic CHD associated CNVs (Supplementary Data 4).
Fig. 4
Fig. 4. Enrichment of known CHD genes in the heart associated coexpression modules.
Two heart associated modules, black and turquoise, that significantly enriched three of four CHD gene sets are shown. Hub CNV-lncRNAs and CHD genes in black (a) and turquoise (b) coexpression modules are listed (Supplementary Data 1 and 5). Hub CNV-lncRNAs are highlighted with red edge. Subsets of CHD genes are indicated in different colors. Sizes of the nodes represent gene module membership value (MM) in corresponding module (Supplementary Data 5). Hypergeometric test was used to calculate statistical significance for the enrichment of coexpressed protein coding genes in black (c) and turquoise (d) module against four CHD gene sets. CHD gene sets are indicated in different colors. Significant enrichment (PH < 0.05, PH represents hypergeometric P value) was shown with the PH value in red font. Protein coding genes that went for WGCNA (n = 19,957) were used as the background gene list. e Cardiac development related pathways in the black and turquoise modules (Supplementary Data 2). Horizontal axis represents GO terms. The colors of the dots indicate different modules. The size of the dots represents gene counts of each module involved in corresponding GO terms. Values of −log10(Padj) are shown on the x axis. The red dashed line indicates Padj of 0.05.
Fig. 5
Fig. 5. Differentially expressed CHD genes and CNV-lncRNAs in developmental heart and brain.
CHD genes upregulated (|log2FoldChange| ≥ 1, Padj < 0.05) in heart (21 genes) and brain (8 genes) developmental samples (Heart samples: n = 50, brain samples: n = 87) are shown in heatmap (a). For each cluster, statistically enriched GO Biological Process terms and Padj are shown on the panel. Pie plots show related CHD type of each differentially expressed CHD genes cluster (b). Top differentially expressed CHD genes (c) and CNV-lncRNAs (d) for each cluster are labeled in volcano plots (ranked by log2FoldChange). The x and y axes represent log2FoldChange (heart vs brain) and −log10(Padj), respectively. Red dots represent significantly upregulated genes in heart (log2FoldChange ≥ 1, Padj < 0.05). Blue dots represent significantly upregulated genes in brain (log2FoldChange ≤ −1, Padj < 0.05). Gray dots represent genes that do not differentially expressed. The horizontal and vertical red dashed line indicate Padj = 0.05 and |log2FoldChange| = 1, respectively. Pie plots beside each cluster show distribution of genes in coexpression modules constructed by syndromic WGCNA. Only modules with highest gene proportion of each cluster are colored.
Fig. 6
Fig. 6. CNV-lncRNA coexpression modules related to seven organs.
Pearson correlation coefficient (r) between 45 coexpression modules and sample traits (Tissue types) were calculated in syndromic WGCNA (Supplementary Data 8). Only significant correlation (|r| > 0.6, Padj < 0.05) are labeled. The colors represent correlation coefficient value and direction. **Padj < 0.01.
Fig. 7
Fig. 7. Regulatory effect of hub CNV-lncRNA HSALNG0104472 predicted with datasets of developmental heart and in vitro differentiation from human iPSCs to cardiomyocytes.
a Relative weight of CNV-lncRNAs (n = 30) to key CHD genes in the non-syndromic black module are shown (Supplementary Data 10). Values of rescaled relative weight (as a percentage of predicted variance in the criterion variable attributed to each predictor, within rounding error rescaled weights of predictors in one test sum to 100%) are shown on the y axis, which represent the regulatory effect. Mean expression value (transcripts per million, tpm) of CNV-lncRNAs in the developmental heart samples (n = 50) are shown on the x axis. The red dashed lines indicate medium value of each axis. Red dots represent significant predictors. Gray dots represent nonsignificant predictors. b Expression patterns of HSALNG0104472 and 8 predicted regulated CHD genes in the non-syndromic black module during in vitro differentiation from human iPSCs to cardiomyocytes (n = 297) (Supplementary Data 11). The x and y axes represent cardiomyocyte differentiation stage (day) and mean expression value (tpm) of each stage, respectively. The center line represents a median value. The box limits represent upper and lower quartiles. The whiskers represent 1.5x interquartile range. The points represent outliers.
Fig. 8
Fig. 8. Reduction of CNV-lncRNA HSALNG0104472 may affect cardiomyocyte differentiation.
a For HSALNG0104472 knockdown and control groups, 3 time points during the differentiation of human iPSCs to cardiomyocytes were captured. Scale bar, 40 μm. b For HSALNG0104472 knockdown and control groups, quantification of cardiomyocytes (at day 8 post induction) containing cardiac Troponin T (cTnT) is shown (Supplementary Figs. 11–16 and Supplementary Data 13). The error bars show mean ± SD of three biologically independent experiments. Two-tailed Student’s t test was used for comparison between two group. **P < 0.01. c Immunofluorescence of cardiac sarcomere markers in induced cardiomyocytes. DAPI (blue), cTnl (red) and α-Actinin (green). Scale bar, 15 μm. cTnl cardiac troponin I.

References

    1. GBD 2017 Congenital Heart Disease Collaborators. Global, regional, and national burden of congenital heart disease, 1990-2017: a systematic analysis for the Global Burden of Disease Study 2017. Lancet Child Adolesc. Health. 2020;4:185–200. doi: 10.1016/S2352-4642(19)30402-X. - DOI - PMC - PubMed
    1. Liu Y, et al. Global birth prevalence of congenital heart defects 1970-2017: updated systematic review and meta-analysis of 260 studies. Int J. Epidemiol. 2019;48:455–463. doi: 10.1093/ije/dyz009. - DOI - PMC - PubMed
    1. Leirgul E, et al. Birth prevalence of congenital heart defects in Norway 1994-2009–a nationwide study. Am. Heart J. 2014;168:956–964. doi: 10.1016/j.ahj.2014.07.030. - DOI - PubMed
    1. Pierpont ME, et al. Genetic basis for congenital heart disease: revisited: a scientific statement from the American Heart Association. Circulation. 2018;138:e653–e711. doi: 10.1161/CIR.0000000000000606. - DOI - PMC - PubMed
    1. Nees, S. N. & Chung, W. K. Genetic Basis of Human Congenital Heart Disease. Cold Spring Harb. Perspect. Biol.10.1101/cshperspect.a036749 (2020). - PMC - PubMed

Publication types

Substances