. 2023 Feb 28;42(2):112131.
doi: 10.1016/j.celrep.2023.112131. Epub 2023 Feb 18.

Platelet-instructed SPP1+ macrophages drive myofibroblast activation in fibrosis in a CXCL4-dependent manner

Affiliations

Platelet-instructed SPP1+ macrophages drive myofibroblast activation in fibrosis in a CXCL4-dependent manner

Konrad Hoeft et al. Cell Rep. .

Abstract

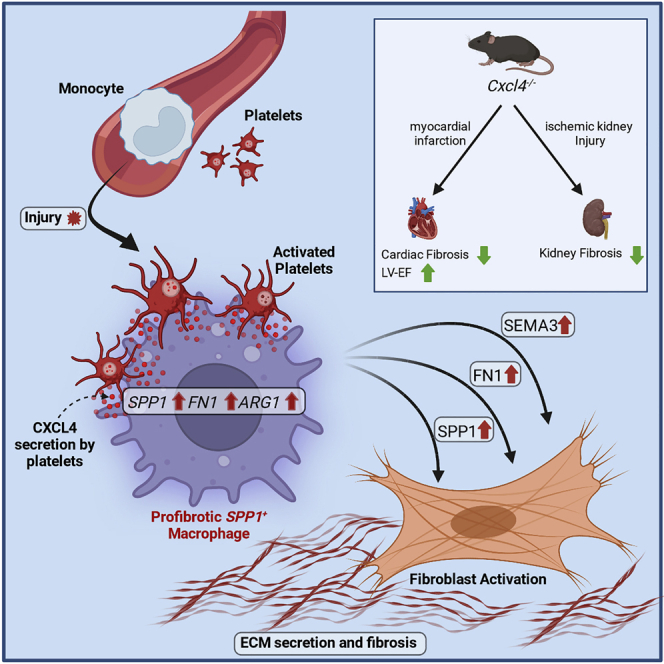
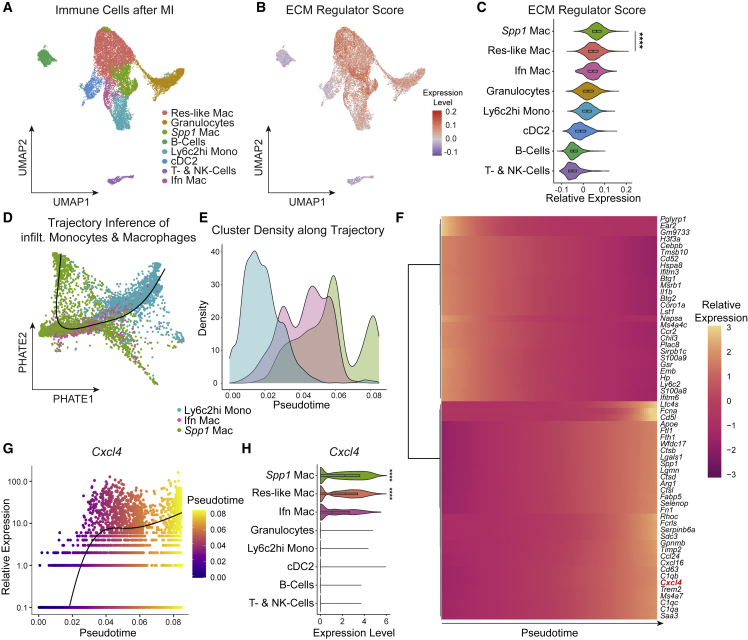
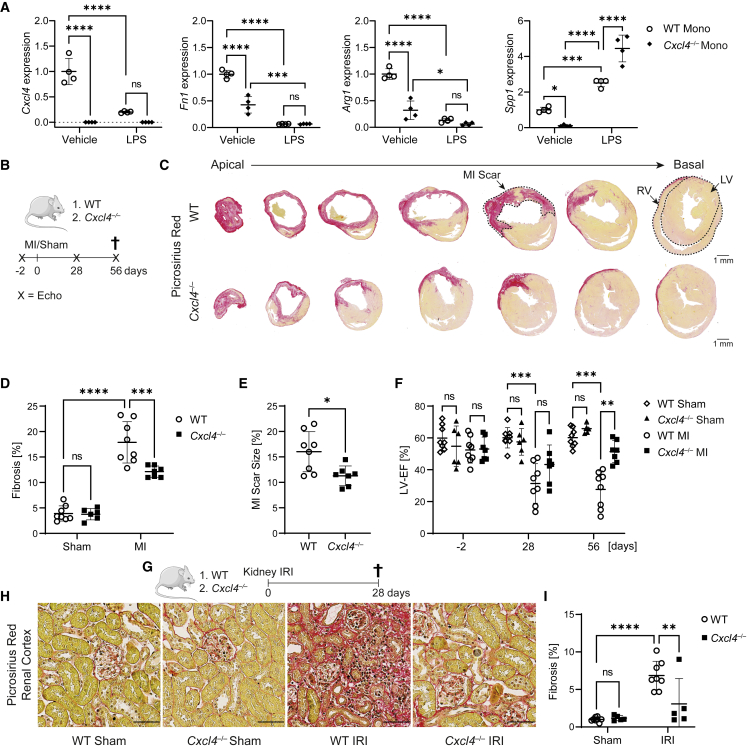
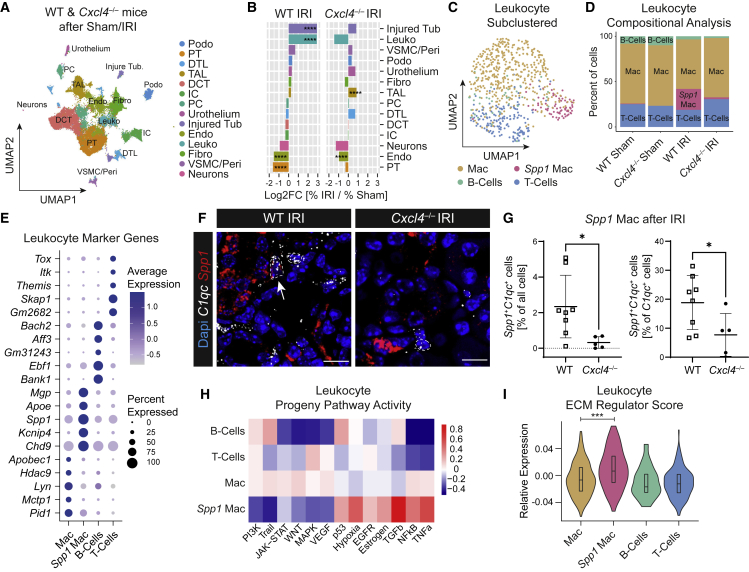
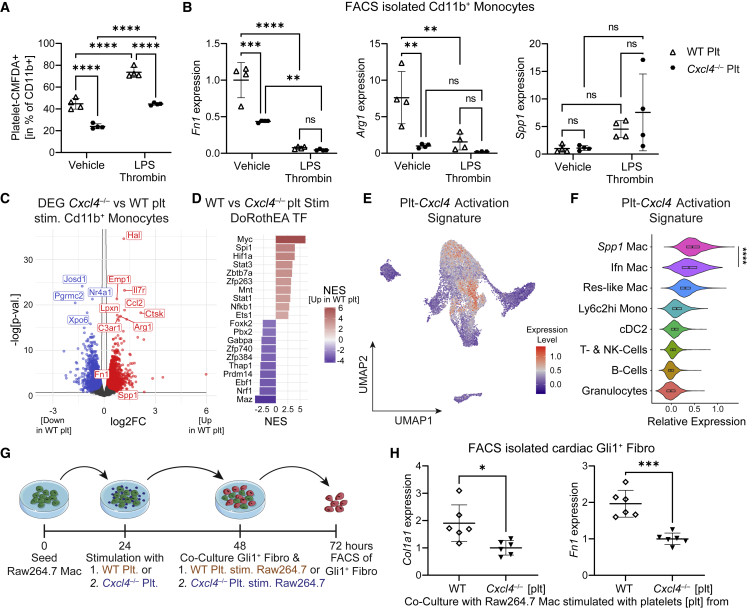
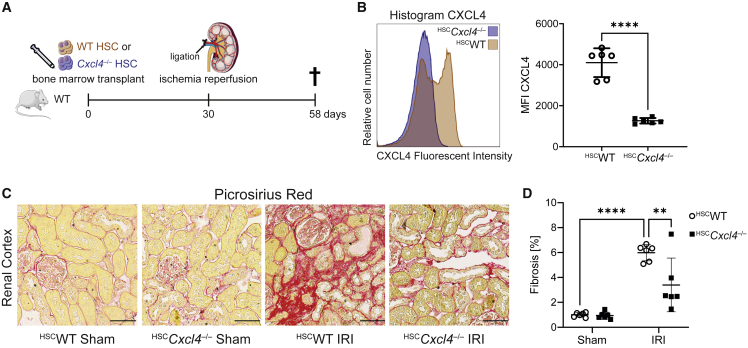
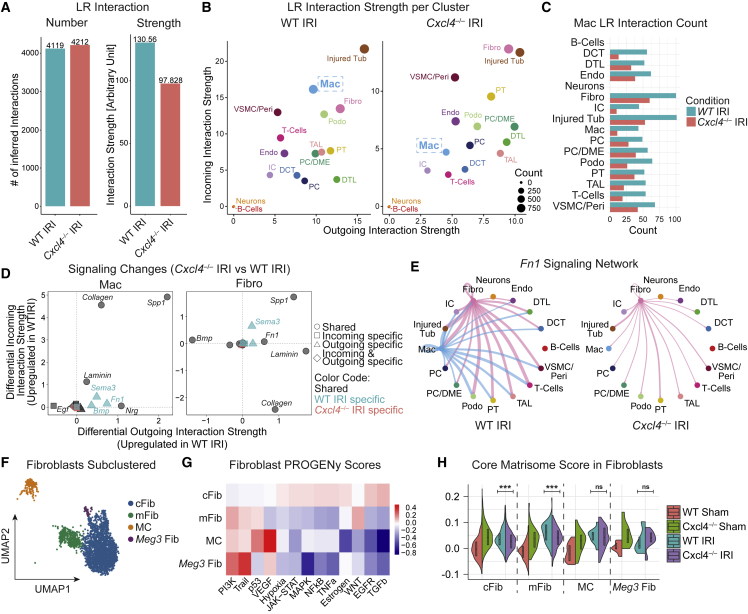
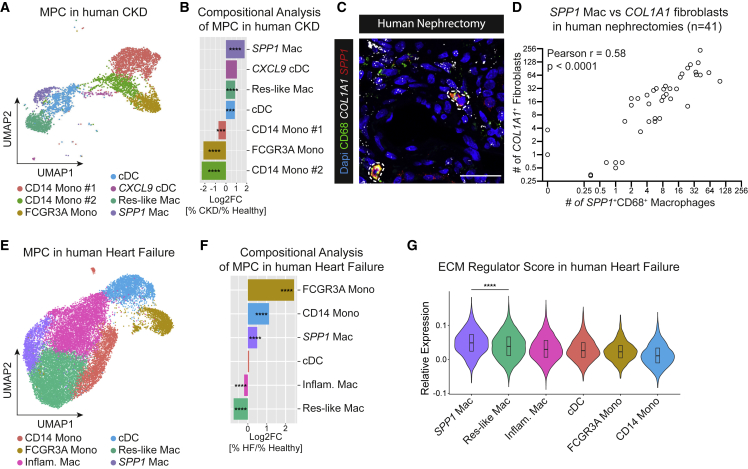
Fibrosis represents the common end stage of chronic organ injury independent of the initial insult, destroying tissue architecture and driving organ failure. Here we discover a population of profibrotic macrophages marked by expression of Spp1, Fn1, and Arg1 (termed Spp1 macrophages), which expands after organ injury. Using an unbiased approach, we identify the chemokine (C-X-C motif) ligand 4 (CXCL4) to be among the top upregulated genes during profibrotic Spp1 macrophage differentiation. In vitro and in vivo studies show that loss of Cxcl4 abrogates profibrotic Spp1 macrophage differentiation and ameliorates fibrosis after both heart and kidney injury. Moreover, we find that platelets, the most abundant source of CXCL4 in vivo, drive profibrotic Spp1 macrophage differentiation. Single nuclear RNA sequencing with ligand-receptor interaction analysis reveals that macrophages orchestrate fibroblast activation via Spp1, Fn1, and Sema3 crosstalk. Finally, we confirm that Spp1 macrophages expand in both human chronic kidney disease and heart failure.

Keywords: CP: Immunology; CXCL4; PF4; SPP1; SPP1 macrophages; chronic kidney disease; fibrosis; heart failure; innate immunity; myocardial infarction; platelets.


Conflict of interest statement

Declaration of interests The authors declare no competing interests.

Figures

None
Graphical abstract
Figure 1
Figure 1
ECM regulator scoring identifies profibrotic Spp1+ macrophages (A) UMAP embedding of 17,690 Cd45+ immune cells from murine heart tissue at different timepoints after myocardial infarction from Forte et al. Labels refer to clusters. Res-like Mac: resident-like macrophages, Spp1 Mac: Spp1+ macrophages, Ly6c2hi Mono: Ly6c2 high monocytes, cDC2: conventional dendritic cells type 2, T- & NK-cells: T-cells and natural killer cells, Ifn Mac: Interferon-induced macrophages. (B) Featureplot of ECM regulator score on the UMAP embedding shown in (A). (C) ECM regulator score stratified by immune cell type. (D) Fitted Slingshot pseudotime trajectory for infiltrating MPC on a PHATE dimensionality reduction. (E) Line graph showing Cluster Density (in % of all cluster cells) of infiltrating MPC along pseudotime. (F) Heatmap of top dynamically expressed genes along pseudotime. (G) Expression of Cxcl4 along pseudotime. Each dot represents an individual pseudotime-ordered cell. (H) Cxcl4 expression stratified by immune cell type. For (C), a two-tailed unpaired t test (Spp1 Mac versus Res-like Mac) was computed. For (H) p values from MAST (Seurat, FindAllMarkers) are displayed. ∗∗∗∗p < 0.0001. See also Figures S1 and S2.
Figure 2
Figure 2
Genetic loss of Cxcl4 mitigates organ fibrosis (A) RT-qPCR analysis for Cxcl4, Fn1, Arg1, and Spp1 in CD11b+ monocytes isolated from WT or Cxcl4−/− PBMCs after stimulation with vehicle or LPS (n = 4). Mono, monocytes. (B) Design of myocardial infarction experiments. (C) Picrosirius red stained serial heart sections over seven levels from WT and Cxcl4−/− mice after MI. ECM is stained red. LV, left ventricle; RV, right ventricle. Scale bar = 1 mm. (D) Fibrosis of serial heart sections in WT sham, Cxcl4−/− sham, WT MI, and Cxcl4−/− MI mice based on quantification of serial heart sections shown in (C). Quantification by spectral thresholding analysis of red ECM (WT Sham = 8; Cxcl4−/− Sham = 6; WT MI = 8; Cxcl4−/− MI = 7). (E) MI scar sizes in WT and Cxcl4−/− mice based on quantification of serial heart sections shown in (C). (F) Left ventricular ejection fraction (Simpsons) 2 days before, as well as 28 and 56 days after MI or sham surgery in WT and Cxcl4−/− mice. (G) Experimental design of IRI experiments. (H) Representative images of picrosirius red stained cortical kidney sections from WT and Cxcl4−/− mice after sham or IRI surgery. Scale bar = 50 μm. (I) Kidney cortex fibrosis (in % of cortex area) after sham or IRI surgery by quantification of red ECM of scans shown in (H) (WT mice = 8, Cxcl4−/− mice = 5). All quantitative data are shown as mean ± SD. For (A), (D), (F), and (I), two-way ANOVA was computed using Tukey corrections. For (E), a two-tailed unpaired t test was performed. p < 0.05, ∗∗p < 0.01, ∗∗∗p < 0.001, ∗∗∗∗p < 0.0001.
Figure 3
Figure 3
Loss of Cxcl4 abrogates profibrotic Spp1+ macrophage expansion (A) UMAP embedding of 66,235 nuclei isolated from kidneys of WT and Cxcl4−/− mice after sham or IRI surgery (n = 1 snRNA-seq library per condition pooled from n = 5 WT Sham, n = 5 WT IRI, n = 4 Cxcl4−/− Sham, and n = 4 Cxcl4−/− IRI mice). Labels refer to clusters. DCT, distal convoluted tubule; DTL, descending thin limb; Endo, endothelial cells; Fibro, fibroblasts; IC, intercalated cells; Injured Tub, injured tubular cells; Leuko, leukocytes; PC, principal cells; Podo, podocytes; PT, proximal tubule; TAL, thick ascending limb; Peri, pericytes; VSMC, vascular smooth muscle cells. (B) Bar plot of cluster cell numbers in IRI versus sham kidneys for WT and Cxcl4−/− mice after normalization via Log2 transformation. Log2FC, log 2-Fold Change. (C) UMAP of 489 sub-clustered single cell leukocytes from (A). (D) Leukocyte sub-cluster composition (in % of all leukocytes) stratified by genotype and surgery. (E) Dotplot of the top five specific genes for leukocyte clusters shown in (C). (F) RNA-ISH staining for C1qc (white) and Spp1 (red) in WT and Cxcl4−/− kidneys after IRI. A white arrow marks a Spp1+C1qc+ cell (WT mice = 8, Cxcl4−/− mice = 5). Scale bar =10 μm. (G) Quantification of C1qc+Spp1+ double-positive nuclei in percent of all nuclei and of C1qc+ nuclei. Data are shown as mean ± SD. (H) PROGENy pathway analysis of snRNA leukocyte clusters. (I) Leukocyte ECM regulator score stratified by leukocyte sub-cluster. For (B) Fisher’s exact test was computed using false discovery rate correction for multiple testing. For (G) and (I) a two-tailed unpaired t test was performed. p < 0.05, ∗∗∗p < 0.001, ∗∗∗∗p < 0.0001. See also Figures S3, S4, and S6.
Figure 4
Figure 4
Platelet-derived CXCL4 drives profibrotic Spp1+ macrophage activation (A) Flow cytometric analysis of Platelet-CMFDA+CD11b+ platelet-monocyte aggregates after co-culture of WT PBMC with either CMFDA-positive WT or Cxcl4−/− platelets and stimulation with Vehicle or LPS and Thrombin (n = 4). (B) RT-qPCR analysis for Arg1, Fn1, and Spp1 in sorted CD11b+ monocytes after WT or Cxcl4−/− platelet-induced activation of WT PBMC. Plt, platelets. (C) Volcano plot showing differentially expressed genes in CD11b+ monocytes activated with either WT or Cxcl4−/− platelets (n = 4). p-val., p value; plt, platelets; stim., stimulated. (D) DoRothEA transcription factor analysis of differentially expressed genes in CD11b+ monocytes co-cultured with either WT or Cxcl4−/− platelets. (E) Expression of a platelet-Cxcl4 activation signature (top upregulated genes defined by an adjusted p value <0.01 and log2FC > 0.5 in WT versus Cxcl4−/− co-cultured CD11b+ monocytes) in cardiac immune cells plotted on the UMAP embedding shown in Figure 1A. (F) Platelet-Cxcl4 activation signature in cardiac immune cells stratified by immune cell type. (G) Experimental design of Gli1+-fibroblast co-culture with WT or Cxcl4−/− platelet-stimulated Raw264.7 macrophages. Mac, macrophages; Fibro, fibroblasts; stim, stimulated. (H) RT-qPCR analysis of Col1a1 and Fn1 expression in Gli1+ cardiac fibroblasts after co-culture with WT or Cxcl4−/− platelet pretreated Raw264.7 macrophages as shown in (C) (n = 6). For (A) and (B), a two-way ANOVA was computed using Tukey corrections. For (F) and (H), a two-tailed unpaired t test was performed. p < 0.05, ∗∗p < 0.01, ∗∗∗p < 0.001, ∗∗∗∗p < 0.0001. See also Figure S5.
Figure 5
Figure 5
Hematopoietic Cxcl4−/− mitigates kidney fibrosis after IRI (A) Experimental design for IRI surgery in mice after lethal irradiation and bone marrow transplantation with either WT (HSCWT) or Cxcl4−/− (HSCCxcl4−/−) hematopoietic stem cells. (B) Mean fluorescent CXCL4 intensity in peripheral blood of HSCWT and HSCCxcl4−/− mice 58 days transplantation (HSCWT mice = 6 and HSCCxcl4−/− mice = 6). (C) Representative images of picrosirius red stained cortical kidney sections from HSCWT and HSCCxcl4−/− mice after sham or IRI surgery. Scale bar = 50 μm. (D) Kidney cortex fibrosis (in % of cortex area) after sham or IRI surgery by quantification of red ECM of scans shown in (G). All quantitative data are shown as mean ± SD. For (D) a two-way ANOVA was computed using Tukey corrections. For (B) a two-tailed unpaired t test was performed. ∗∗p < 0.01, ∗∗∗∗p < 0.0001. See also Figure S5.
Figure 6
Figure 6
Loss of Cxcl4 abrogates macrophage-fibroblast crosstalk (A) Total number of inferred ligand-receptor (LR) interactions and LR interaction strength for WT IRI and Cxcl4−/− IRI kidneys. (B) Inferred outgoing and incoming LR interaction strength for individual clusters split by genotype. No LR interactions were found for neurons and B-cells. Labels refer to clusters. DCT, distal convoluted tubule; Endo, endothelial cells; Fibro, fibroblasts; IC, intercalated cells; Mac, macrophages; PC, principal cells; Peri, pericytes; Podo, podocytes; PT: proximal tubular cells; TAL, thick ascending limb; Tub, tubular cells; VSMC, vascular smooth muscle cells. (C) Inferred number of macrophage (Mac) Ligand-Receptor (LR) Interactions with cell clusters stratified by genotype. Labels refer to clusters. (D) Differential LR incoming and outgoing interaction strength (Cxcl4−/− IRI versus WT IRI) by signaling network in macrophages (Mac) and fibroblasts (Fibro). (E) Network plots for inferred Fn1 ligand-receptor interaction activity split by genotype. (F) UMAP of 2692 sub-clustered single nuclear fibroblasts from Figure 3A. cFib, cortical Dapk2+ fibroblasts; mFib, medullary Dapk2 fibroblasts; MC, mesangial cells; Meg3 Fib, Meg3+Foxp2+ fibroblasts. (G) PROGENy pathway analysis of fibroblast sub-clusters shown in (F). (H) Fibroblast Core Matrisome scores split by condition and fibroblast sub-clusters. For (H) a two-tailed unpaired t test was computed. ∗∗∗p < 0.001. See also Figure S6.
Figure 7
Figure 7
SPP1+ profibrotic macrophages expand in human CKD and heart failure (A) UMAP embedding of 4,404 mononuclear phagocytes sub-clustered from CD10 single cells from 15 human kidneys by Kuppe et al.6 Labels refer to clusters. cDC, conventional dendritic cells; Mono, monocytes; Res-like Mac, resident-like macrophages; SPP1 Mac, SPP1+ macrophages. (B) Bar plot of cluster cell numbers in CKD versus healthy kidneys after normalization via Log2 transformation. Log2FC, log 2-Fold Change. (C) RNA-ISH for SPP1 and COL1A1 combined with immunofluorescent CD68 staining in human kidney nephrectomies. SPP1+CD68+ macrophages are circled in white. Scale bar = 30 μm. (D) Pearson correlation of the number of COL1A1+ fibroblasts with SPP1+CD68+ macrophages in human kidney nephrectomies (n = 41). (E) UMAP embedding of 20,892 mononuclear phagocytes sub-clustered from CD45+ single cells from six human heart samples from Rao et al. Labels refer to clusters. Inflam. Mac, inflammatory macrophages. (F) Bar plot of cluster cell numbers in heart failure versus healthy hearts after normalization via Log2 transformation. Log2FC, log 2-Fold Change. (G) Cardiac ECM regulator score stratified by immune cell type. For (B) and (F), Fisher’s exact test was computed using false discovery rate correction for multiple testing. For (G), a two-tailed unpaired t test was performed. ∗∗∗p < 0.001, ∗∗∗∗p < 0.0001. See also Figure S7.

References

    1. Wynn T.A., Ramalingam T.R. Mechanisms of fibrosis: therapeutic translation for fibrotic disease. Nat. Med. 2012;18:1028–1040. - PMC - PubMed
    1. Henderson N.C., Rieder F., Wynn T.A. Fibrosis: from mechanisms to medicines. Nature. 2020;587:555–566. - PMC - PubMed
    1. Kramann R., DiRocco D.P., Humphreys B.D. Understanding the origin, activation and regulation of matrix-producing myofibroblasts for treatment of fibrotic disease. J. Pathol. 2013;231:273–289. - PubMed
    1. Kramann R., Schneider R.K., DiRocco D.P., Machado F., Fleig S., Bondzie P.A., Henderson J.M., Ebert B.L., Humphreys B.D. Perivascular Gli1+ progenitors are key contributors to injury-induced organ fibrosis. Cell Stem Cell. 2015;16:51–66. - PMC - PubMed
    1. Soliman H., Paylor B., Scott R.W., Lemos D.R., Chang C., Arostegui M., Low M., Lee C., Fiore D., Braghetta P., et al. Pathogenic potential of Hic1-expressing cardiac stromal progenitors. Cell Stem Cell. 2020;26:205–220.e8. - PubMed

Publication types