. 2023 Feb 20;13(1):2924.
doi: 10.1038/s41598-023-29208-5.

In silico assessment on TdP risks of drug combinations under CiPA paradigm

Affiliations

In silico assessment on TdP risks of drug combinations under CiPA paradigm

Ali Ikhsanul Qauli et al. Sci Rep. .

Abstract

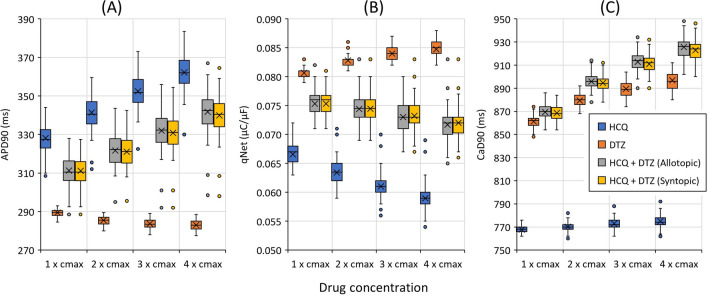
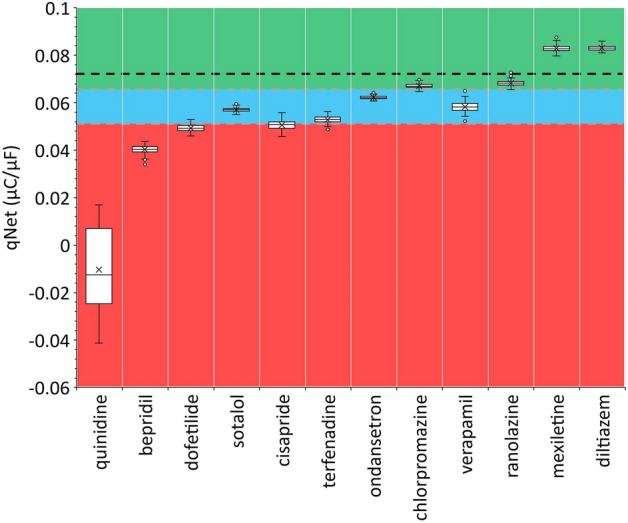
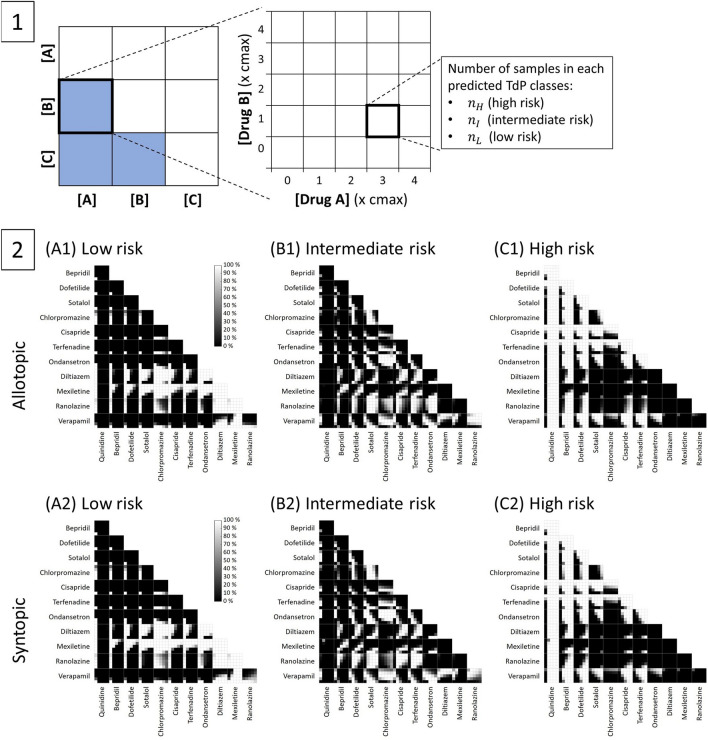
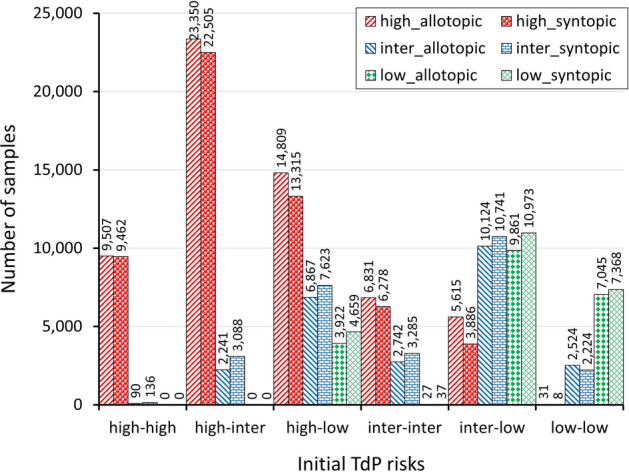
Researchers have recently proposed the Comprehensive In-vitro Proarrhythmia Assay (CiPA) to analyze medicines' TdP risks. Using the TdP metric known as qNet, numerous single-drug effects have been studied to classify the medications as low, intermediate, and high-risk. Furthermore, multiple medication therapies are recognized as a potential method for curing patients, mainly when limited drugs are available. This work expands the TdP risk assessment of drugs by introducing a CiPA-based in silico analysis of the TdP risk of combined drugs. The cardiac cell model was simulated using the population of models approach incorporating drug-drug interactions (DDIs) models on several ion channels for various drug pairs. Action potential duration (APD90), qNet, and calcium duration (CaD90) were computed and analyzed as biomarker features. The drug combination maps were also used to illustrate combined medicines' TdP risk. We found that the combined drugs alter cell responses in terms of biomarkers such as APD90, qNet, and CaD90 in a highly nonlinear manner. The results also revealed that combinations of high-risk with low-risk and intermediate-risk with low-risk drugs could result in compounds with varying TdP risks depending on the drug concentrations.


Conflict of interest statement

The authors declare no competing interests.

Figures

Figure 1
Figure 1
Features (APD90, qNet, and CaD90) as a function of drug concentrations for hydroxychloroquine, diltiazem, and combined hydroxychloroquine-diltiazem. Panel (A) shows the result of APD90, panel (B) for qNet, and panel (C) for CaD90. The labels in x axis represent the concentration of each compound incorporated in the simulation. For example, 3×cmax for the combination of compound A and B means that the concentration for each A and B is 3×cmax. Furthermore, in a single box plot, the cross line refers to the average value of the feature; the lower, middle, and upper lines of the box refer to the first quartile, median, and third quartile, respectively; the upper and lower lines outside the box refer to maximum and minimum values excluding the outliers; circles represent the outliers.
Figure 2
Figure 2
Distribution of qNet for 12 CiPA drugs (single drug effects). The qNet values shown in the figure were the average qNet values from drug concentration of 1-4×cmax as in Li et al.. The upper horizontal grey dashed line represents the threshold1=0.0652μC/μF and the lower one for threshold2=0.0516μC/μF. The black dashed line depicts the control (drug free) value of qNet at 0.072μC/μF. qNet values higher than threshold1 are classified as low risk, between threshold1 and threshold2 are classified as intermediate risk, and below threshold2 for high-risk drugs.
Figure 3
Figure 3
The maps of TdP risk prediction. Panel 1 show the an example of detailed description of the combination maps. There are three unique combinations (blue boxes) that each contains various drug concentration pairs ranging from 0-4×cmax. Each blue box represents a map with a vertical and horizontal axis of 0-4×cmax drug concentration variations. The axis value of 0×cmax indicates the drug-free simulations that resemble single drug effects. For example, if the concentration for drug A is 0×cmax, the combined effect of mixed-drug A and B will result in a single effect of drug B. Furthermore, in each drug concentration pair, the total number of samples is 100 that is splitted into three different predicted TdP classes (nH for samples predicted as high risk compounds, nI as intermediate risk, and nL as low risk). Each group of predicted TdP risk can be plotted into separate combination maps as in Panel 2. Panel 2 show the maps for TdP prediction of allotopic and syntopic models. Three panels (A, B, and C) for each model show different classes of predicted TdP risk based on the value of qNet on each pairwise drug sample. Panel A1 and A2 on the left show the maps of resulted compounds predicted as low risk, panel B1 and B2 for compound predicted as intermediate risk, and panel C1 and C2 for compounds predicted as high risk. Each panel (A or B or C) of predicted TdP class shows a unique combination of 12 CiPA drugs, resulting in 66 drug combination maps containing 25 drug concentration pairs. Each combination of drug concentrations contains 100 samples of data of qNets from which one can classify whether it is low, intermediate, or high-risk compounds using threshold values of threshold1 and threshold2. The map's color represents the percentage of samples categorized as low, intermediate, or high-risk compounds. Black color (0%) shows no sample falls under the corresponding category; white color (100%) represents all samples classified as related risk category. The consistency of the results can be assessed from the single drug effects (drug concentration is 0×cmax) in the first axis of each combination map.
Figure 4
Figure 4
Bar chart of TdP risks of compounds from the combination of high, intermediate, and low-risk drugs. The horizontal axis represents the pairs of initial TdP risks of combined drugs, the vertical axis is the number of samples or compounds resulting from drug combinations, and the colored bars represent the predicted risk of compounds resulting from a combination of initial TdP risks of drugs. The value above each bar indicates number of samples of the corresponding bar.

References

    1. Gintant GA. Preclinical torsades-de-pointes screens: Advantages and limitations of surrogate and direct approaches in evaluating proarrhythmic risk. Pharmacol. Ther. 2008;119:199–209. doi: 10.1016/j.pharmthera.2008.04.010. - DOI - PubMed
    1. Vicente J, et al. Mechanistic model-informed proarrhythmic risk assessment of drugs: Review of the “CiPA” initiative and design of a prospective clinical validation study. Clin. Pharmacol. Ther. 2018;103:54–66. doi: 10.1002/cpt.896. - DOI - PMC - PubMed
    1. Mirams GR, et al. Simulation of multiple ion channel block provides improved early prediction of compounds’ clinical torsadogenic risk. Cardiovasc. Res. 2011;91:53. doi: 10.1093/cvr/cvr044. - DOI - PMC - PubMed
    1. Hill AV. The possible effects of the aggregation of the molecules of hæmoglobin on its dissociation curves. J Physiol. 1910;40:i–vii.
    1. Chang KC, et al. Uncertainty quantification reveals the importance of data variability and experimental design considerations for in silico proarrhythmia risk assessment. Front. Physiol. 2017;8:917. doi: 10.3389/fphys.2017.00917. - DOI - PMC - PubMed

Publication types

Substances