. 2023 Feb 17;13(1):2844.
doi: 10.1038/s41598-023-29728-0.

Atypical changes in Candida albicans cells treated with the Venetin-1 complex from earthworm coelomic fluid

Affiliations

Atypical changes in Candida albicans cells treated with the Venetin-1 complex from earthworm coelomic fluid

Sylwia Wójcik-Mieszawska et al. Sci Rep. .

Abstract

In the present research, the effect of a protein-polysaccharide complex Venetin-1 obtained from the coelomic fluid of Dendrobaena veneta earthworm on Candida albicans cells was characterized. The compound destroyed fungal cells without showing cytotoxicity to human skin fibroblasts, which was demonstrated in earlier studies. Since it had an effect on the fungal cell wall and membrane, this complex was compared with the known antifungal antibiotic fluconazole. Both preparations disturbed the division of yeast cells and resulted in the formation of aggregates and chains of unseparated cells, which was illustrated by staining with fluorochromes. Fluorescent staining of the cell wall with Calcofluor white facilitated comparison of the types of aggregates formed after the action of both substances. The analysis performed with the use of Congo red showed that Venetin-1 exposed deeper layers of the cell wall, whereas no such effect was visible after the use of fluconazole. The FTIR analysis confirmed changes in the mannoprotein layer of the cell wall after the application of the Venetin-1 complex. Staining with Rhodamine 123 and the use of flow cytometry allowed comparison of changes in the mitochondria. Significantly elongated mitochondria were observed after the Venetin-1 application, but not after the application of the classic antibiotic. Phase contrast microscopy revealed vacuole enlargement after the Venetin-1 application. The flow cytometry analysis of C. albicans cells treated with Venetin-1 and fluconazole showed that both substances caused a significant decrease in cell viability.


Conflict of interest statement

The authors declare no competing interests.

Figures

Figure 1
Figure 1
Images of aggregates of C. albicans cells after the staining with Calcofluor white: (A1)–(A2)-control C. albicans cells; (B)- C. albicans cells after treatment with Venetin-1 at 100 µg mL−1; (C)- C. albicans cells after incubation with fluconazole at 20 µg mL-1. The scale bar represents 5 µm.
Figure 2
Figure 2
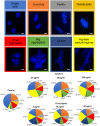
Types of aggregates in the control C. albicans culture and cultures incubated with different concentrations of Venetin-1 and fluconazole. The colors presented on the upper panel correspond to the colors on the pie charts. The scale bar represents 2 µm.
Figure 3
Figure 3
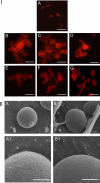
I. C. albicans cells after the incubation with Venetin-1 and fluconazole, stained with Congo red dye: (A)—cells of the control culture; (B)—cells after the incubation with Venetin-1 at 25 µg mL−1; (C)—with Venetin-1 at 50 µg mL−1; (D)—with Venetin-1 at 100 µg mL−1; (E)—cells after the incubation with fluconazole at 5 µg mL−1; (F)—with fluconazole at 10 µg mL−1; (G)—with fluconazole at 20 µg mL−1. The scale bar represents 10 µm. II. Cryo-SEM images of C. albicans cells; A–A1—cells of the control culture, B–B1—cells after the incubation with Venetin-1 at 100 µg mL-1. The scale bar represents 1 µm.
Figure 4
Figure 4
C. albicans cells after the incubation with Venetin-1 and fluconazole stained with a mixture of Hoechst 33342 and Propidium iodide dyes; I- A1–A3—control culture cells; B1–B3—cells after the incubation with Venetin-1 at 50 µg mL−1; C1–C3—with Venetin-1 at 100 µg mL-1; II- A1–A3—control culture cells, B1–B3—cells after the incubation with fluconazole at 10 µg mL−1, C1–C3—with fluconazole at 20 µg mL-1. The yellow arrows indicate non-separated genetic material of the cells after cell division; the white arrows indicate incomplete separation of cells after division; orange arrows show apoptotic cells. The scale bar represents 5 µm.
Figure 5
Figure 5
C. albicans cells imaged by Cryo-SEM (A, B) and SEM (C, D): (A)—cross-section of budding C. albicans cells from the control culture; (B)—cross-section of budding C. albicans cells after the incubation with Venetin-1 at 100 µg mL−1; (C)- cells of C. albicans from the control culture; (D)—cells after the incubation with Venetin-1 at 100 µg mL−1. The scale bar represents 2 µm.
Figure 6
Figure 6
Rhodamine 123 staining of C. albicans cells. (A)—positive control cells with small round mitochondria; (B1)–(B2)—negative control cells treated with sodium azide. Picture (B2) is a visualization of cells in the transmitted light microscope, equivalent of picture (B1) from the fluorescence microscope. (C1)–(C2)—C. albicans cells treated with Venetin-1 at 25 µg mL−1, (D1)–(D2)—with Venetin-1 at 50 µg mL−1, (E1)–(E2)—with Venetin-1 at 100 µg mL−1; (F)–C. albicans cells treated with fluconazole at 5 µg mL−1, (G)—with fluconazole at 10 µg mL−1, (H)—with fluconazole at 20 µg mL−1. Yellow arrows show cells with a normal shape of mitochondria; white arrows indicate cells with elongated mitochondria; red arrows indicate cells that do not emit any inner fluorescence due to inactive mitochondria. The scale bar represents 10 µm.
Figure 7
Figure 7
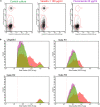
(a) Flow cytometry analysis of active mitochondria with Rhodamine 123. Dot-plots of the control culture, cells after the treatment with Venetin-1 at 100 µg mL-1, and in the variant with fluconazole at 20 µg mL-1. R1- cells with regular mitochondria; R2- aggregates; R3- cells with active mitochondria. (b) Gated regions after flow cytometry analysis: R1-cells with regular mitochondria; R2- aggregates; R3- cells with active mitochondria. Histograms present the profile of the cell cultures in the gated regions. Green—control sample, red—cells after the treatment with Venetin-1 at 100 µg mL-1, purple—cells subjected to fluconazole at 20 µg mL−1.
Figure 8
Figure 8
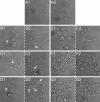
Phase contrast microscopy of C. albicans cells. (A1)–(A2)—C. albicans control cells; (B1)–(B2)—C. albicans after the incubation with Venetin-1 at 25 µg mL−1; (C1)–(C2)—with Venetin-1 at 50 µg mL−1; (D1)–(D2)—with Venetin-1 at 100 µg mL−1; (E1)–(E2)—C. albicans after the incubation with fluconazole at 5 µg mL−1; (F1)–(F2)—with fluconazole at 10 µg mL−1; (G1)–(G2)—with fluconazole at 20 µg mL−1. The arrows indicate enlarged vacuoles in C. albicans cells after the action of the Venetin-1 complex. The scale bar corresponds to 5 µm.
Figure 9
Figure 9
(a) Flow cytometry data of C. albicans cell cultures: (A)—control cell culture; (B1)—cell culture treated with Venetin-1 at 25 µg mL−1, (B2)—with Venetin-1 at 50 µg mL−1, (B3)—with Venetin-1 at 100 µg mL−1; (C1)—cell culture treated with fluconazole at 5 µg mL−1; (C2)—with fluconazole at 10 µg mL−1, (C3)—with fluconazole at 20 µg mL−1. The red color corresponds to viable cells and the black color indicates apoptotic cells. (b) total number of cells in the cultures. Control—control C. albicans cells; V25, V50, V100—C. albicans cells treated with Venetin-1 at 25, 50, 100 µg mL-1; FL5, FL10, FL20—cells treated with fluconazole at 5, 10, 20 µg mL−1; *** P < 0.01 (HSD Tukey Test).
Figure 10
Figure 10
FTIR spectrum for the C. albicans control culture (Control) and after the treatment with Venetin-1 at 100 µg mL−1 (V100) and fluconazole at 20 µg mL−1 (FL20).

Similar articles

Cited by

References

    1. Nnadi, N. E. & Carter, D. A. Climate change and the emergence of fungal pathogens. PLoS Pathog.17. 10.1371/journal.ppat.1009503 (2021). - PMC - PubMed
    1. Tortorano AM, et al. Candidosis in the intensive care unit: A 20-year survey. J. Hosp Infect. 2004;57:8–13. doi: 10.1016/j.jhin.2004.01.017. - DOI - PubMed
    1. Nami S, et al. Fungal vaccines, mechanism of actions and immunology: A comprehensive review. Biomed. Pharmacother. 2019;109:333–344. doi: 10.1016/j.biopha.2018.10.075. - DOI - PubMed
    1. Koehler M, et al. Morbidity and mortality of candidaemia in Europe: An epidemiologic meta-analysis. Clin. Microbiol. Infect. 2019;25:1200–1212. doi: 10.1016/j.cmi.2019.04.024. - DOI - PubMed
    1. Feng W, et al. Mrr2 mutations and upregulation are associated with increased fluconazole resistance in Candida albicans isolates from patients with vulvovaginal candidiasis. Lett. Appl. Microbiol. 2020;70:95–101. doi: 10.1111/lam.13248. - DOI - PubMed

Publication types