. 2023 Apr;22(2):e12840.
doi: 10.1111/gbb.12840. Epub 2023 Feb 17.

Conditioned place avoidance is associated with a distinct hippocampal phenotype, partly preserved pattern separation, and reduced reactive oxygen species production after stress

Affiliations

Conditioned place avoidance is associated with a distinct hippocampal phenotype, partly preserved pattern separation, and reduced reactive oxygen species production after stress

D Parker Kelley et al. Genes Brain Behav. 2023 Apr.

Abstract

Stress is associated with contextual memory deficits, which may mediate avoidance of trauma-associated contexts in posttraumatic stress disorder. These deficits may emerge from impaired pattern separation, the independent representation of similar experiences by the dentate gyrus-Cornu Ammonis 3 (DG-CA3) circuit of the dorsal hippocampus, which allows for appropriate behavioral responses to specific environmental stimuli. Neurogenesis in the DG is controlled by mitochondrial reactive oxygen species (ROS) production, and may contribute to pattern separation. In Experiment 1, we performed RNA sequencing of the dorsal hippocampus 16 days after stress in rats that either develop conditioned place avoidance to a predator urine-associated context (Avoiders), or do not (Non-Avoiders). Weighted genome correlational network analysis showed that increased expression of oxidative phosphorylation-associated gene transcripts and decreased expression of gene transcripts for axon guidance and insulin signaling were associated with avoidance behavior. Based on these data, in Experiment 2, we hypothesized that Avoiders would exhibit elevated hippocampal (HPC) ROS production and degraded object pattern separation (OPS) compared with Nonavoiders. Stress impaired pattern separation performance in Non-Avoider and Avoider rats compared with nonstressed Controls, but surprisingly, Avoiders exhibited partly preserved pattern separation performance and significantly lower ROS production compared with Non-Avoiders. Lower ROS production was associated with better OPS performance in Stressed rats, but ROS production was not associated with OPS performance in Controls. These results suggest a strong negative association between HPC ROS production and pattern separation after stress, and that stress effects on these outcome variables may be associated with avoidance of a stress-paired context.

Keywords: DG-CA3; RNA sequencing (RNAseq); conditioned place avoidance (CPA); dentate gyrus; differentially expressed genes (DEGs); dorsal hippocampus; electron paramagnetic resonance spectroscopy (EPR); electron spin resonance spectroscopy (ESR); hippocampus (HPC); maximal respiratory capacity; metabolism; mitochondria; mitochondrial spare respiratory capacity; object pattern separation (OPS); oxygen consumption rate (OCR); predator odor; reactive oxygen species (ROS); seahorse extracellular flux analysis (SEFA); stress; weighted genome correlational network analysis (WGCNA).


Conflict of interest statement

D. Parker Kelley, Lucas Albrechet‐Souza, Shealan Cruise, Rajani Maiya, Aspasia Destouni, Siva S. V. P. Sakamuri, Alexander Duplooy, Meghan Hibicke, Prasad Katakam, and Joseph Francis do not have any competing interests. Charles Nichols: Scientific Advisory Board of Eleusis Therapeutics and have a sponsored research agreement with them. Nicholas W. Gilpin: Owns shares in Glauser Life Sciences, Inc., a company with interest in developing therapeutics for mental health disorders. There was no direct link between those interests and the work contained herein.

Figures

FIGURE 1
FIGURE 1
(A) Experimental timeline for Experiment 1. Experiment 2 timeline is shown, but presented at 50% transparency. (B) Time spent in the odor‐paired chamber between Nonavoiders (NAv) and Avoiders (Av) (n = 24 including control (n = 8) (not shown), stress n = 16, t = 4.702, df = 15, p = 0.0003). (C) Distribution of Nonavoiders vs Avoiders in Experiment 1. >0.05: ns, <0.05: *, <0.01: **, <0.001***, <0.0001: ****.
FIGURE 2
FIGURE 2
(A) Heat plot of DEGs between Control, Non‐Avoider (NAv) and Avoider (Av) groups exhibiting the top 50 most variable genes and indicating divergent gene expression between Non‐Avoiders and Avoiders. (B) Between group gene expression changes for the antioxidant gene Txn1. * indicates significant differences in the RNA sequencing analysis of differentially expressed genes. (C) Between group gene expression changes for the antioxidant gene Gpx4. * indicates significant differences in the RNA sequencing analysis of differentially expressed genes. (D) Between group gene expression changes for the antioxidant gene Sirt2. * indicates significant differences in the RNA sequencing analysis of differentially expressed genes. (E) Volcano plot of differentially expressed genes with −Log10 FDR on the Y axis and Log2 fold change on the X axis. Genes exceeding the FDR threshold are in blue, while those exceeding the FDR threshold and the Log2 fold change are in red. (F) Reactome gene set enrichment analysis of DEG data.
FIGURE 3
FIGURE 3
WGCNA analysis of identified two modules associated with the avoidance phenotype. (A) genes in the indianred4 module, n = 4 mice/group were significantly upregulated in Non‐Avoiders (NAv) compared with Avoiders (Av) (p < 0.05, t‐test). (B) Overrepresentation analysis of genes within the indianred4 module. (C) Top 30 gene correlations within the indianred4 module. Size of the circle represents the number of connections, and the thickness of connections represents weight of correlation. (D) genes in the magenta module were significantly upregulated in Avoiders compared with Non‐Avoiders (p < 0.05, t‐test, n = 3–4). (E) Overrepresentation analysis of genes in the magenta module. (F) Top 30 correlations of genes in the magenta module.
FIGURE 4
FIGURE 4
(A) Experimental timeline for Experiment 2. Experiment 1 timeline is shown at 50% transparency. (B) Time spent in the odor‐paired chamber between Non‐Avoiders (NAv) and Avoiders (Av) (t = 6.245, df = 14, p < 0.0001). (C) Distribution of Non‐Avoiders vs Avoiders (D) Schematic of object pattern separation (OPS) apparatus showing the size and dimensions of the apparatus and the different possible displacements for objects. (E) Screenshots taken from the overhead camera used to collect the object pattern separation data. The image to the left shows two objects at a displacement of 0 cm with no rat in the apparatus. The image on the right shows two different objects at a displacement of 18 cm with a rat on the opposite side of the apparatus. (F) The formula used to calculate discrimination index (DI) for the object pattern separation measure. >0.05: ns, <0.05: *, <0.01: **, <0.001***, <0.0001: ****.
FIGURE 5
FIGURE 5
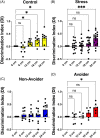
Object Pattern Separation performance. Discrimination between the stationary and moved objects at each displacement was calculated by comparison to a pooled discrimination index (across all groups) at baseline (0 cm). (A) Displacement was a significant source of variance in Controls (n = 8, F(1.523, 10.66) = 6.945, p = 0.0158). Control rats were able to discriminate between moved and stationary objects at 12 cm (p = 0.0146), 18 cm (p = 0.0348) and 24 cm (p = 0.0320). (B) Displacement was a significant source of variance in Stressed rats (n = 16, F(1.942, 29.13) = 5.319, p = 0.0113). Stressed rats did not discriminate at 12 (p = 0.7842) or 18 cm (p = 0.4176), but did discriminate at 24 cm (p = 0.0007). (C) Displacement was not a significant source of variance in Non‐Avoider rats (n = 10, F(1.552, 13.97) = 1.840, p = 0.1980). (D) Displacement was a significant source of variance in Avoider rats (n = 6, F(2.249, 11.24) = 6.130, p = 0.0139). Avoider rats did not discriminate at 12 (p < 0.9999) or 18 cm (p = 0.3186), but did at 24 cm (p = 0.0112).
FIGURE 6
FIGURE 6
(A) Object pattern separation slope across all 5 days between Non‐Avoider (NAv) and Avoider (Av) rats. Welsh's two tailed t‐test revealed a trend towards a higher slope in Avoiders compared with Non‐Avoiders (t = 1.770, df = 13.44, p = 0.0994). Non‐Avoiders exhibited double the standard deviation of Avoiders (0.57 vs 0.25, respectively). (B) Reactive oxygen species production measured by electron paramagnetic resonance spectroscopy (EPR). Welch's two tailed t‐test revealed that Avoiders exhibited significantly reduced reactive oxygen species production relative to Non‐Avoiders (t = 2.138, df = 21.83, p = 0.0439). Non‐Avoiders exhibited nearly double the standard deviation of Avoiders (725 vs 386, respectively). (C) In predator urine‐exposed rats, linear regression across all 5 days exhibits a significant inverse relationship between Reactive Oxygen Species production and Object Pattern Separation slope (r 2 = 0.4355, p = 0.0054). Non‐Avoiders are represented in blue and Avoiders in red. (D) There is no significant relationship between reactive oxygen species production and object pattern separation slope across all 5 days in Control rats (r 2 = 0.2797, p = 0.2806).
FIGURE 7
FIGURE 7
Schematic of multisystem differences between Avoiders (Av) and Non‐Avoiders (NAv). Black arrows indicate stimulation. The blunted red line indicates inhibition. Square ended solid large red arrow indicates previously measured changes in Avoiders. Tapered red arrows indicate change in Avoiders in electron paramagnetic resonance spectroscopy and SEFA functional measures. Solid red arrows with faded ends indicate bidirectional changes between Avoiders and Non‐Avoiders observed in RNA sequencing DEG or WGCNA analysis. Dashed red arrows indicate bidirectional changes between groups that may be compensatory responses to the other indicated effects. Image created with BioRender.com.

References

    1. Liberzon I, Abelson JL. Context processing and the neurobiology of post‐traumatic stress disorder. Neuron. 2016;92:14‐30. - PMC - PubMed
    1. Association A.P . Diagnostic and Statistical Manual of Mental Disorders DSM‐5. 2013.
    1. Garfinkel SN, Abelson JL, King AP, et al. Impaired contextual modulation of memories in PTSD: an fMRI and psychophysiological study of extinction retention and fear renewal. J Neurosci. 2014;34:13435‐13443. - PMC - PubMed
    1. Maren S, Phan KL, Liberzon I. The contextual brain: implications for fear conditioning, extinction and psychopathology. Nat Rev Neurosci. 2013;14:417‐428. - PMC - PubMed
    1. Martinelli C, Shergill SS. Clarifying the role of pattern separation in schizophrenia: the role of recognition and visual discrimination deficits. Schizophr Res. 2015;166:328‐333. - PubMed

Publication types

Substances