Case Reports
. 2023 Mar;29(3):689-699.
doi: 10.1038/s41591-022-02202-6. Epub 2023 Feb 20.

Epidural stimulation of the cervical spinal cord for post-stroke upper-limb paresis

Affiliations
Case Reports

Epidural stimulation of the cervical spinal cord for post-stroke upper-limb paresis

Marc P Powell et al. Nat Med. 2023 Mar.

Abstract

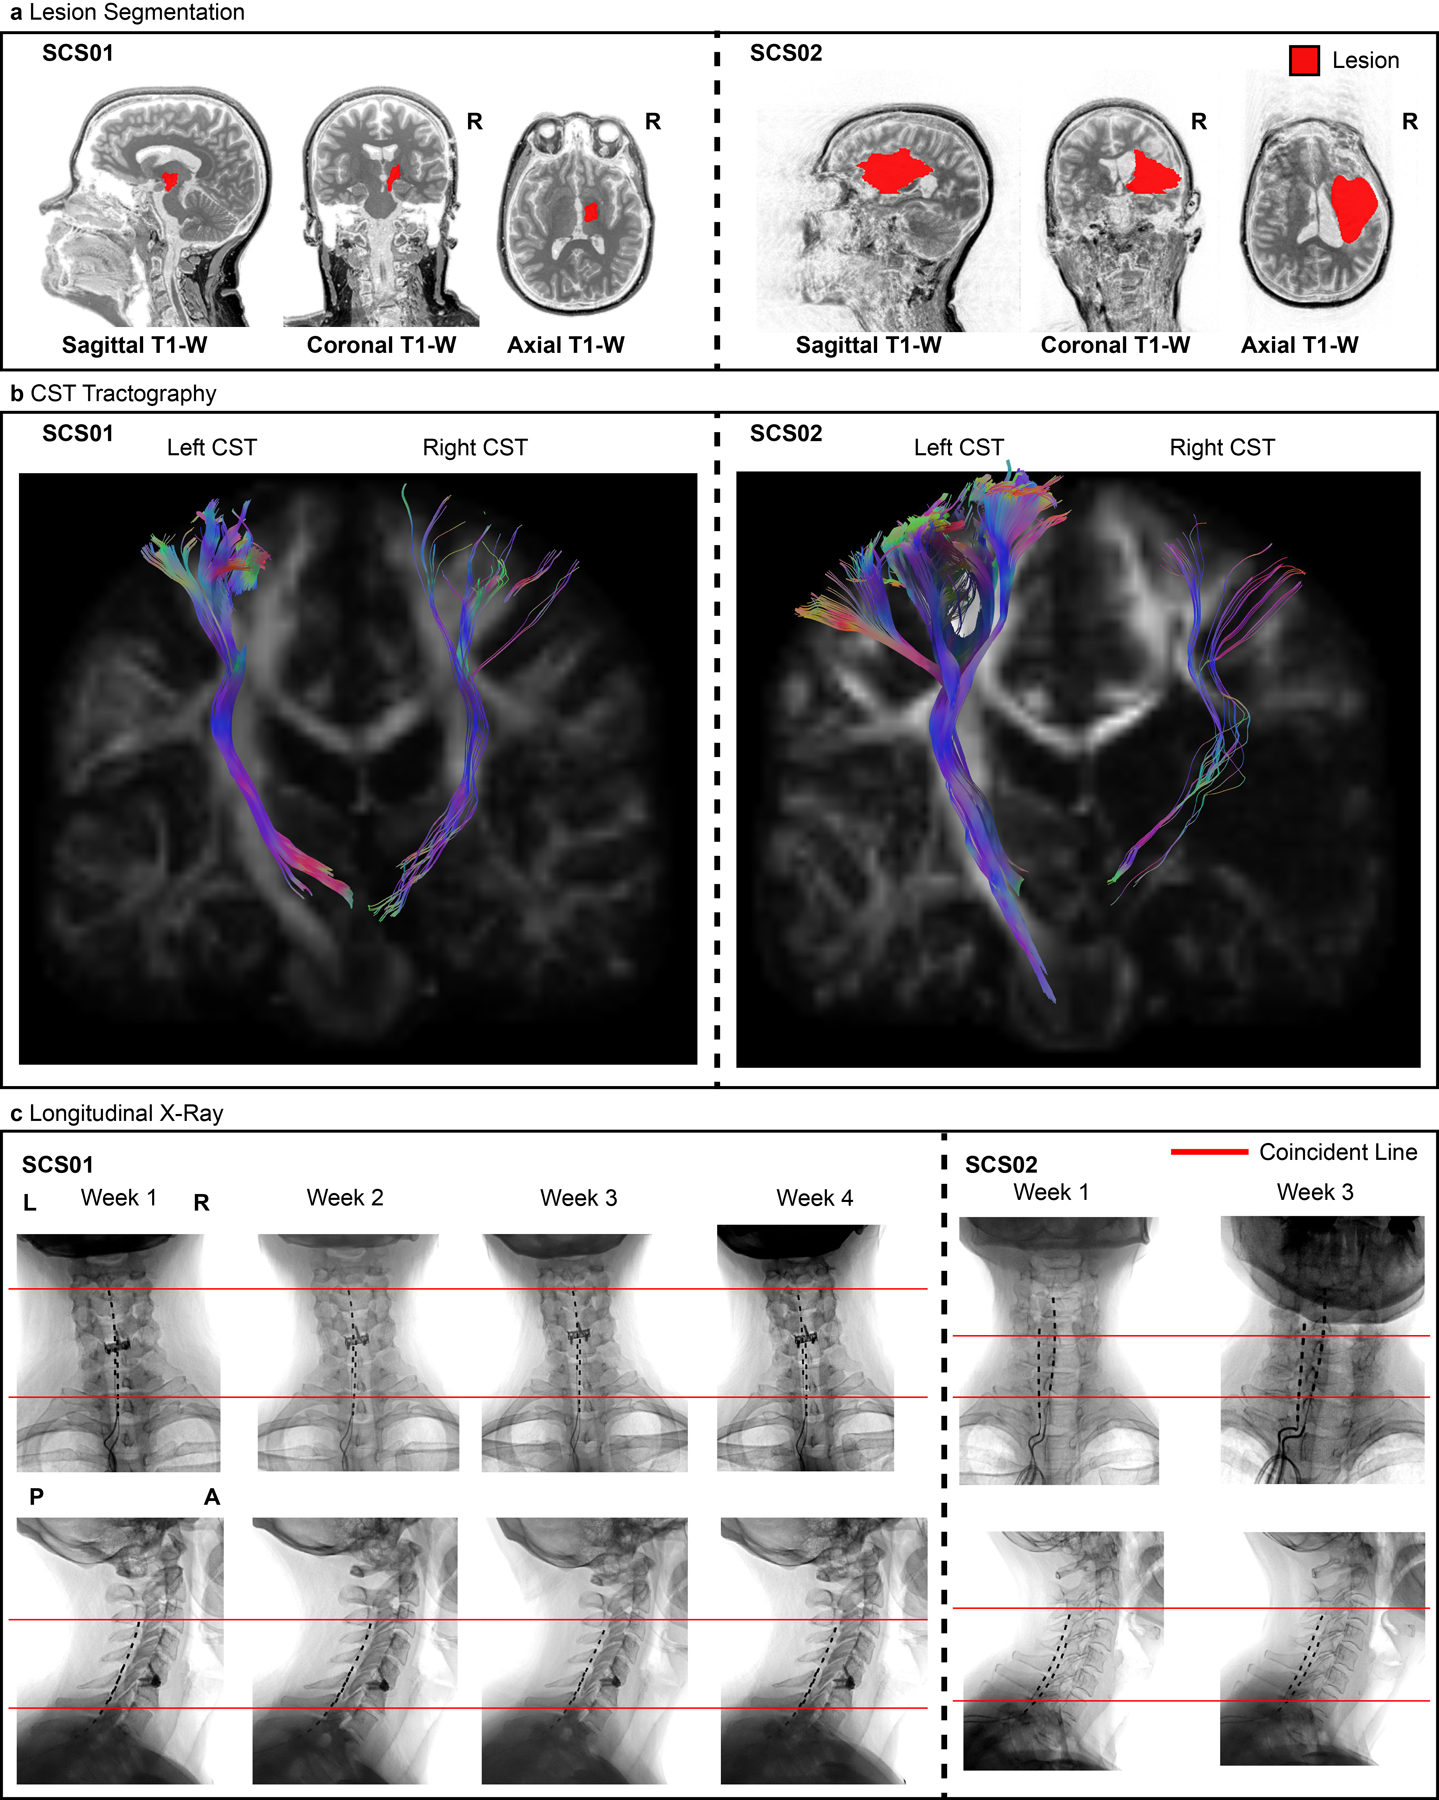
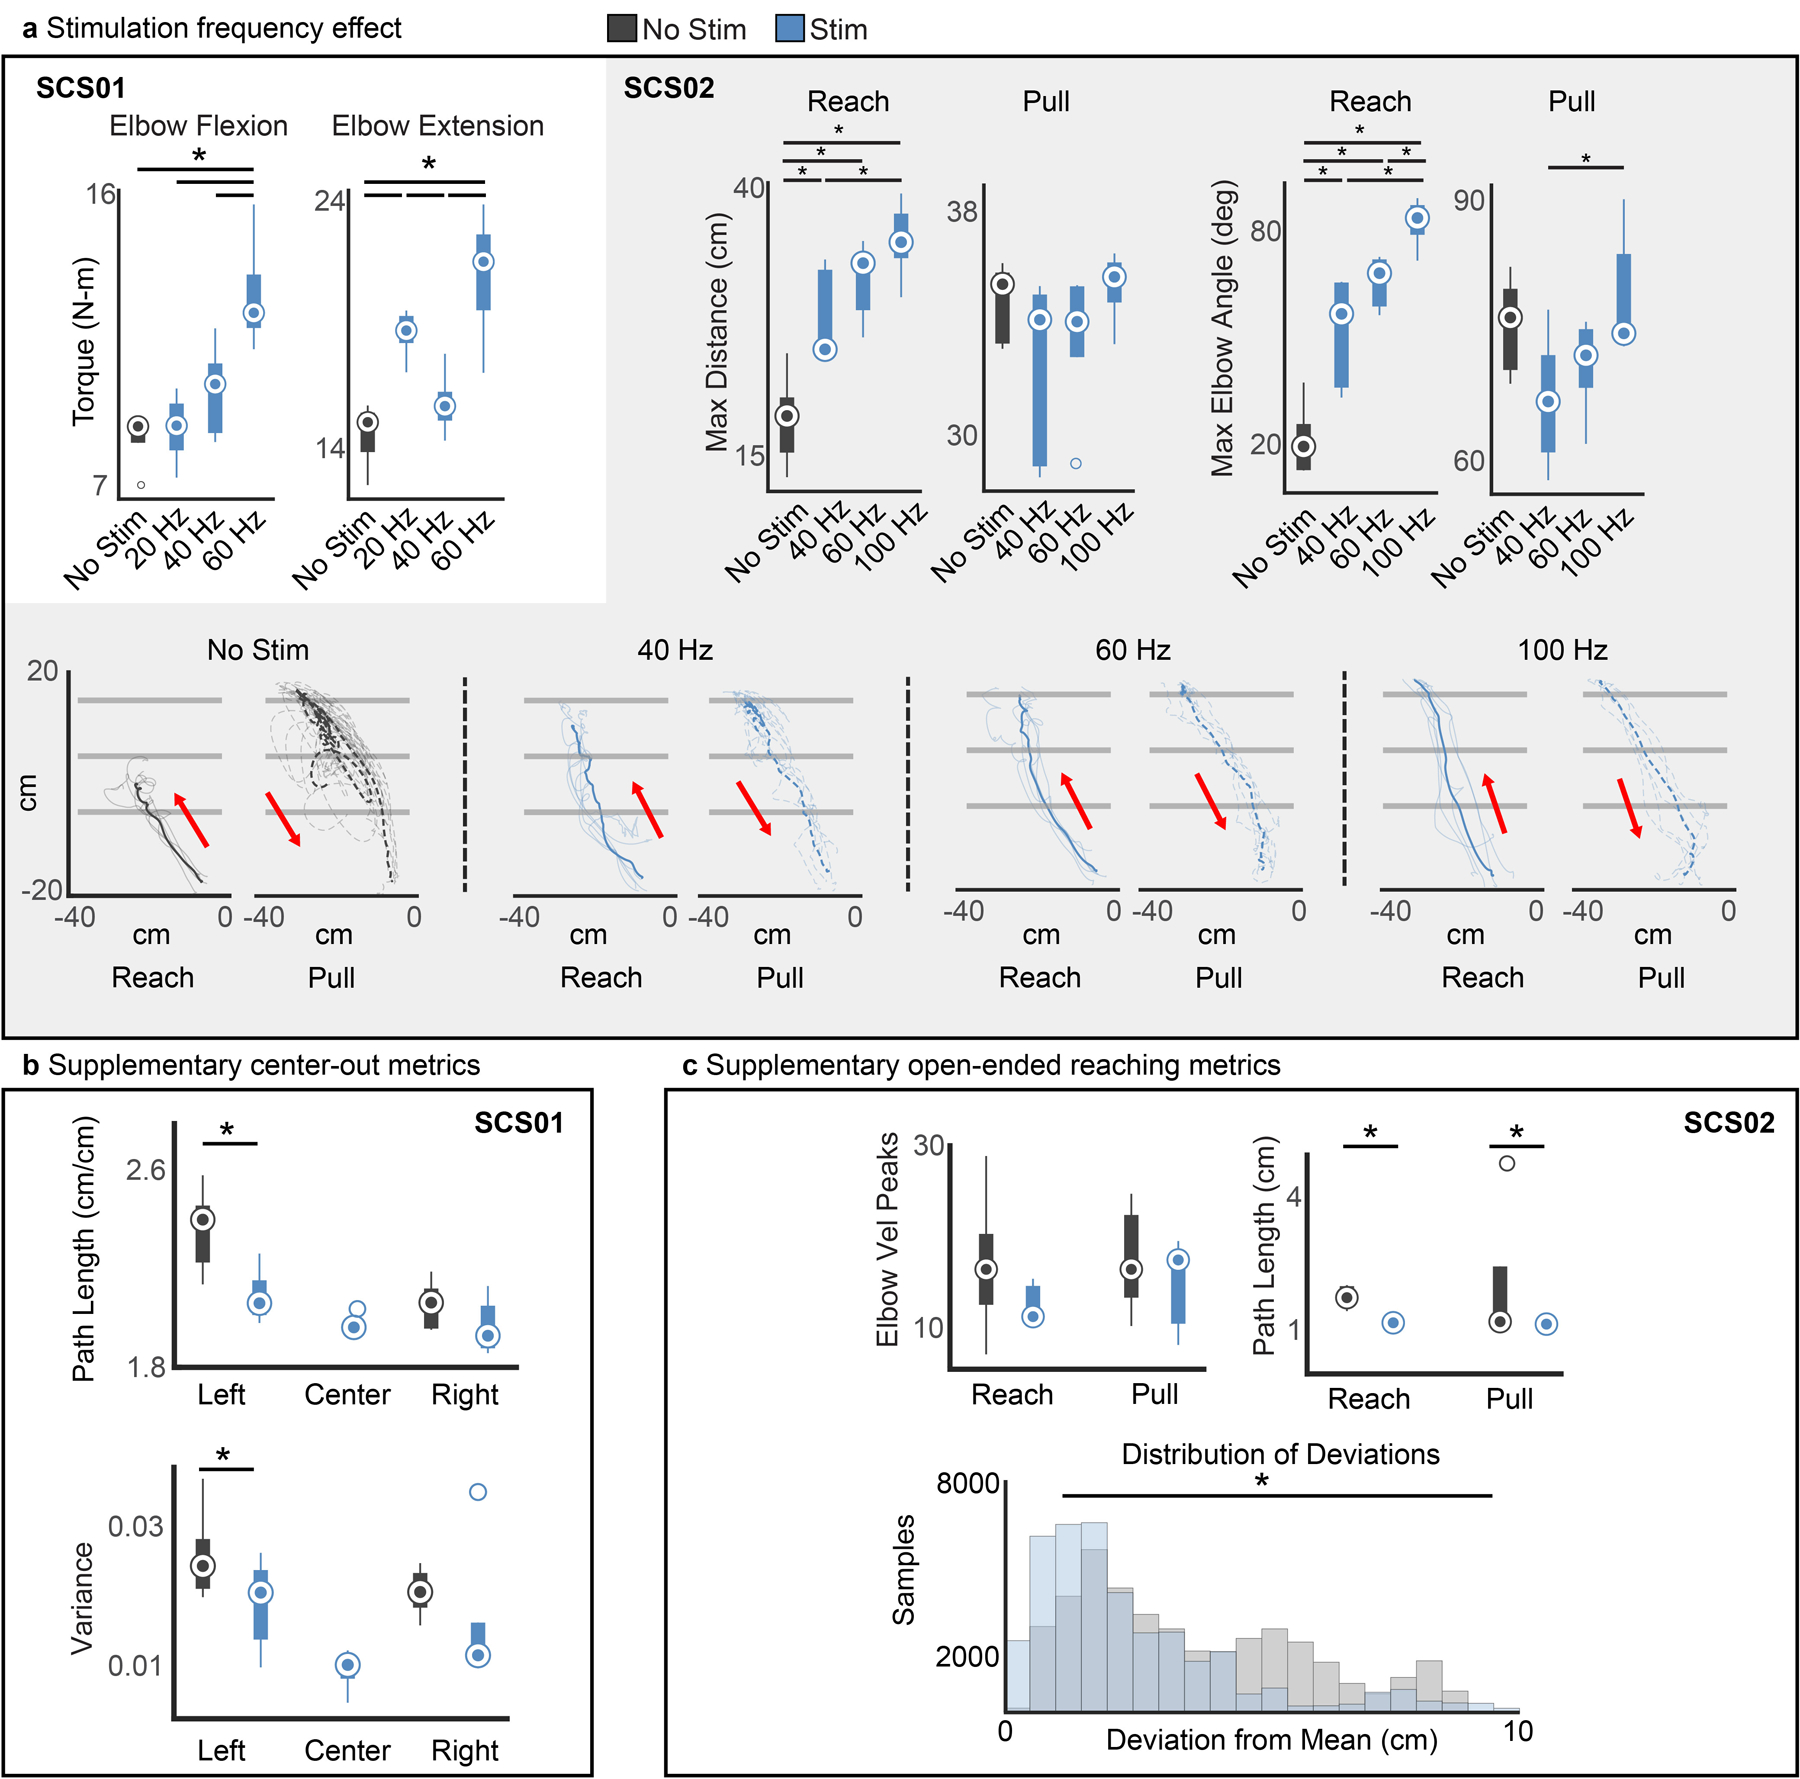
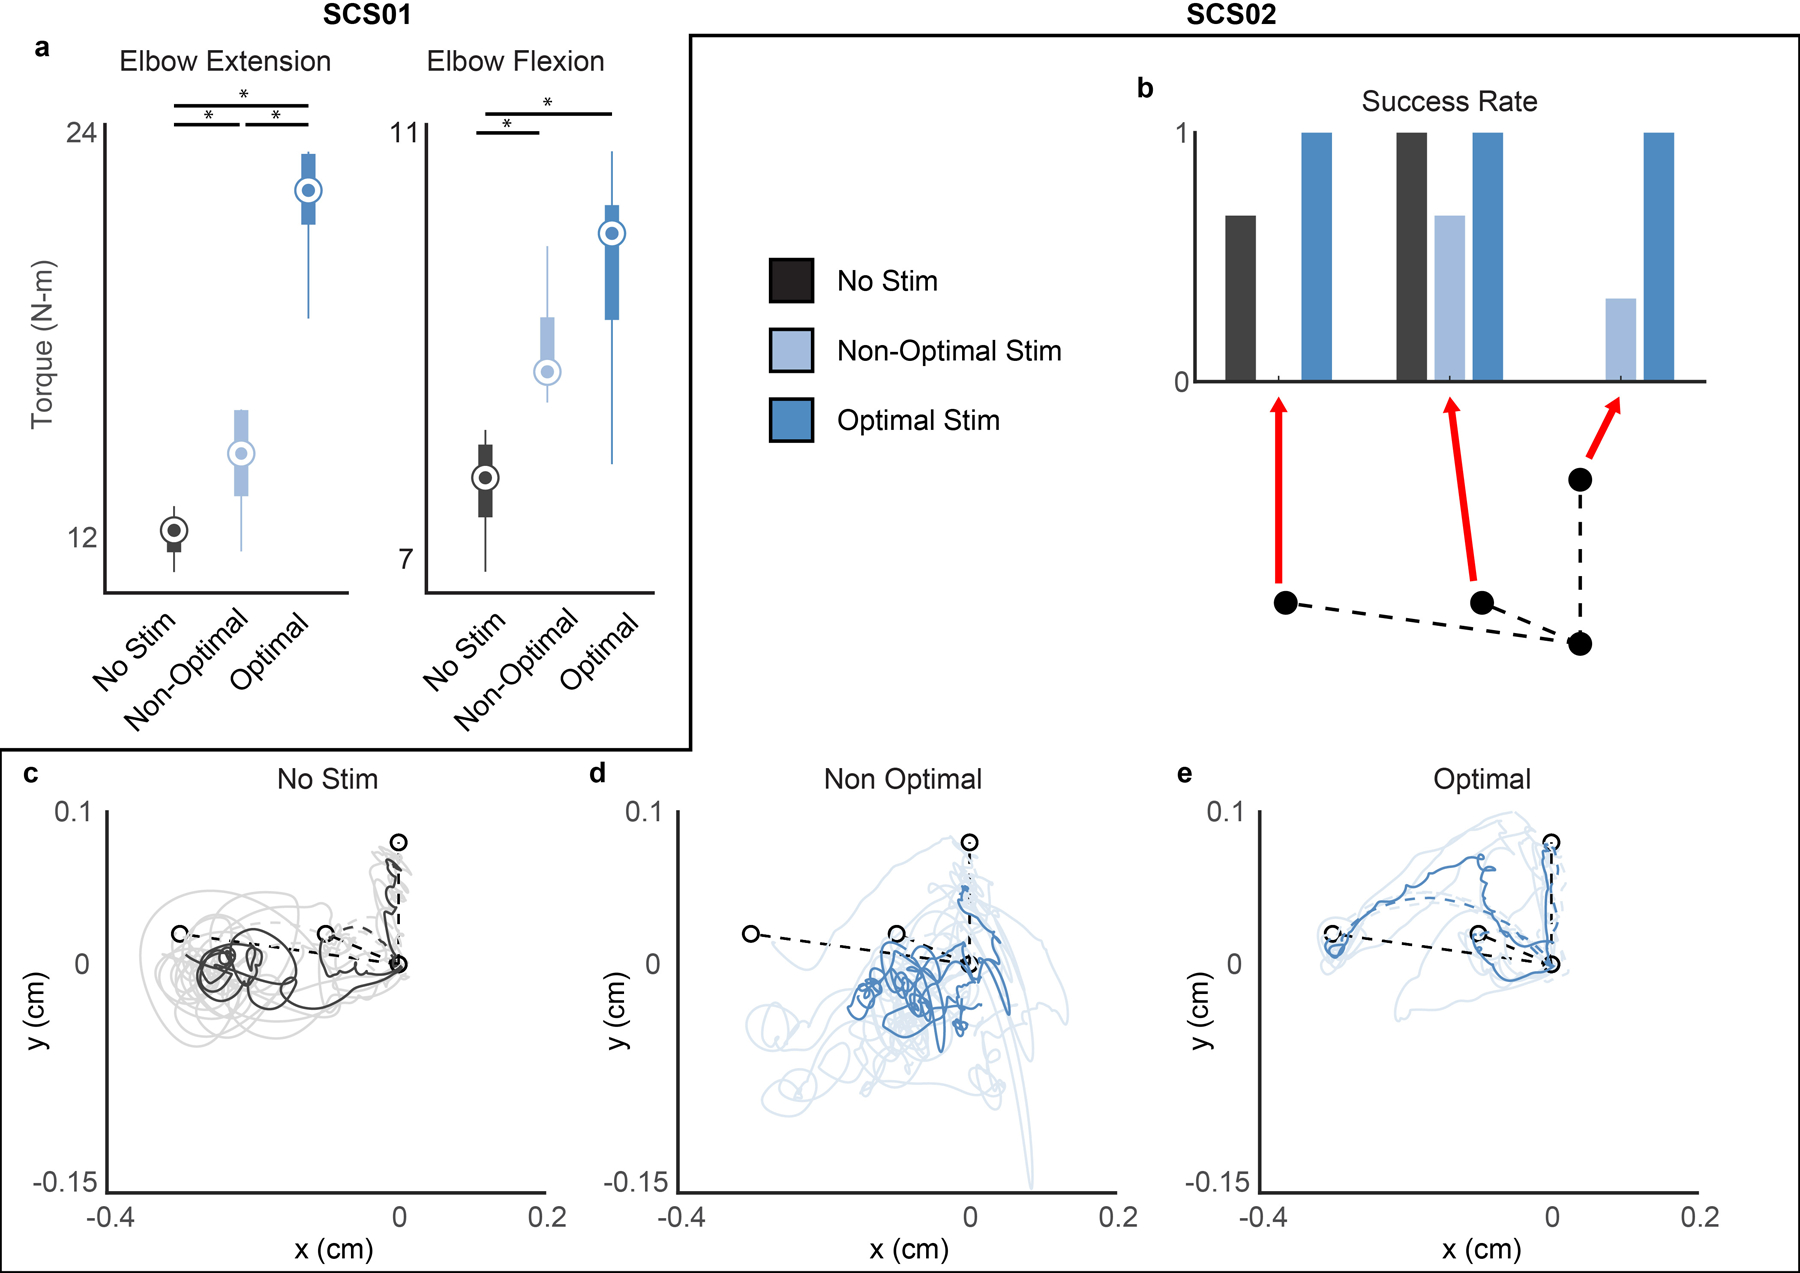
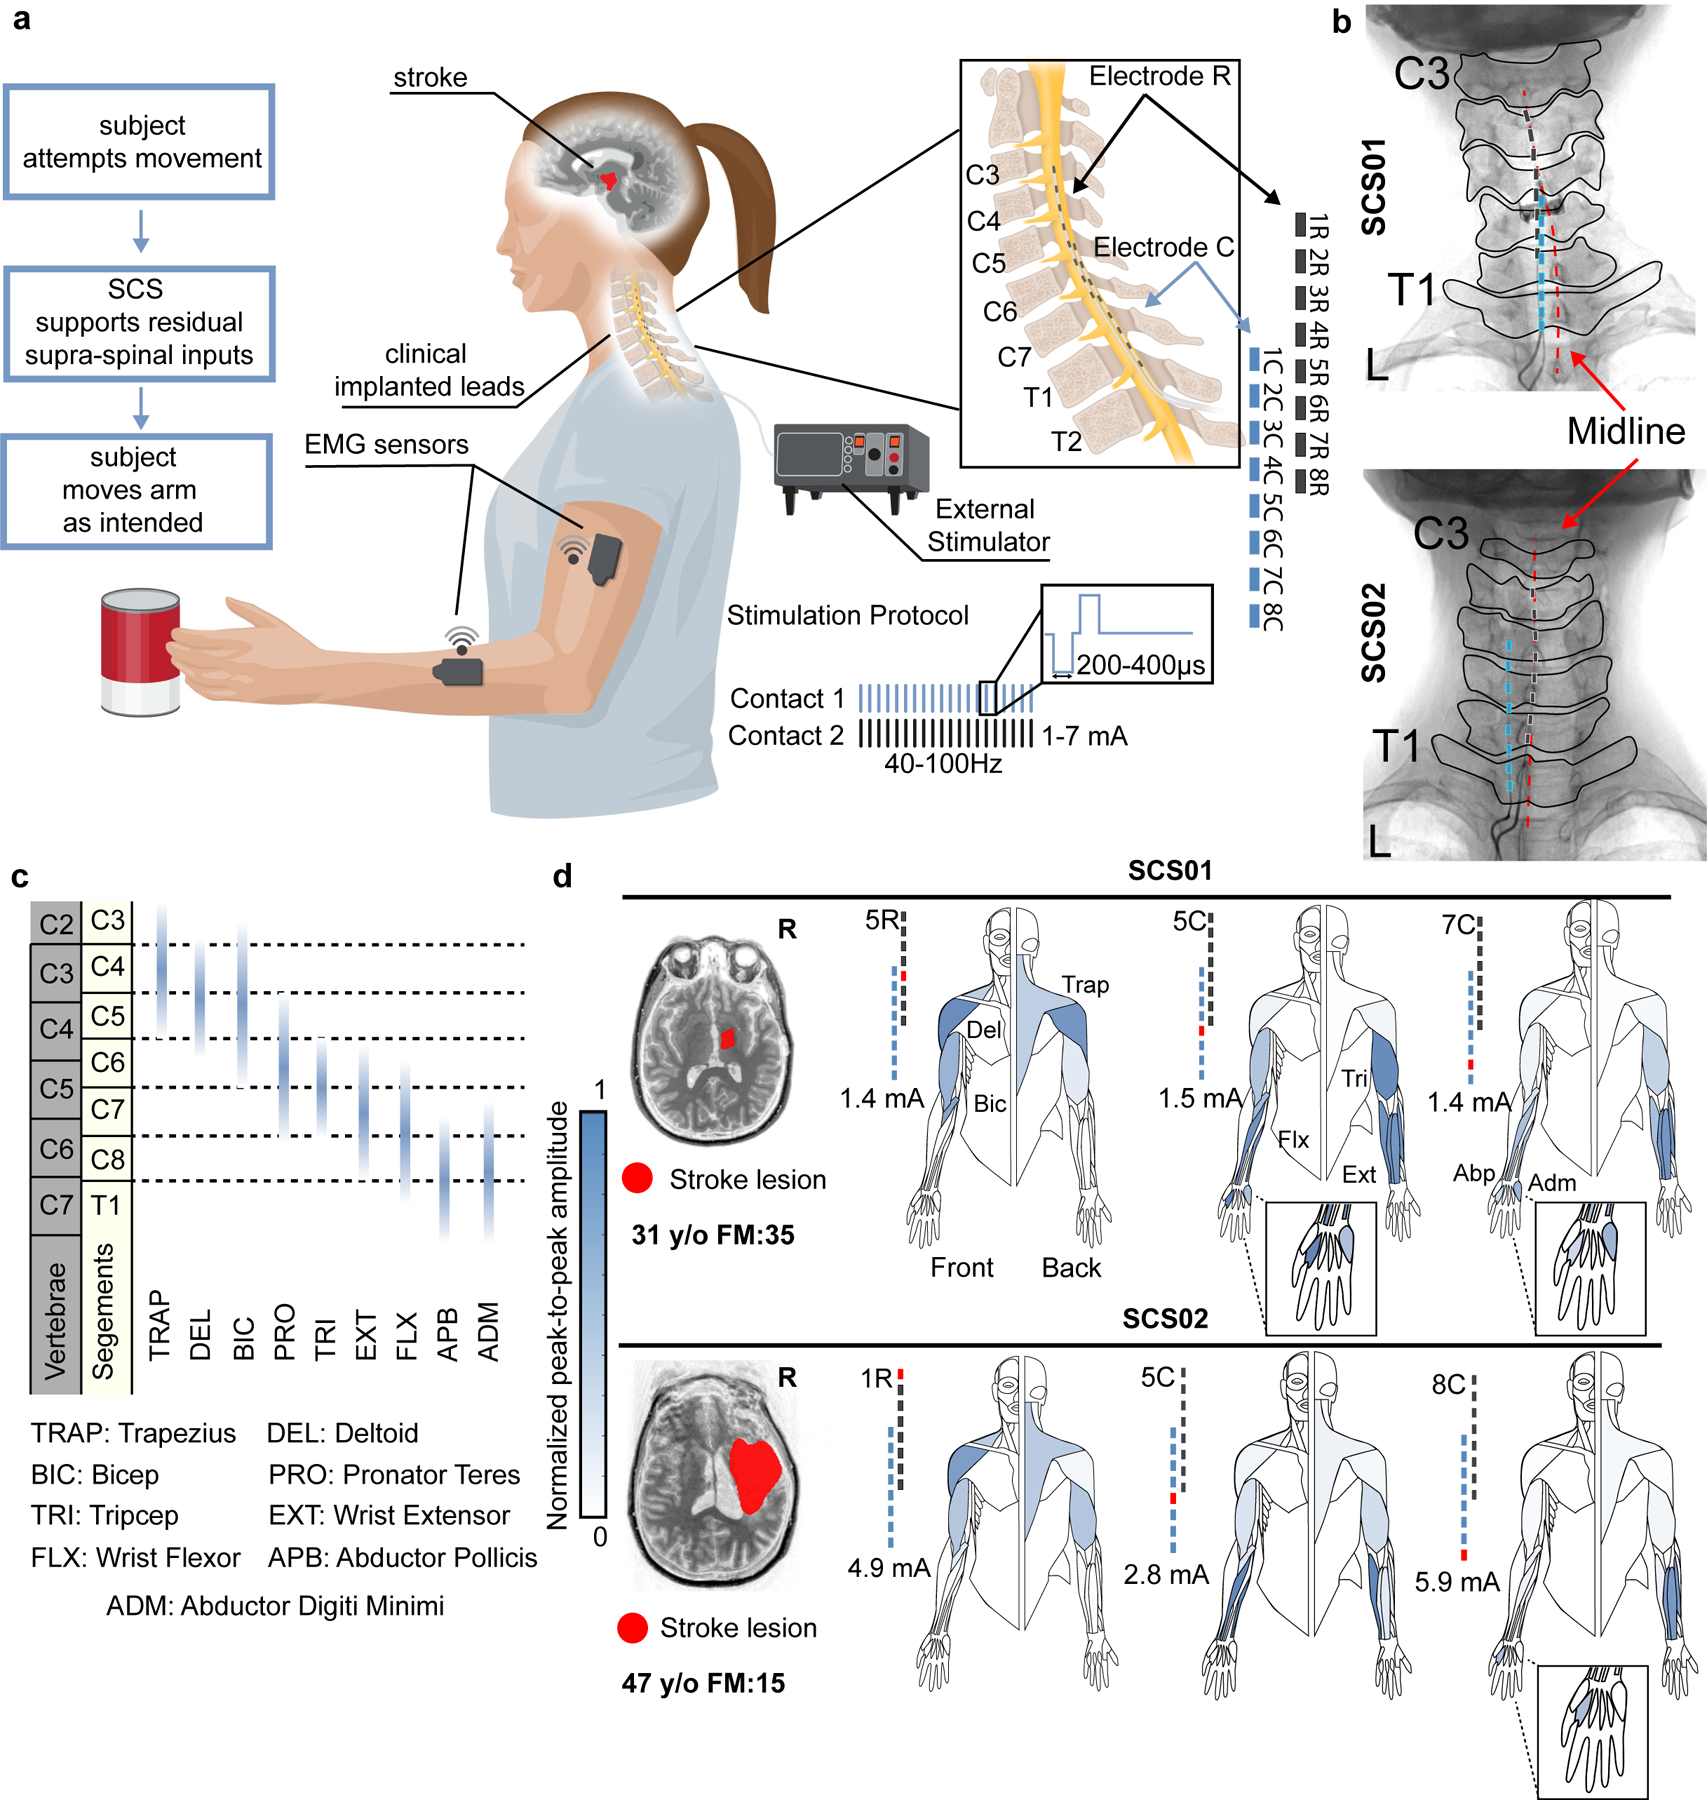
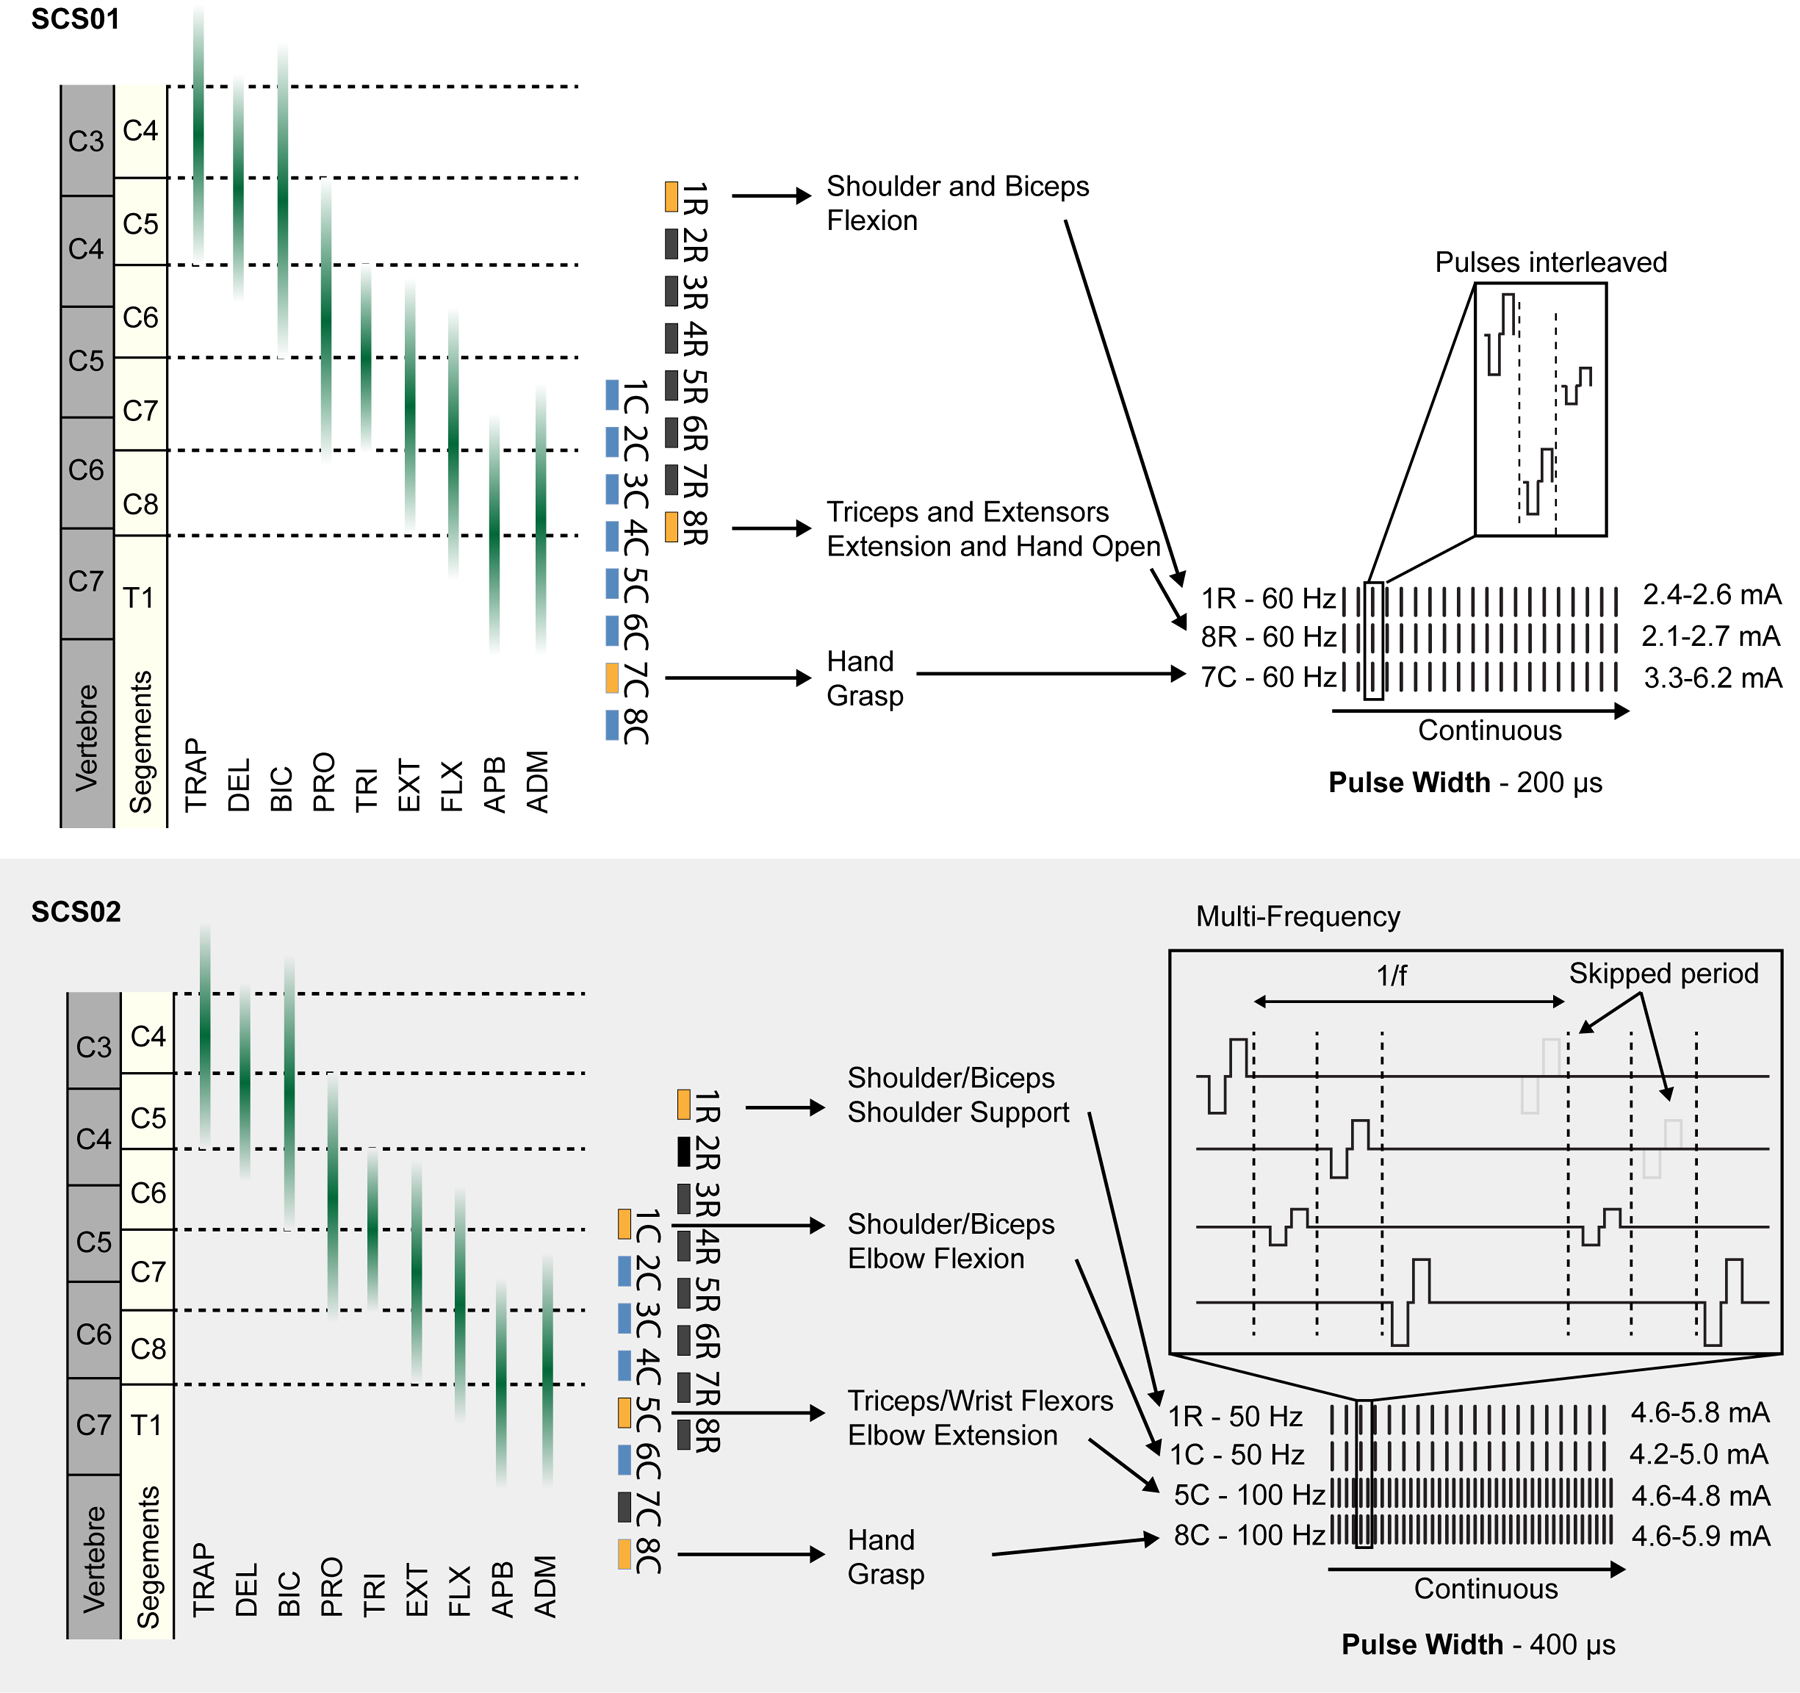
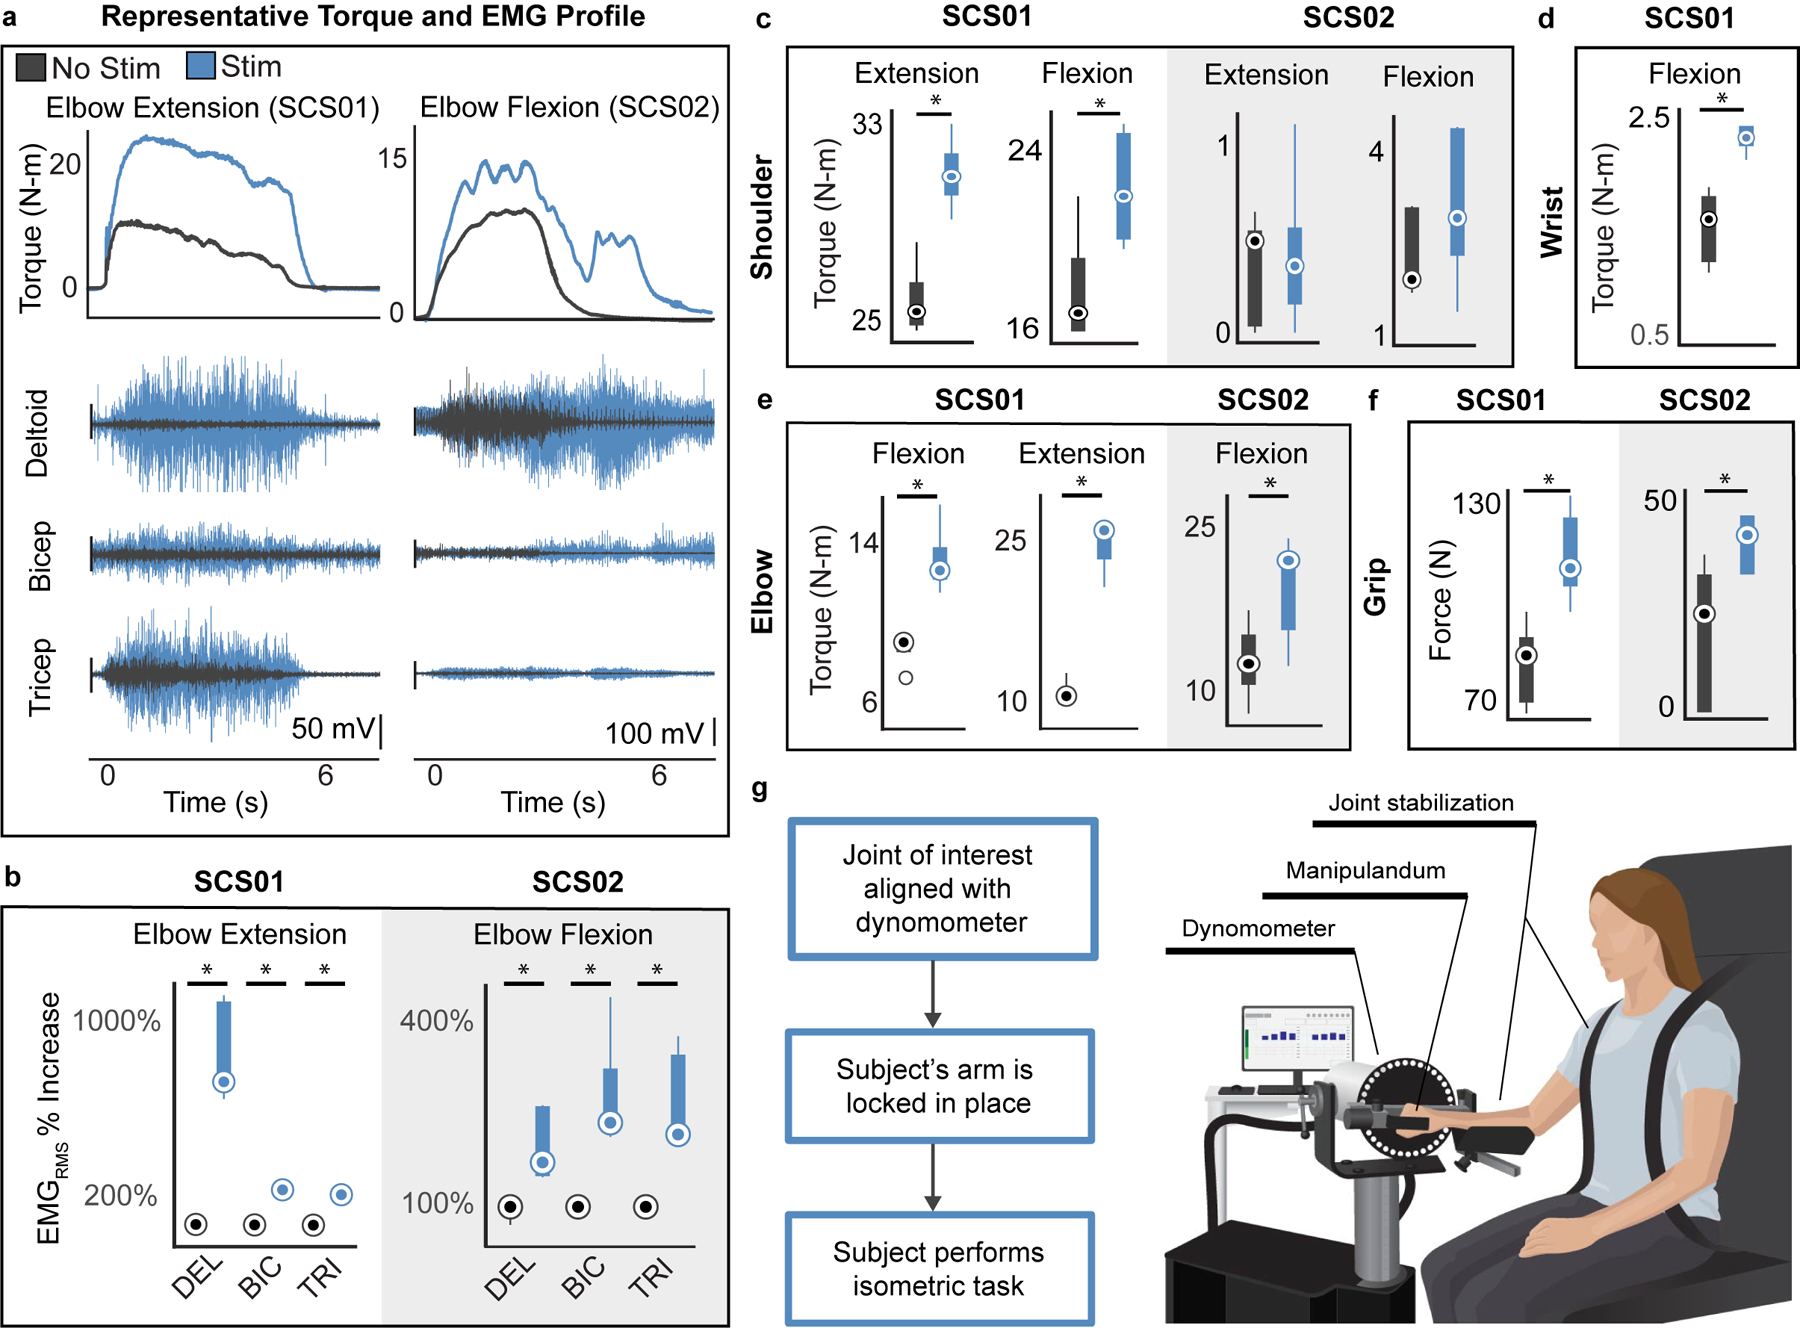
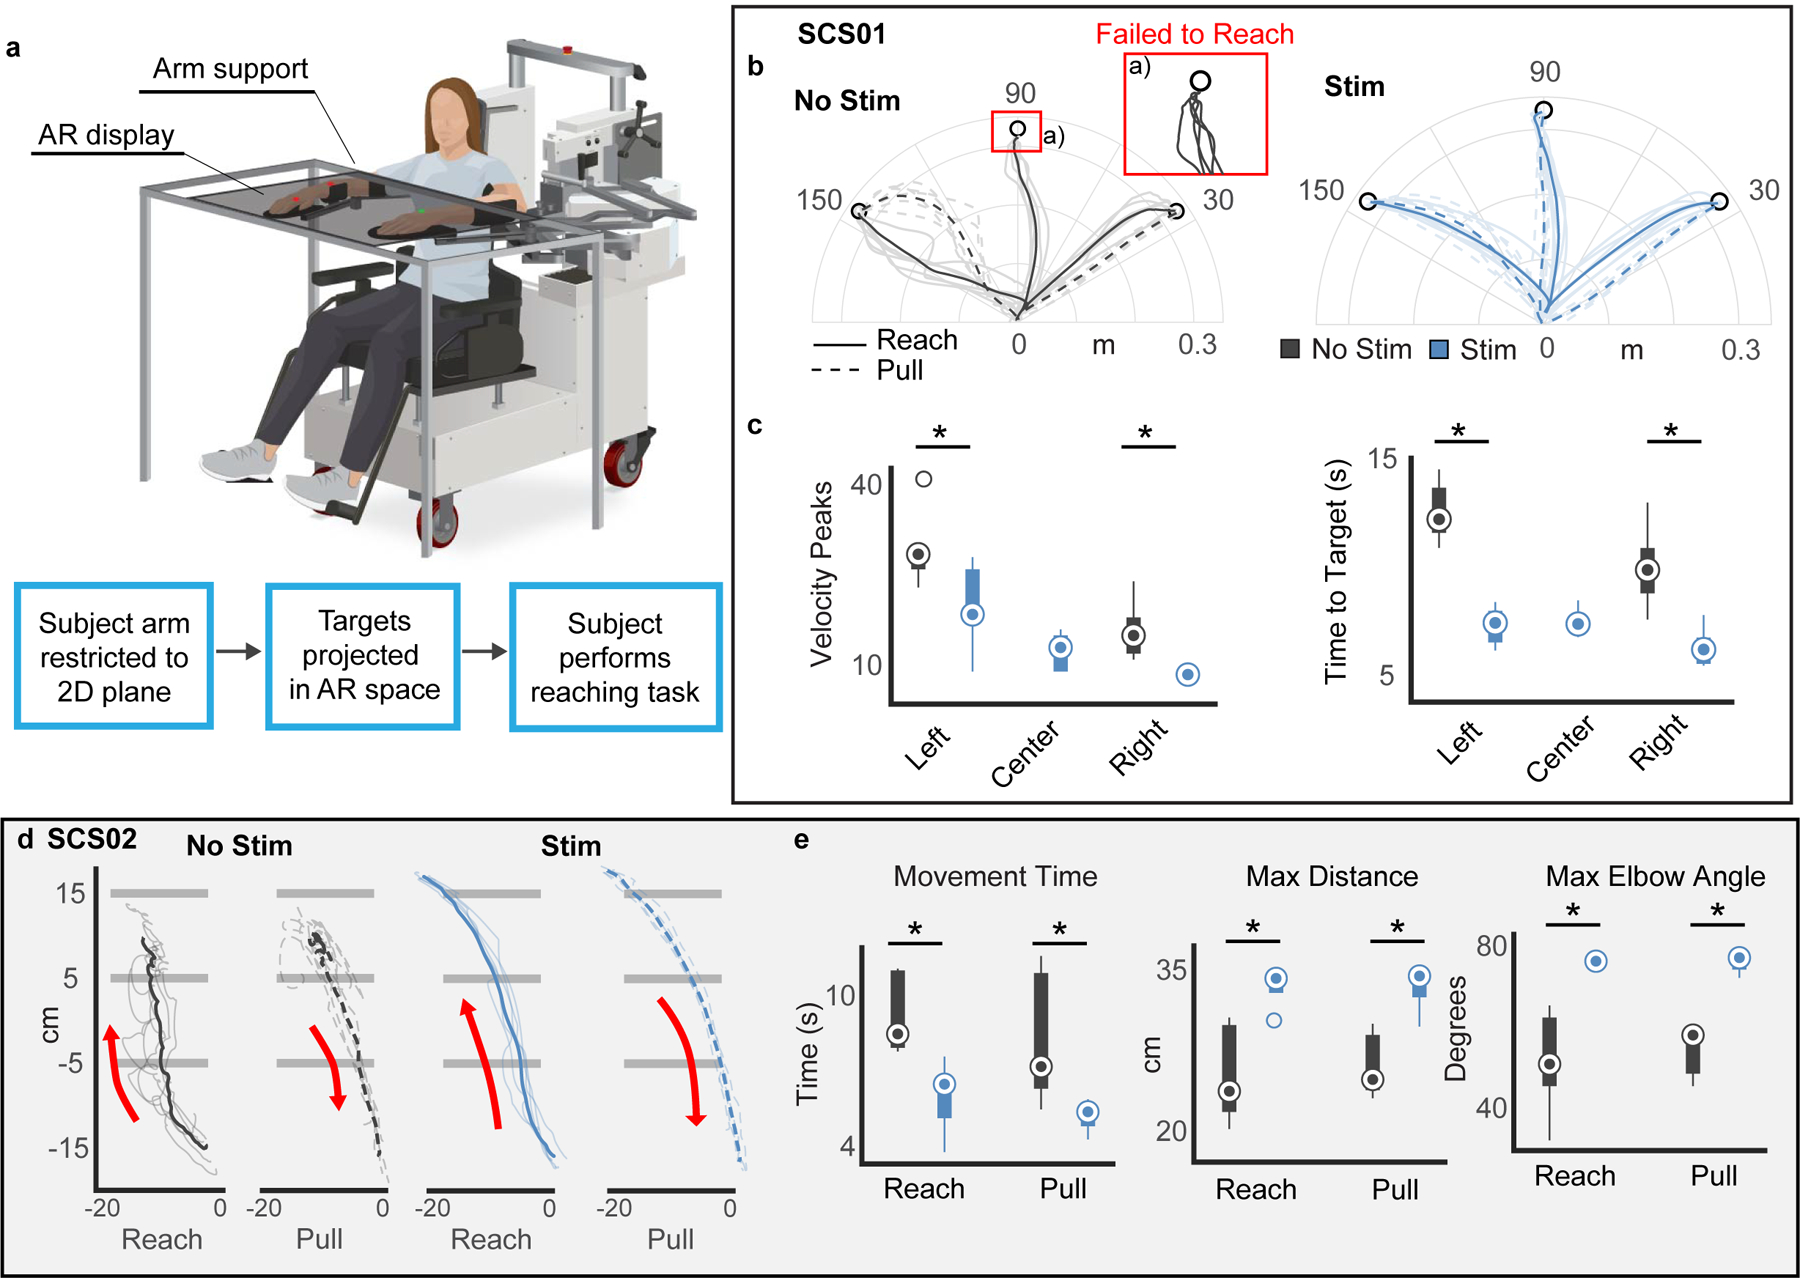
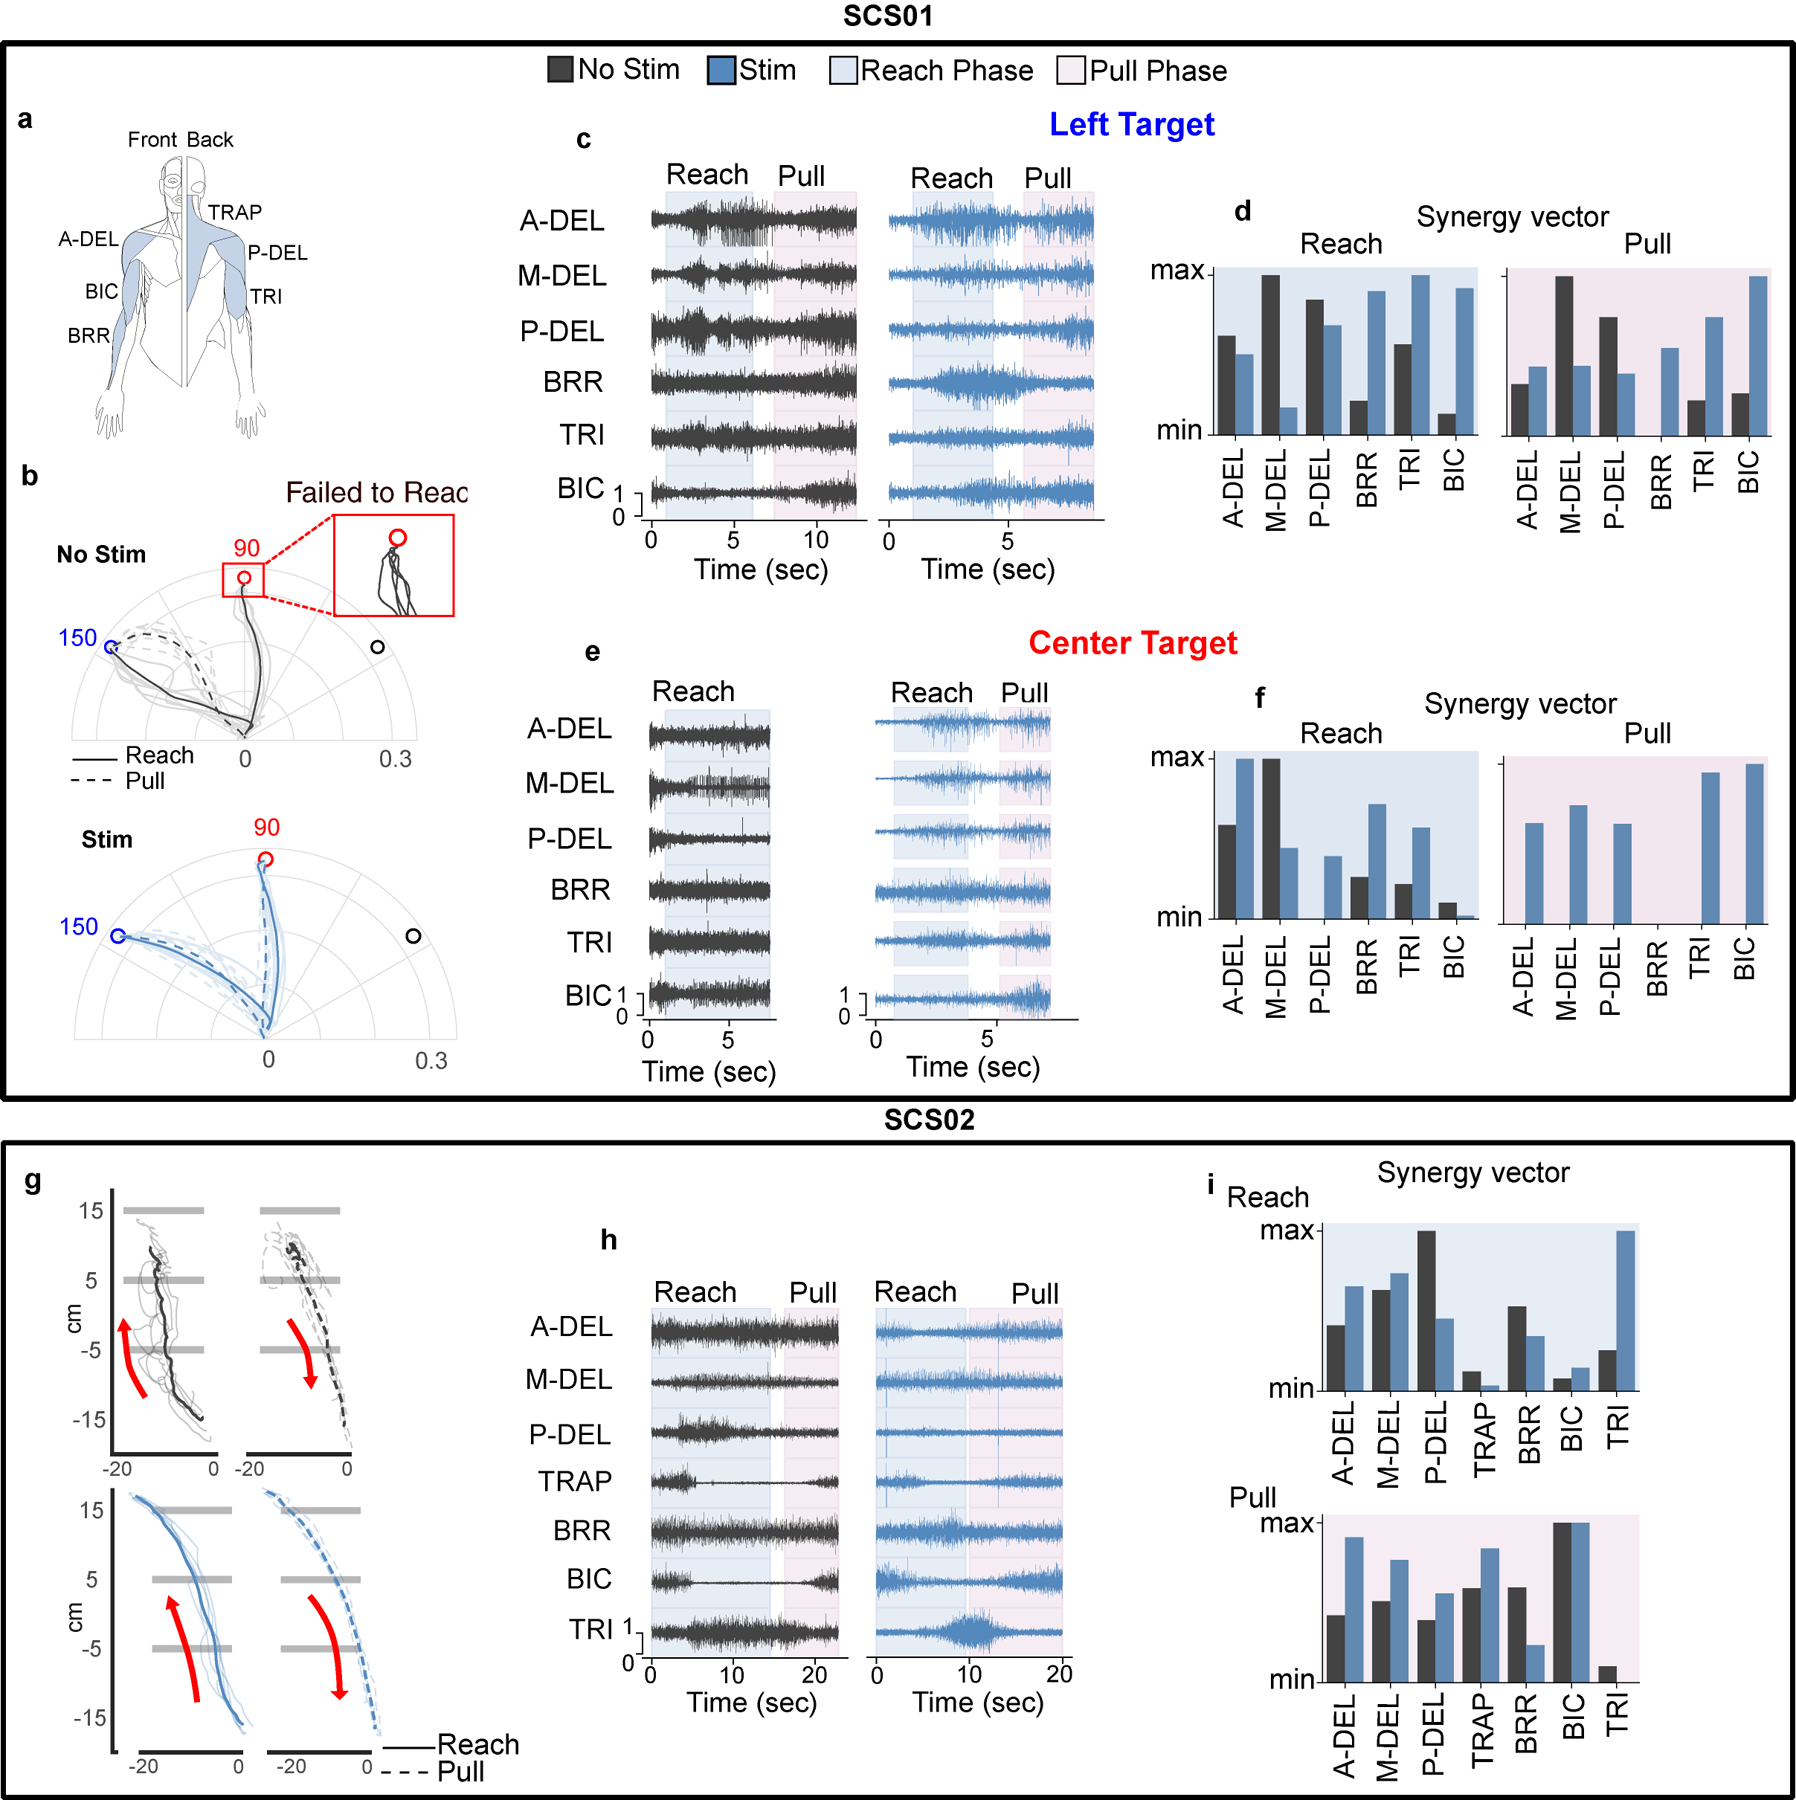
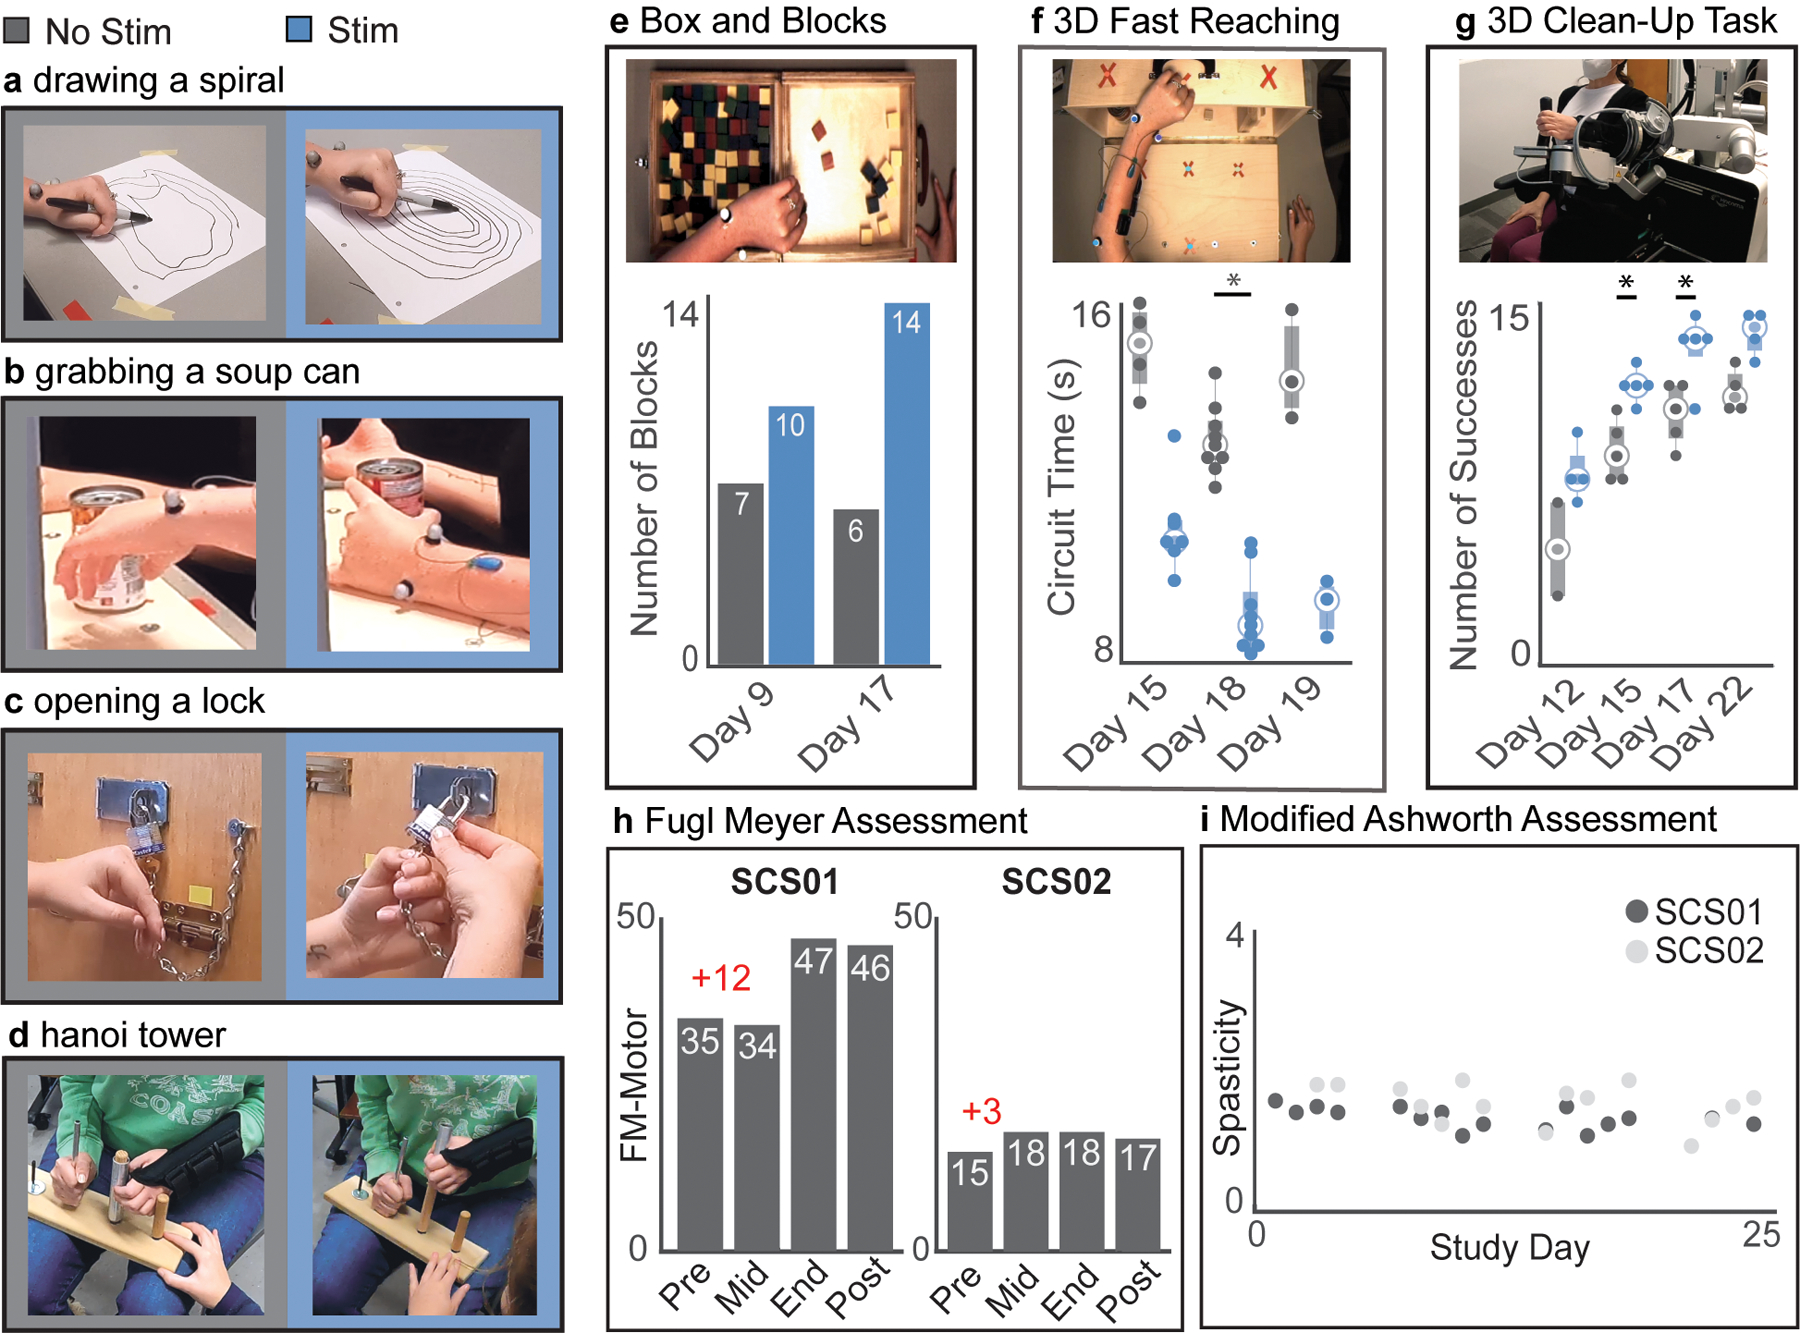
Cerebral strokes can disrupt descending commands from motor cortical areas to the spinal cord, which can result in permanent motor deficits of the arm and hand. However, below the lesion, the spinal circuits that control movement remain intact and could be targeted by neurotechnologies to restore movement. Here we report results from two participants in a first-in-human study using electrical stimulation of cervical spinal circuits to facilitate arm and hand motor control in chronic post-stroke hemiparesis ( NCT04512690 ). Participants were implanted for 29 d with two linear leads in the dorsolateral epidural space targeting spinal roots C3 to T1 to increase excitation of arm and hand motoneurons. We found that continuous stimulation through selected contacts improved strength (for example, grip force +40% SCS01; +108% SCS02), kinematics (for example, +30% to +40% speed) and functional movements, thereby enabling participants to perform movements that they could not perform without spinal cord stimulation. Both participants retained some of these improvements even without stimulation and no serious adverse events were reported. While we cannot conclusively evaluate safety and efficacy from two participants, our data provide promising, albeit preliminary, evidence that spinal cord stimulation could be an assistive as well as a restorative approach for upper-limb recovery after stroke.


Conflict of interest statement

COMPETING INTERESTS STATEMENT

MP, DW, MC and PG are founders and shareholders of Reach Neuro Inc. a company developing spinal cord stimulation technologies for stroke. EP has interest in Reach Neuro Inc due to personal relationship with MC. MP, DW, MC, PG, EP, ES, NV and EC are inventors on patents related to this work. All other authors declare no competing interests.

Figures

Extended Data Figure 1 |
Extended Data Figure 1 |. Lesion characterization and Lead position over time.
(a) sagittal, coronal, and axial T1- weighted MRI 2D projections for SCS01 and SCS02. The segmented lesion is shown in red for both participants. R indicates the Right hemisphere. (b) High-definition fiber tracking of the corticospinal tract (CST) for SCS01 and SCS2. Colored fibers represent estimated CTS axons from the affected (right) and unaffected (left) hemisphere. Significant reduction in number of tracked fibers in the right hemisphere is clear in both participants in consequence of the stroke. (c) Repeated X-rays for SCS01 (left) and SCS02 (right) showing the position of the spinal leads. The red lines mark the same anatomical location across the X-rays to facilitate interpretation. Minimal displacement occurred after initial implantation.
Extended Data Figure 2 |
Extended Data Figure 2 |. SCS parameters set using a custom-built controller.
(a) An image of the stimulator (DS8R, left) and 1-to-8 channel multiplexer (D188, right) used to deliver stimulation pulses. (b) An overview of the control scheme used to deliver patterns of stimulation. A PC running a (c) MATLAB based GUI communicated with a microcontroller using a custom (d) communication protocol over a virtual serial port. The microcontroller’s firmware delivered pulse triggers and amplitude control signals to the stimulator as well as an 8 bit parallel channel selection signal to the multiplexer in order to control pulse timing, amplitude, and output channel. Current was delivered from the stimulator through the multiplexer and ultimately to the selected electrode on the implanted spinal array. (c) The GUI interface allowed for configuring all stimulation parameters including active channels, stimulation frequency, pulse train duration (or continuous), pulse train latency, and stimulation amplitude for each active channel. Once configured, stimulation was initiated or terminated via the software interface. The software also allowed for rapid changes in either global stimulation frequency (nudge frequency) or channel amplitude (nudge amplitude). (d) A custom command protocol layer was developed on top of a UART serial interface to enable communication between the GUI and microcontroller. Each packet from the master (PC) to the slave (microcontroller) comprised a 1 byte packet length, 1 byte command, and 0–6 bytes of payload. A payload comprised a 1 byte parameter (to be read or written), a 1 byte channel number (when appropriate), and the value to be written (when ‘write’ command was used). Microcontroller response packets comprised a 1 byte packet length, 1 byte command echo, 0–32 bytes of payload (used to return parameter values during ‘read’ command), and a 1 byte success flag. (e) The microcontroller firmware allowed for pseudo-synchronous stimulation across multiple channels by interleaving pulses on all active channels. A delay of at least 1 ms between each pulse allowed enough time for the multiplexer to fully switch channels. The same pattern of pulses was delivered every period as defined by the stimulation frequency. Each channel could also be configured to deliver a single pulse, a pulse train with finite duration and/or latency, continuous stimulation, or a ‘recruitment curve’ in which the amplitude was gradually increased for successive pulse trains of specified length.
Extended Data Figure 3 |
Extended Data Figure 3 |. Muscle recruitment curves.
In each panel we show the recruitment curves obtained with stimulation at 1 Hz at increasing current amplitude for 11 arm and hand muscles: TRAP: trapezius, A, P, M DEL: anterior, posterior and medial deltoid respectively, BIC: biceps, TRI: triceps, EXT: Extensor carpi, FLX: flexor carpi, PRO: pronator teres, ABP: abductor pollicis and ADM: abductor digiti minimi. Below each set of recruitment curves we report the graphical representation of the muscle activation obtained at the amplitude indicated on the left of each human figurine. Interpretation of human figurines is reported in the bottom right. Each muscle is colored with a color scale (on the left) representing the normalized peak-to-peak amplitude of EMG reflex responses obtained at the stimulation amplitude indicated on the left. Peak-to-peak values for each muscle are normalized to the maximum value obtained for that muscle across all contacts and all current amplitudes.
Extended Data Figure 4 |
Extended Data Figure 4 |. Frequency dependent suppression.
To demonstrate that SCS recruits arm and hand muscles via direct activation of the primary afferents we performed stimulation at multiple frequencies. The figure reports the spinal reflexes obtained when stimulating at 1, 5, 10 and 20Hz from multiple contacts and multiple muscles. Each plot on the top shows the normalized peak-to-peak reflex amplitude as a function of frequency showing in the muscles that respond to the specific contact substantial frequency dependent suppression at stimulation frequencies greater than 10Hz. On the bottom, we report raw EMG traces that show the classic phenomenon. At 5Hz each pulse of stimulation corresponds to a clear evoked potential in the EMG albeit amplitude slightly diminishes at each pulse. At 10Hz, modulation of peak-to-peak amplitudes becomes more evident, at 20Hz almost complete suppression of EMG evoked responses subsequent to the first is shown. Example is taken from Pronator muscles, contact 1C, (highlighted in darker grey in the top panel).
Extended Data Figure 5 |
Extended Data Figure 5 |. SCS improves arm kinematics supplementary metrics.
(a) Effect of stimulation frequency shown for SCS01 and SCS02. In SCS01, quantification of isometric torques during single joint flexion and extension is shown for the elbow during no stim (dark grey), 20 Hz (blue), 40 Hz (blue), and 60 Hz (blue). In SCS02, maximum reached distance and elbow angle excursion (max-min) are reported during reach and pull of the reach-out task for no stim (dark grey), 20 Hz (blue), 40 Hz (blue), and 60 Hz (blue). Raw endpoint trajectories for SCS02 are shown in the reach out task during no stim (dark grey), 20 Hz (blue), 40 Hz (blue), and 60 Hz (blue) where SCS02 was tasked to reach beyond the third horizontal line to complete the task. Reach (solid line) and pull (dashed line) trajectories are represented in separate plots. Darker lines represent average trajectories, shaded lines represent single trajectories. (b) Quantification of kinematic features for SCS01, path length for completed reach and pull of three targets in cm and variance of the path between trials are reported for no-stim (dark grey) and stim condition (blue). Center target could not be calculated for no-stim condition because SCS01 did not complete the task. (c) Quantification of kinematic features for SCS02, movement smoothness (velocity peaks) and path length in cm for reach and pull separately are reported for no-stim (dark grey) and stim condition (blue). The distribution of deviations from the mean path trajectory is shown in cm (equivalent to variance in SCS01). Statistics Distributions of deviations were compared using a two-sample Kolmogorov-Smirnov non-parametric test with alpha=0.05 where p~=0 (where the value was smaller than able to be stored in a double precision variable). All other quantifications are reported using box-plots. For each box, the central circle indicates the median while the bottom and top edges of the box indicate the 25th and 75th percentiles, respectively. The whiskers extend to the minima and maxima data points, not considering outliers. Any outliers are plotted individually with additional circles. Inference on mean differences is performed by bootstrapping the n=5 repetitions obtained for each measurement, with n=10,000 bootstrap samples, and by using a Bonferroni correction when performing multiple comparisons; * indicates statistical significance and rejection of the null hypothesis of no difference with a 95% confidence interval.
Extended Data Figure 6 |
Extended Data Figure 6 |. Optimized SCS leads to best improvement.
(a) Quantification of isometric torques during single joint flexion and extension of the elbow during no stim (dark grey), non-optimal stim (light blue), and optimal stim (blue) for SCS01. (b) Quantification of performance for three targets of the center-out task during no stim (dark grey), non-optimal stim (light blue), and optimal stim (blue) normalized from 0 (SCS02 never reached target) and 1 (SCS02 reached target in all trials). n=3 (c-e) Raw endpoint trajectories by SCS02 for three targets of the center-out task during no stim (dark grey), non-optimal stim (light blue), and optimal stim (blue). Darker lines represent average trajectories, shaded lines represent single trajectories. Statistics For quantifications reported using box-plots, the central circle indicates the median while the bottom and top edges of the box indicate the 25th and 75th percentiles, respectively. The whiskers extend to the minima and maxima data points, not considering outliers. Any outliers are plotted individually with additional circles. Inference on mean differences for (a) were performed by bootstrapping the n=5 repetitions obtained for each measurement, with n=10,000 bootstrap samples, and by using a Bonferroni correction when performing multiple comparisons; * indicates statistical significance and rejection of the null hypothesis of no difference with a 95% confidence interval.
Figure 1 |
Figure 1 |. Experimental set-up and stimulation arrangement.
(a) Schematic of the experimental apparatus and paradigm. While participants performed an upper limb motor task, we measured wireless electromyographic (EMG) activity from muscles of the arm and hand. We delivered electrical stimulation to the cervical spinal cord via two 8-contact leads (Rostral, R; Caudal, C) implanted in the cervical spinal cord. Simultaneous stimulation through selected contacts was controlled via percutaneous connections using an external stimulator. (b) X-rays of both participants showing the location of the contacts of the Rostral (blue) and Caudal (dark grey) leads with respect to the midline (in dashed red). (c) Location of the motoneurons of arm and hand muscles in the human spinal cord in relation to spinal segments (light yellow) and vertebrae (grey). We estimated the rostro-caudal position of motoneuron pools (blue) from Schirmer 2011. (d) Graphical representation of muscle activation obtained by stimulating through selected contacts (labeled in red on the left of each human figurine). Each human figurine represents the front view (left half) and back view (right half) of arm muscles (See also Extended Data Figure 3). Each muscle is colored with a color scale (on the left) representing the normalized peak-to-peak amplitude of EMG reflex responses obtained during 1 Hz stimulation at the stimulation amplitude indicated on the left. Peak-to-peak values for each muscle are normalized to the maximum value obtained for that muscle across all contacts and all current amplitudes. On the left, MRI of each participant is shown with segmented lesion in red.
Figure 2 |
Figure 2 |. Optimized continuous stimulation protocols.
Stimulation protocol used to achieve maximum assistive benefit for SCS01 (top) and SCS02 (bottom). (top) For SCS01, contacts 1R and 8R on the rostral lead and 7C on the caudal lead were simultaneously and continuously activated at a fixed 60 Hz frequency and 200 µs pulse width. These electrodes corresponded shoulders and biceps (1R); triceps, extensors, and hand opening (8R); and hand grasp (7C). Amplitudes were changed daily based on participant preference and were set to 2.4–2.6 mA (1R), 2.1–2.7 mA (8R), and 3.3–6.2 mA (7C). (bottom) For SCS02, contacts 1R on the rostral lead, and 1C, 5C, and 8C on the caudal lead were simultaneously and continuously stimulated. These electrodes corresponded to muscles related to shoulder support (1R); elbow flexion (1C); elbow extension and wrist flexion (5C); and hand grasp (8C). Contacts 1R and 1C were stimulated at 50 Hz while 5C and 8C were stimulated at 100 Hz all at a fixed pulse width of 400 µs. A reduced frequency was used on contacts corresponding to elbow flexion to bias the assistive benefit of stimulation toward elbow extension. Multi-frequency stimulation was achieved by skipping every other period of a 100 Hz stimulation protocol on channels stimulating at 50 Hz. Location of the motoneurons of arm and hand muscles in the human spinal cord in relation to spinal segments (light yellow) and vertebrae (grey) is shown on the left for SCS01 and SCS02. We estimated the rostro-caudal position of motoneuron pools (green) from Schirmer 2011.
Figure 3 |
Figure 3 |. SCS immediately improved strength.
(a) examples of single synchronized raw traces for torques and EMGs signals during isometric maximum voluntary contractions for extension (SCS01, left) and flexion (SCS02, right) of the elbow in the HUMAC NORM (see panel g). (b) quantification of the root mean square value of EMG traces with and without stimulation during isometric elbow extension (SCS01) and flexion (SCS02) (c, d, e) quantification of isometric torques during single joint flexion and extension for SCS01 and SCS02 at shoulder, elbow and wrist (f) quantification of isometric grip-strength measured with a hand-held dynamometer with and without stimulation. (g) schematic of the isometric torque test (wrist configuration in the example) in the HUMAC NORM. Statistics all quantifications are reported using box-plots. For each box, the central circle indicates the median while the bottom and top edges of the box indicate the 25th and 75th percentiles, respectively. The whiskers extend to the minima and maxima data points, not considering outliers. Any outliers are plotted individually with additional circles. Inference on mean differences is performed by bootstrapping the n=5 repetitions obtained for each measurement, with n=10,000 bootstrap samples; * indicates statistical significance and rejection of the null hypothesis of no difference with a 95% confidence interval.
Figure 4 |
Figure 4 |. SCS immediately improves arm kinematics.
(a) schematic of the experimental set-up for planar reach out tasks using the KINARM. (b) Examples of raw endpoint trajectories for SCS01 in the reach out task without stimulation (dark grey,left) and with stimulation (blue, right). Inset shows inability to reach central target without stimulation. Solid lines are reach trajectories and dashed lines represent pull trajectories. Darker lines represent average trajectories, shaded lines represent individual trajectories. (c) Quantification of kinematic features, movement smoothness (velocity peaks) and time to reach target in seconds. Center target could not be calculated for no-stim condition because SCS01 did not complete the task. (d) Examples of raw endpoint trajectories for SCS02 in the reach out task. SCS02 was tasked to reach beyond the third horizontal line to complete the task. Reach (solid line) and pull (dashed line) trajectories are represented in separate plots. Darker lines represent average trajectories, shaded lines represent individual trajectories. (e) Quantification of kinematic features for SCS02, Reach time (equivalent to time to target in SCS01), Maximum reached distance and elbow angle excursion (max-min) are reported for no-stim (dark grey) and stim condition (blue). Statistics all quantifications are reported using box-plots. For each box, the central circle indicates the median while the bottom and top edges of the box indicate the 25th and 75th percentiles, respectively. The whiskers extend to the minima and maxima data points, not considering outliers. Any outliers are plotted individually with additional circles. Inference on mean differences is performed by bootstrapping the n=6 (center out) or n=5 (open-ended reaching) repetitions obtained for each measurement, with n=10,000 bootstrap samples; * indicates statistical significance and rejection of the null hypothesis of no difference with a 95% confidence interval.
Figure 5 |
Figure 5 |. Muscle activation pattern during planar movement.
a) Muscle label abbreviation used in the figure. Respective muscles are highlighted in light blue. (b) Kinematic trajectories during planar center-out task for two different targets (left and center) for stimulation off (dark grey) and on (blue) conditions. The inset block shows the inability of SCS01 to reach to the center target without stimulation. Solid lines are reach trajectories and dashed lines represent pull trajectories. Darker lines represent average trajectories, shaded lines represent single trajectories. (c) Normalized EMG signals for the left target during reach (light blue highlight) and pull phase (pink highlight) without stimulation (dark grey) and with stimulation (blue). (d) synergy vector for the left target corresponding to the increasing time-series synergy activation. (e) Normalized EMG signals for the center target during reach (light blue highlight) and pull phase (pink highlight) without stimulation (dark grey) and with stimulation (blue). (f) Synergy vector for the center target with stimulation (blue) and without stimulation (dark grey) for reach (light blue highlight) and pull phase (pink highlight). (g) Kinematic trajectories for reaching-out task with stimulation (blue) and without stimulation (dark grey) for reach (solid line) and pull phase (dashed line) for SCS02. Darker lines represent average trajectories, shaded lines represent single trajectories. (h) Normalized EMG signals with stimulation (blue) and without stimulation (dark grey) during reach (blue highlight) and pull phase (pink highlight) for planar reaching-out task. (i) Synergy vector corresponding to the reach (blue highlight) and pull phase (pink highlight) of the movement with stimulation (blue) and without stimulation (dark grey).
Figure 6 |
Figure 6 |. SCS improves function.
(a,b,c) frame captures from videos showing improved functional abilities of different simulated activities of daily living: drawing a spiral, reaching and grasping a soup can, opening a lock for SCS01. Left no stimulation, right with stimulation. (d) picture report frames from video of SCS02 performing a modified “Hanoi tower” task in which she was tasked to move a hollow cylinder from a base pole to another. Left no stimulation, right with stimulation. (e,f) representative pictures and quantification of task performances for SCS01 box and blocks and 3D fast reaching tasks performed on multiple days. Individual data points are also shown as some datasets contain less than 5 data points. (g) picture of the 3D reaching task using the Armeo Power for SCS02 and relative task performance on multiple days. Individual data points are also shown as some datasets contain less than 5 data points. (h) Fugl-Meyer assessment at different time points for SCS01 and SCS02 including 4-weeks post-study. (i) normalized spasticity level obtained by averaging Modified Ashworth Score at each joint for SCS01 (dark grey) and SCS02 (light grey). Statistics all quantifications are reported using box-plots. For each box, the central circle indicates the median while the bottom and top edges of the box indicate the 25th and 75th percentiles, respectively. The whiskers extend to the minima and maxima data points, not considering outliers. Any outliers are plotted individually with additional circles. For datasets containing 5 or more data points, inference on mean differences is performed by bootstrapping n=5 to 9 repetitions obtained for each measurement, with n=10,000 bootstrap samples; * indicates statistical significance and rejection of the null hypothesis of no difference with a 95% confidence interval.

Comment in

References

    1. Feigin V, Nguyen G & Roth G Global, Regional, and Country-Specific Lifetime Risks of Stroke, 1990 and 2016. N. Engl. J. Med 379, 2429–2437 (2018). - PMC - PubMed
    1. Lawrence ES et al. Estimates of the prevalence of acute stroke impairments and disability in a multiethnic population. Stroke 32, 1279–1284 (2001). - PubMed
    1. Virani SS et al. Heart Disease and Stroke Statistics—2021 Update: A Report From the American Heart Association. Circulation 143, (2021). - PubMed
    1. Pollock A et al. Interventions for improving upper limb function after stroke. Cochrane Database Syst. Rev (2014) doi:10.1002/14651858.CD010820.pub2. - DOI - PMC - PubMed
    1. Krakauer JW & Carmichael ST Broken movement: the neurobiology of motor recovery after stroke. (MIT Press, 2017).

Publication types