

Post-exercise hypotension in male spontaneously hypertensive rats: The issue of calculation method
- PMID: 36807709
- PMCID: PMC9937782
- DOI: 10.14814/phy2.15524
Post-exercise hypotension in male spontaneously hypertensive rats: The issue of calculation method
Abstract
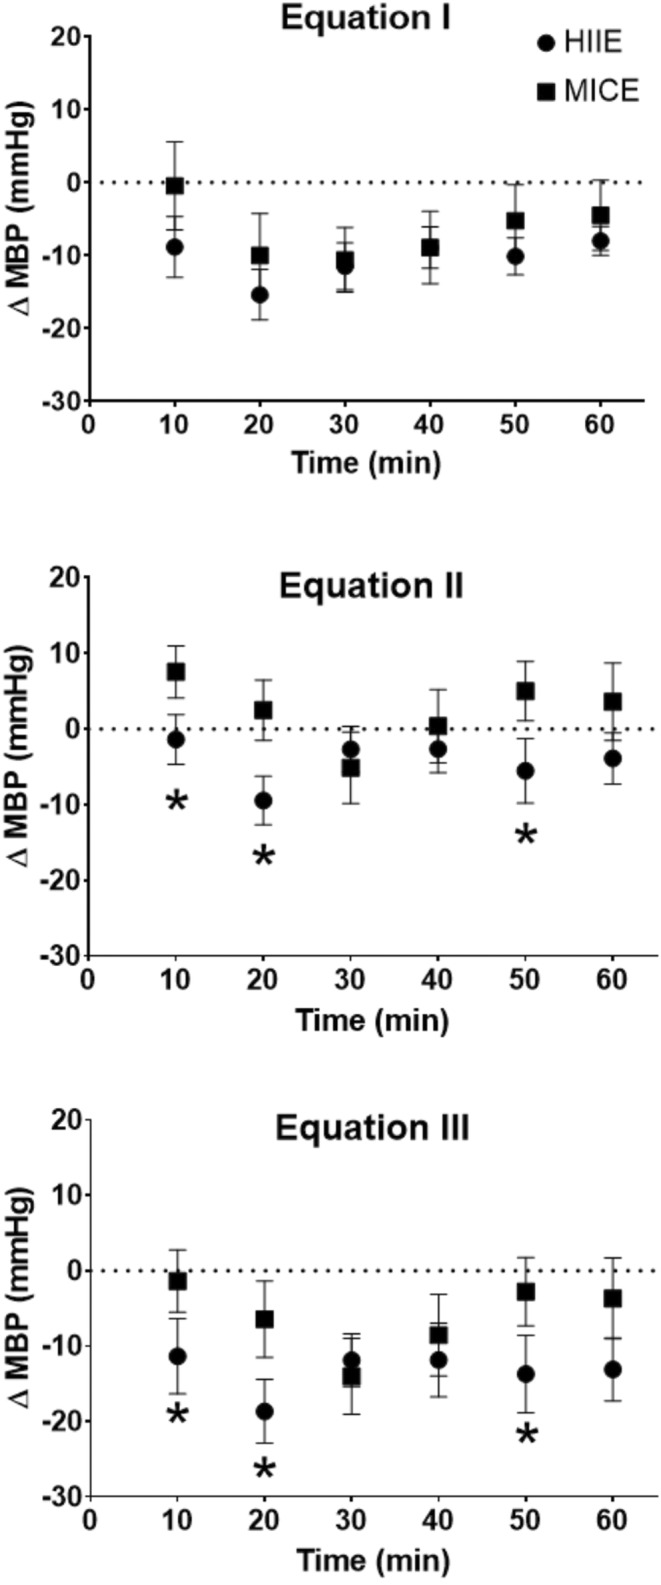
In spontaneously hypertensive rats, exercise can lead to a post-exercise decrease in blood pressure, named post-exercise hypotension (PEH). This can be following physical training but also after a single bout of mild to moderate exercise when measured with tail-cuff or externalized catheter methods. Our aim was to assess the PEH obtained with different calculation methods and to compare the magnitude of this effect induced by a moderate-intensity continuous exercise or a high-intensity intermittent exercise. Thirteen 16-week-old male spontaneously hypertensive rats performed two types of aerobic exercise (continuous or intermittent) on a treadmill. Arterial pressure was recorded by telemetry for 24 h which was started 3 h before physical exercise. Based on the literature, PEH was first evaluated with two different baseline values, and then with three different approaches. We observed that the identification of PEH depended on the method used to measure the rest value, and that its amplitude was also influenced by the calculation approach and the type of exercise performed. Hence, the calculation method and the amplitude of the detected PEH can significantly influence their physiological and pathophysiological inferences.
Keywords: blood pressure variability; hypertension; physical exercise; telemetry.
© 2023 The Authors. Physiological Reports published by Wiley Periodicals LLC on behalf of The Physiological Society and the American Physiological Society.
Figures


References
-
- Ambrosetti, M. , Abreu, A. , Corra, U. , Davos, C. H. , Hansen, D. , Frederix, I. , et al. (2020). Secondary prevention through comprehensive cardiovascular rehabilitation: From knowledge to implementation. 2020 update. A position paper from the secondary prevention and rehabilitation section of the European Association of Preventive Cardiology. European Journal of Preventive Cardiology, 2047487320913379. 10.1177/2047487320913379 - DOI - PubMed
-
- Atkinson, G. , Cable, N. T. , & George, K. (2005). The relationship between baseline blood pressure and magnitude of postexercise hypotension. Journal of Hypertension, 23(6), 1271–1272 author reply 1272‐3. - PubMed
-
- Bonsu, B. , & Terblanche, E. (2016). The training and detraining effect of high‐ intensity interval training on post‐exercise hypotension in young overweight/obese women. European Journal of Applied Physiology, 116(1), 77–84. - PubMed
-
- Calhoun, D. A. , Zhu, S. T. , Chen, Y. F. , & Oparil, S. (1995). Gender and dietary NaCl in spontaneously hypertensive and Wistar‐Kyoto rats. Hypertension, 26(2), 285–289. - PubMed
-
- Casonatto, J. , Goessler, K. F. , Cornelissen, V. A. , Cardoso, J. R. , & Polito, M. D. (2016). The blood pressure‐lowering effect of a single bout of resistance exercise: A systematic review and meta‐analysis of randomised controlled trials. European Journal of Preventive Cardiology, 23(16), 1700–1714. - PubMed
Publication types
MeSH terms
LinkOut - more resources
Full Text Sources
Medical
