. 2023 Feb 17;14(1):913.
doi: 10.1038/s41467-023-36535-8.

Widespread perturbation of ETS factor binding sites in cancer

Affiliations

Widespread perturbation of ETS factor binding sites in cancer

Sebastian Carrasco Pro et al. Nat Commun. .

Abstract

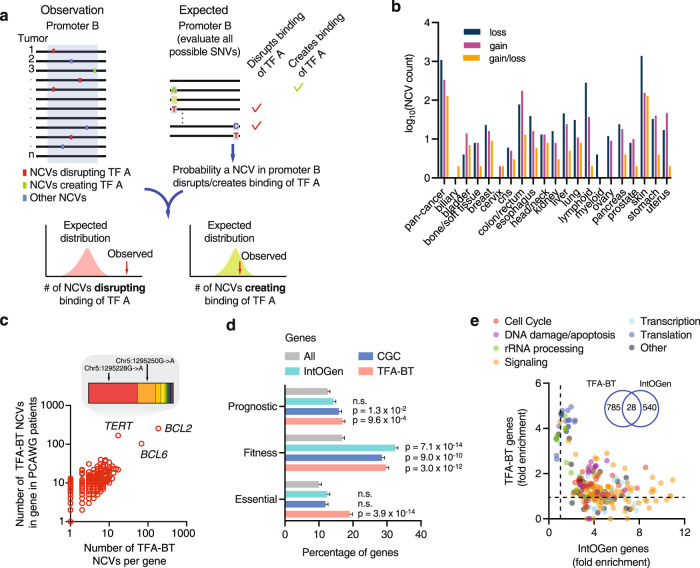
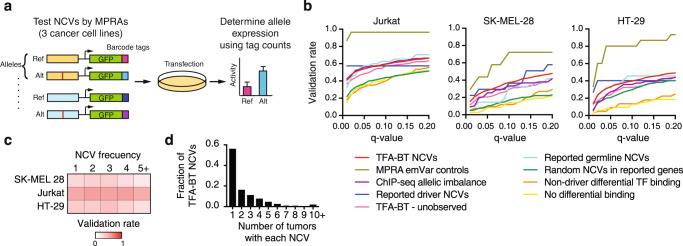
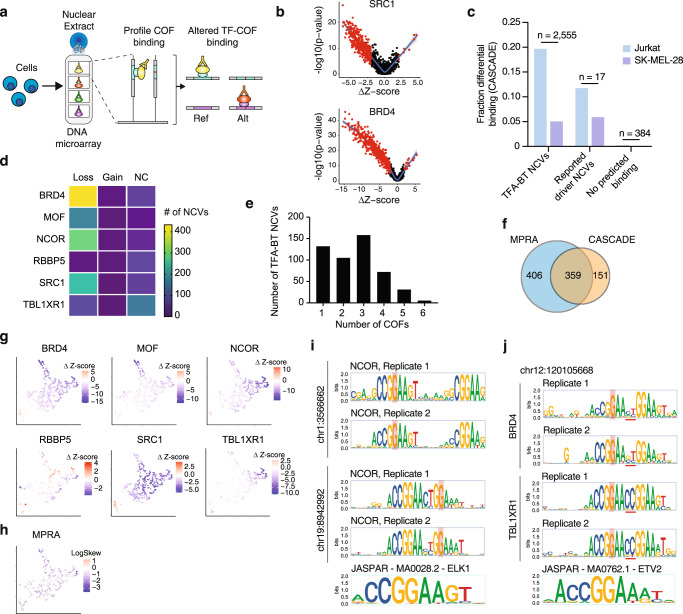
Although >90% of somatic mutations reside in non-coding regions, few have been reported as cancer drivers. To predict driver non-coding variants (NCVs), we present a transcription factor (TF)-aware burden test based on a model of coherent TF function in promoters. We apply this test to NCVs from the Pan-Cancer Analysis of Whole Genomes cohort and predict 2555 driver NCVs in the promoters of 813 genes across 20 cancer types. These genes are enriched in cancer-related gene ontologies, essential genes, and genes associated with cancer prognosis. We find that 765 candidate driver NCVs alter transcriptional activity, 510 lead to differential binding of TF-cofactor regulatory complexes, and that they primarily impact the binding of ETS factors. Finally, we show that different NCVs within a promoter often affect transcriptional activity through shared mechanisms. Our integrated computational and experimental approach shows that cancer NCVs are widespread and that ETS factors are commonly disrupted.


Conflict of interest statement

The authors declare no competing interests.

Figures

Fig. 1
Fig. 1. Identification of TFA-BT NCVs.
a Overview of the TFA-BT approach. The number of observed NCVs across tumor samples that disrupt (or create) a binding site of TF A in promoter B is compared to the expected probability distribution to identify significant promoter-TF associations. b Number of TFA-BT NCVs with predicted gain and/or loss of TF binding per cancer type. c Scatter plot showing the number of different TFA-BT NCVs per gene in the PCAWG cohort versus the number of TFA-BT NCV events in the corresponding promoter in patients from PCAWG. Insert shows fraction of patients in PCAWG for each mutation in the TERT promoter. d Percentage of prognostic (i.e., genes whose expression levels are favorably or unfavorably associated with cancer), fitness-related, and essential genes within all protein-coding (n = 19,208), IntOGen (n = 561), Cancer Gene Census (CGC, n = 729), and TFA-BT genes (n = 746). Statistical significance determined by two-sided Fisher’s exact test compared to all protein-coding genes. Error bars indicate standard error of the proportion. e Biological process gene ontology fold enrichment associated with different terms for IntOGen and TFA-BT gene sets. Each dot represents a gene ontology term classified into general classes. Insert shows overlap between TFA-BT and IntoGen genes. Source data are provided as a Source Data file.
Fig. 2
Fig. 2. TBA-BT NCVs alter transcriptional activity.
a Overview of the evaluation of NCVs by massively parallel reporter assays (MPRAs). b Fraction of NCVs from each test set within MPRA active regions that show expression allelic skew at different q-value thresholds in Jurkat, SK-MEL-28, and HT-29 cells. c Heatmap of validation rates in each cell line for NCVs present in 1, 2, 3, 4, and 5 or more patients. d Fraction of TFA-BT NCVs per recurrency (i.e., number of tumors with each NCV) across patients in PCAWG. Source data are provided as a Source Data file.
Fig. 3
Fig. 3. Profiling TF-COF complex binding altered by NCVs.
a Overview of the CASCADE method to profile TF-COF complex binding affected by NCVs (Ref - reference and Alt - alternative alleles). b Impact of TFA-BT NCVs on the recruitment of SRC1 and BRD4 to 2555 Ref/Alt NCV probes sets assayed using Jurkat T-cell nuclear extracts. Impact is quantified using -log10(p-value) of the COF recruitment to the different probe sets and the difference in PBM-determined Z-score between Ref and Alt alleles (Δz-score). P values are calculated using two-sided Student’s t-test comparing five replicates of Ref and Alt alleles. The NCVs identified as significant are highlighted in red. c Fraction of NCVs from different probe sets identified as significant by CASCADE in Jurkat and SK-MEL-28 cells. Numbers at the top of the bars indicate the number of probes tested in each set. d Number of TF-ABT NCVs leading to loss, gain, or no change (NC) (i.e., both alleles similarly recruit the COF) of recruitment for each COF tested. e Number of TFA-BT NCVs that affect the recruitment of 1 to 6 COFs. f Overlap between the number of TFA-BT NCVs significant by MPRAs and CASCADE. g UMAP clustering TFA-BT NCVs based on Δz-score for each of the six COFs tested. h UMAP depicting the MPRA expression allelic skew for each TFA-BT NCV. i NCOR recruitment motifs associated with two TFA-BT NCVs. j BRD4 and TBL1XR1 recruitment motifs associated with NCV at position chr12:120105668. Source data are provided as a Source Data file.
Fig. 4
Fig. 4. NCVs derived from highly prevalent mutational processes affect transcriptional activity and COF recruitment.
a MPRA and CASCADE validation rates for TFA-BT NCVs associated with different mutational signatures. Only mutational signatures associated with five or more NCVs in MPRA active regions in at least one cell line are shown. Gray cells indicate mutational signatures with less than 5 NCVs in MPRA active regions in the indicated cell line. The right heatmap depicts the fraction of TFA-BT NCVs in each mutation signature that are associated with altered COF recruitment. b MPRA validation rate for NCVs associated or not with ultraviolet (UV)-light mutational signature in SK-MEL-28 cells. UV-light + NCVs (n = 967), UV-light – NCVs (n = 161). Error bars indicate the standard error of a proportion. Significance determined by two-sided Fisher’s exact test. c Mutational frequency and effect on transcriptional activity and COF binding for skin cancer TFA-BT NCVs depending on the position within the ETS motif. The top violin plot shows the log10 expression allelic skew by MPRA for NCVs affecting different positions within ETS motifs. The bottom six violin plots show the Δz-score in COF binding between the reference and the alternative allele based on the position of the NCV within the ETS motif. The median is indicated by the bold horizontal line, and the first and third quartiles are indicated by the dotted horizontal lines. The bar plot indicates the number of TFA-BT NCVs affecting each position in the ETS motif. Source data are provided as a Source Data file.
Fig. 5
Fig. 5. Altered transcriptional activity and COF recruitment within promoters.
a, b Changes in MPRA activity and COF recruitment for TF-ABT NCV in the (a) EGR1 and (b) RNF20 promoters. The top heatmaps show the log10(p-value) of expression allelic skew in MPRA in Jurkat, SK-MEL-28, and HT-29 cells. P values were calculated using two-sided Student’s t-test. The bottom heatmaps show the altered COF recruitment by CASCADE, which is indicated as Δz-score. Gray cells indicate cases where the COF was not recruited to either NCV allele. Numbers at the top of the heatmaps indicate the number of patients in PCAWG carrying the indicated NCV. Mutation and TSS coordinates are indicated. c Pearson correlation coefficient (PCC) between Δz-score in CASCADE for each COF between pairs of TF-ABT NCVs within a gene promoter (n = 510) and between gene promoters (n = 258,810). Each box spans from the first to the third quartile, the horizontal lines inside the boxes indicate the median valuen, the whiskers indicate 1.5x the interquartile range, and the points indicate outliers. Significance determined by two-sided Mann–Whitney U test. d, e COF recruitment motifs determined by single nucleotide variant scanning using CASCADE for the NCVs indicated in a-b. Source data are provided as a Source Data file.

References

    1. Alexandrov LB, et al. The repertoire of mutational signatures in human cancer. Nature. 2020;578:94–101. doi: 10.1038/s41586-020-1943-3. - DOI - PMC - PubMed
    1. Ding L, et al. Perspective on oncogenic processes at the end of the beginning of cancer genomics. Cell. 2018;173:305–320.e10. doi: 10.1016/j.cell.2018.03.033. - DOI - PMC - PubMed
    1. Helleday T, Eshtad S, Nik-Zainal S. Mechanisms underlying mutational signatures in human cancers. Nat. Rev. Genet. 2014;15:585–598. doi: 10.1038/nrg3729. - DOI - PMC - PubMed
    1. Chang K, et al. The cancer genome atlas pan-cancer analysis project. Nat. Genet. 2013;45:1113–1120. doi: 10.1038/ng.2764. - DOI - PMC - PubMed
    1. International Cancer Genome Consortium. et al. International network of cancer genome projects. Nature. 2010;464:993–998. doi: 10.1038/nature08987. - DOI - PMC - PubMed

Publication types

Substances