

Risk factors and geographic disparities in premature cardiovascular mortality in US counties: a machine learning approach
- PMID: 36808141
- PMCID: PMC9941082
- DOI: 10.1038/s41598-023-30188-9
Risk factors and geographic disparities in premature cardiovascular mortality in US counties: a machine learning approach
Erratum in
-
Author Correction: Risk factors and geographic disparities in premature cardiovascular mortality in US counties: a machine learning approach.Sci Rep. 2023 Mar 27;13(1):4946. doi: 10.1038/s41598-023-32047-z. Sci Rep. 2023. PMID: 36973373 Free PMC article. No abstract available.
Abstract
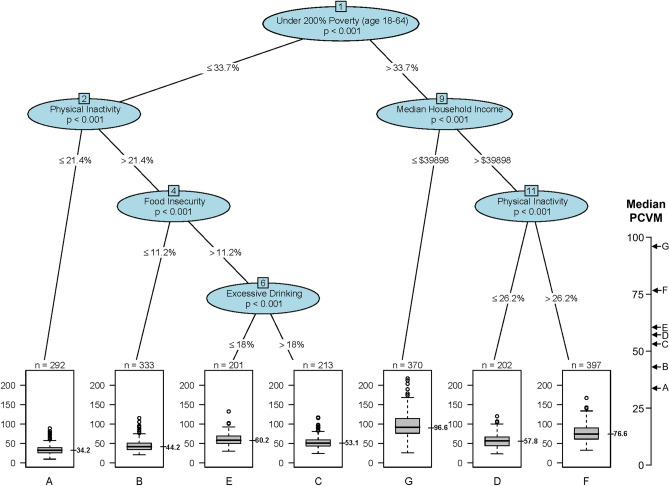
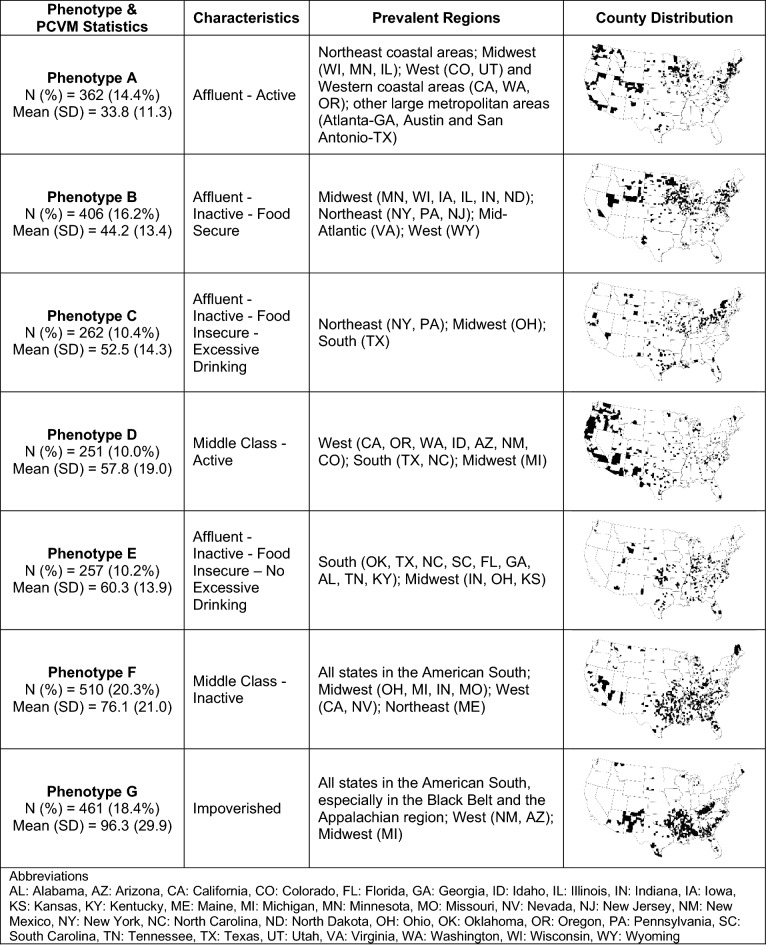
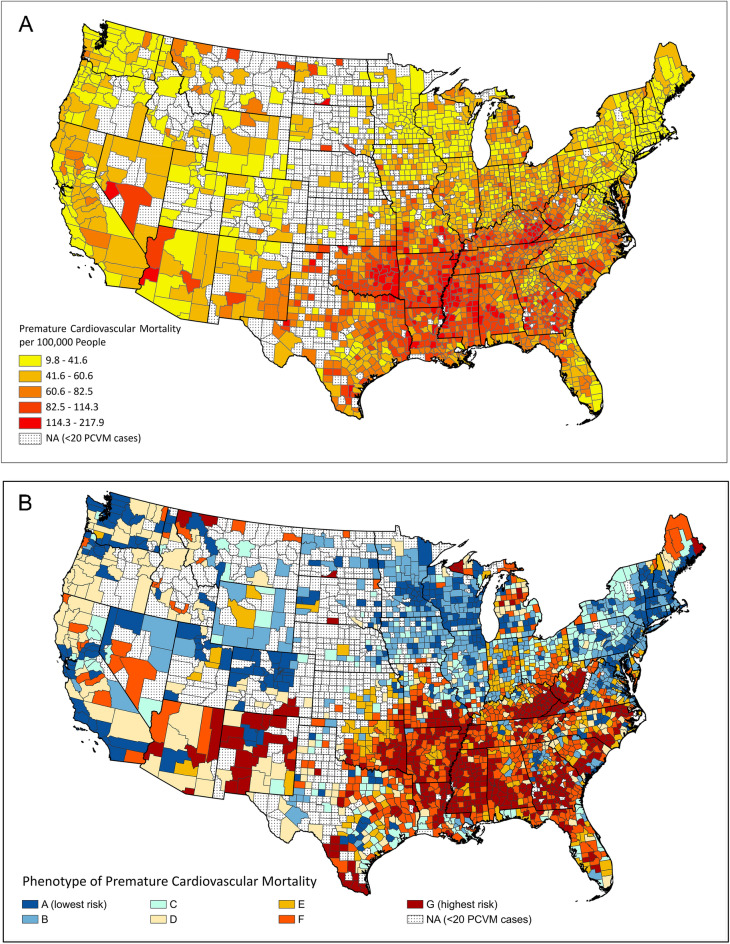
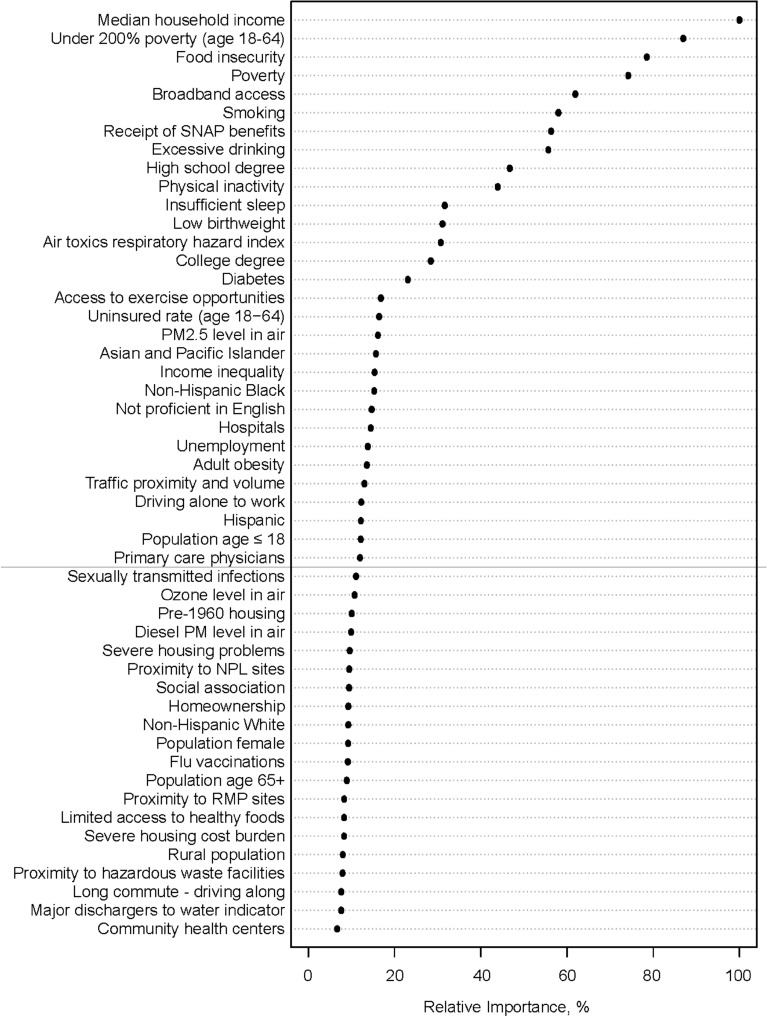
Disparities in premature cardiovascular mortality (PCVM) have been associated with socioeconomic, behavioral, and environmental risk factors. Understanding the "phenotypes", or combinations of characteristics associated with the highest risk of PCVM, and the geographic distributions of these phenotypes is critical to targeting PCVM interventions. This study applied the classification and regression tree (CART) to identify county phenotypes of PCVM and geographic information systems to examine the distributions of identified phenotypes. Random forest analysis was applied to evaluate the relative importance of risk factors associated with PCVM. The CART analysis identified seven county phenotypes of PCVM, where high-risk phenotypes were characterized by having greater percentages of people with lower income, higher physical inactivity, and higher food insecurity. These high-risk phenotypes were mostly concentrated in the Black Belt of the American South and the Appalachian region. The random forest analysis identified additional important risk factors associated with PCVM, including broadband access, smoking, receipt of Supplemental Nutrition Assistance Program benefits, and educational attainment. Our study demonstrates the use of machine learning approaches in characterizing community-level phenotypes of PCVM. Interventions to reduce PCVM should be tailored according to these phenotypes in corresponding geographic areas.
© 2023. The Author(s).
Conflict of interest statement
Dr. Dong is supported by contracts from Cleveland Clinic Foundation, including a subcontract from Celgene Corporation. Dr. Dong does not have other competing interests to report. Dr. Motairek, Dr. Nasir, Mr. Chen, Dr. Kim, Dr. Khalifa, Dr. Freedman, Dr. Griggs, Dr. Rajagopalan, and Dr. Al-Kindi do not have any competing interest.
Figures
References
Publication types
MeSH terms
Grants and funding
LinkOut - more resources
Full Text Sources
