. 2023 Feb 20;14(1):805.
doi: 10.1038/s41467-023-36177-w.

Pelagic calcium carbonate production and shallow dissolution in the North Pacific Ocean

Affiliations

Pelagic calcium carbonate production and shallow dissolution in the North Pacific Ocean

Patrizia Ziveri et al. Nat Commun. .

Abstract

Planktonic calcifying organisms play a key role in regulating ocean carbonate chemistry and atmospheric CO2. Surprisingly, references to the absolute and relative contribution of these organisms to calcium carbonate production are lacking. Here we report quantification of pelagic calcium carbonate production in the North Pacific, providing new insights on the contribution of the three main planktonic calcifying groups. Our results show that coccolithophores dominate the living calcium carbonate (CaCO3) standing stock, with coccolithophore calcite comprising ~90% of total CaCO3 production, and pteropods and foraminifera playing a secondary role. We show that pelagic CaCO3 production is higher than the sinking flux of CaCO3 at 150 and 200 m at ocean stations ALOHA and PAPA, implying that a large portion of pelagic calcium carbonate is remineralised within the photic zone; this extensive shallow dissolution explains the apparent discrepancy between previous estimates of CaCO3 production derived from satellite observations/biogeochemical modeling versus estimates from shallow sediment traps. We suggest future changes in the CaCO3 cycle and its impact on atmospheric CO2 will largely depend on how the poorly-understood processes that determine whether CaCO3 is remineralised in the photic zone or exported to depth respond to anthropogenic warming and acidification.


Conflict of interest statement

The authors declare no competing interests.

Figures

Fig. 1
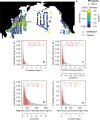
Fig. 1. Satellite PIC and location map.
August satellite-derived Particular Inorganic Carbon (PIC; mg CaCO3 m-3) climatology (2002-2017) and location of C-DisK-IV stations (black crosses) and long-term sediment trap studies (orange/pink crosses). Large black crosses show the location of Niskin bottle rosette, plankton tow, and floating sediment trap sampling sites at C-DisK-IV stations. Small black crosses show sites with additional plankton tow sampling only at C-DisK-IV stations. Note the logarithmic scale.
Fig. 2
Fig. 2. Coccolithophore standing stock vertical profiles.
a chlorophyll fluorescence. Coccosphere, and coccolith CaCO3 from C-DisK-IV stations (b) 1 and 2 and, (c) 3, 4, and 5. Note the different x axis range on panels (b) and (c). d Omega calcite and aragonite at the five stations.
Fig. 3
Fig. 3. Standing stock and production by pelagic calcifiers.
a living CaCO3 standing stock b turnover time of calcifying taxa used to calculate production from standing stock (the range represented by the bar length is applied with a flat probability distribution in our error propagation) c CaCO3 production per day (August 2017) d CaCO3 annual production corrected for seasonal bias using satellite-derived PIC/chlorophyll, and zooplankton seasonality estimates (all data and metadata are publicly available at hahana.soest.hawaii.edu/hot/hot-dogs/interface.html). The total CaCO3 production is shown by the violin plots in panels (c) and (d), where the probability density of the estimate is represented by the thickness of the shaded area and the grey lines show the 68% and 95% confidence interval (CI); note the non-normal distribution with the high-tail on the upper estimate. Error bars for the standing stock (a) and production (c, d) by individual taxon represent the 95% CI (Methods). STG, TZ, and SPG represent subtropical gyre, transition zone, and subpolar gyre, respectively. Purple bands on panels a, c, and d show 68% range of pteropod standing stock and daily/annual production calculated using the MAREDAT database (Methods). The blue stars on panel d show the estimates of total production calculated with in-situ pH and fCO2 measurements at Ocean Station PAPA (ref. , light blue), and estimates of production in the subpolar North Pacific calculated using the seasonal cycle of alkalinity and dissolved inorganic carbon (ref. , dark blue). STG, TZ, and SPG represent subtropical gyre, transition zone, and subpolar gyre, respectively.
Fig. 4
Fig. 4. Pteropod CaCO3 biomass estimates.
a Pteropod CaCO3 biomass estimated from the MAREDAT database and measured in this study; note, maximum values extend above 2 mg m-3. Probability density of pteropod (b) Carbon biomass (c) CaCO3 biomass (d) Integrated CaCO3 standing stock (e) daily CaCO3 production calculated using samples in the upper 250 m of the North Pacific from the comprehensive MAREDAT database, (Methods). Red shading indicates 32–68% confidence interval range. Red values show the 32nd, 50th, 68th percentiles; orange value shows the value with the highest probability (all values given in mg). Note the distributions are highly skewed.
Fig. 5
Fig. 5. Pelagic CaCO3 production versus sinking fluxes.
a total CaCO3 production versus sinking flux in the floating traps deployed at 100 m and 200 m during the plankton sampling at all stations (PIC concentrations not available at 200 m depth for stations 1 and 3) b Station 1/ALOHA  c Station 5/PAPA; turquoise star represents production estimate at PAPA from ref. based on the seasonally cycle of in-situ pH and fCO2 d fraction aragonite in production and sinking flux in the floating traps deployed during the plankton sampling as a function of latitude; red dashed line shows the depth of aragonite saturation horizon (calculated from GLODAPv2 and orange dotted line shows depth of deepest floating trap. Production in all panels is produced during the time of sampling (August 2017) i.e. it is not corrected for seasonal bias. Error bars for the total production (a, b, c) and fraction aragonite of production (d) represent the 95% CI (Methods) See legend in panel a for square symbols in panels (c, d, e). STG, TZ, and SPG represent subtropical gyre, transition zone, and subpolar gyre, respectively.

References

    1. Broecker, W. S. & Peng, T.-H. Tracers in the Sea. 690 (Lamont-Doherty Geological Observatory, Columbia University, 1982).
    1. Morse, J. W. & Mackenzie, F. T. Geochemistry of sedimentary carbonates. (Elsevier, 1990).
    1. Ridgwell A, Zeebe RE. The role of the global carbonate cycle in the regulation and evolution of the Earth system. Earth Planet. Sci. Lett. 2005;234:299–315. doi: 10.1016/j.epsl.2005.03.006. - DOI
    1. Ziveri P, de Bernardi B, Baumann K-H, Stoll HM, Mortyn PG. Sinking of coccolith carbonate and potential contribution to organic carbon ballasting in the deep ocean. Deep Sea Res. Part II: Topical Stud. Oceanogr. 2007;54:659–675. doi: 10.1016/j.dsr2.2007.01.006. - DOI
    1. Salter I, et al. Carbonate counter pump stimulated by natural iron fertilization in the Polar Frontal Zone. Nat. Geosci. 2014;7:885–889. doi: 10.1038/ngeo2285. - DOI