

Integrating metabolomics and lipidomics revealed a decrease in plasma fatty acids but an increase in triglycerides in children with drug-refractory epilepsy
- PMID: 36808532
- PMCID: PMC10235554
- DOI: 10.1002/epi4.12712
Integrating metabolomics and lipidomics revealed a decrease in plasma fatty acids but an increase in triglycerides in children with drug-refractory epilepsy
Abstract
Objective: The drug-refractory epilepsy (DRE) in children is commonly observed but the underlying mechanisms remain elusive. We examined whether fatty acids (FAs) and lipids are potentially associated with the pharmacoresistance to valproic acid (VPA) therapy.
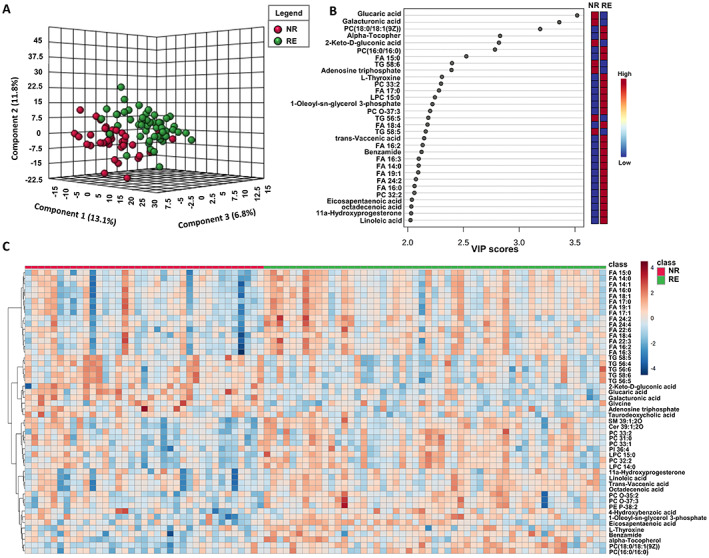
Methods: This single-center, retrospective cohort study was conducted using data from pediatric patients collected between May 2019 and December 2019 at the Children's Hospital of Nanjing Medical University. Ninety plasma samples from 53 responders with VPA monotherapy (RE group) and 37 non-responders with VPA polytherapy (NR group) were collected. Non-targeted metabolomics and lipidomics analysis for those plasma samples were performed to compare the potential differences of small metabolites and lipids between the two groups. Plasma metabolites and lipids passing the threshold of variable importance in projection value >1, fold change >1.2 or <0.8, and p-value <0.05 were regarded as statistically different substances.
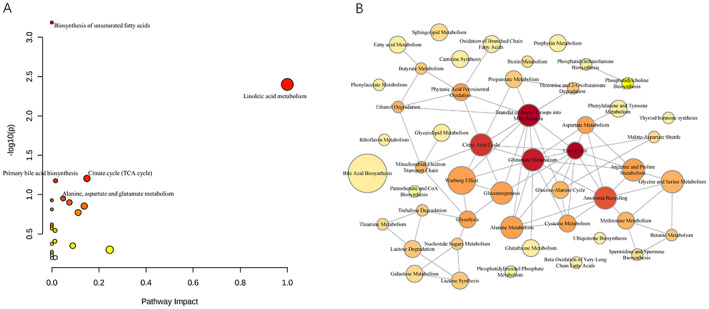
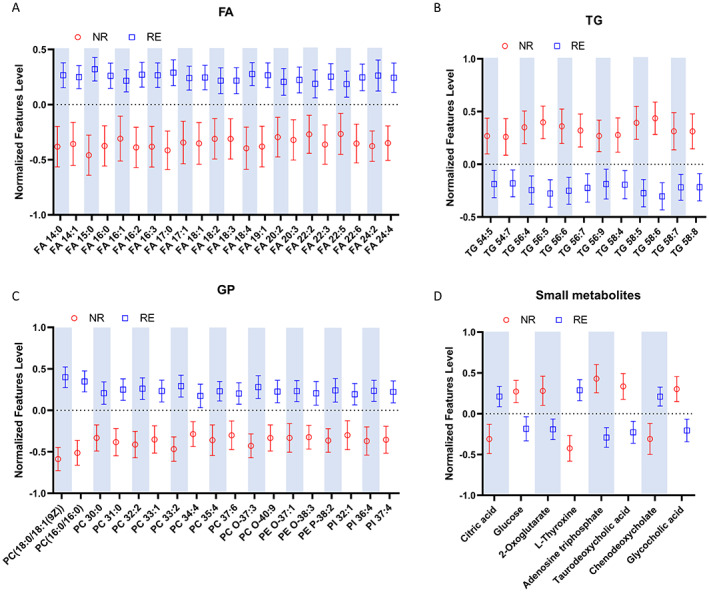
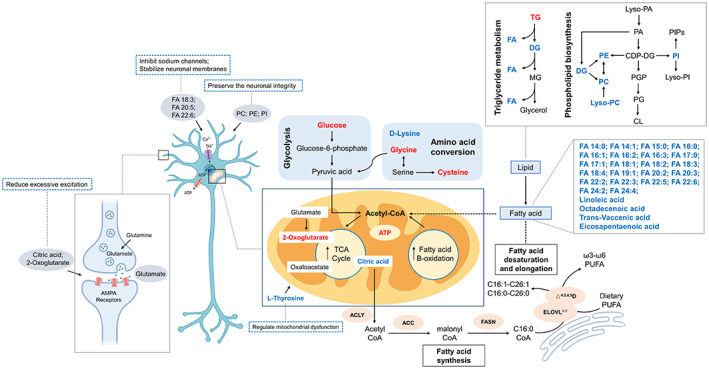
Results: A total of 204 small metabolites and 433 lipids comprising 16 different lipid subclasses were identified. The well-established partial least squares-discriminant analysis (PLS-DA) revealed a good separation of the RE from the NR group. The FAs and glycerophospholipids status were significantly decreased in the NR group, but their triglycerides (TG) levels were significantly increased. The trend of TG levels in routine laboratory tests was in line with the lipidomics analysis. Meanwhile, cases from the NR group were characterized by a decreased level of citric acid and L-thyroxine, but with an increased level of glucose and 2-oxoglutarate. The top two enriched metabolic pathways involved in the DRE condition were biosynthesis of unsaturated FAs and linoleic acid metabolism.
Significance: The results of this study suggested an association between metabolism of FAs and the medically intractable epilepsy. Such novel findings might propose a potential mechanism linked to the energy metabolism. Ketogenic acid and FAs supplementation might therefore be high-priority strategies for DRE management.
Keywords: children; drug-refractory epilepsy; fatty acids; lipidomics; metabolomics.
© 2023 The Authors. Epilepsia Open published by Wiley Periodicals LLC on behalf of International League Against Epilepsy.
Conflict of interest statement
None of the authors have any conflicts of interest to disclose. We confirm that we have read the Journal's position on issues involved in ethical publications and affirm that this report is in consistent with those guidelines.
Figures
Similar articles
-
Untargeted metabolomics and lipidomics to assess plasma metabolite changes in dairy goats with subclinical hyperketonemia.J Dairy Sci. 2023 May;106(5):3692-3705. doi: 10.3168/jds.2022-22812. Epub 2023 Apr 5. J Dairy Sci. 2023. PMID: 37028962
-
Serum asymmetric dimethylarginine (ADMA), homocysteine, vitamin B(12), folate levels, and lipid profiles in epileptic children treated with valproic acid.Eur J Pediatr. 2011 Jul;170(7):873-7. doi: 10.1007/s00431-010-1366-5. Epub 2010 Dec 8. Eur J Pediatr. 2011. PMID: 21140275
-
Plasma metabolomics, lipidomics and cytokinomics profiling predict disease recurrence in metastatic colorectal cancer patients undergoing liver resection.Front Oncol. 2023 Jan 11;12:1110104. doi: 10.3389/fonc.2022.1110104. eCollection 2022. Front Oncol. 2023. PMID: 36713567 Free PMC article.
-
Integrated metabolomics and lipidomics study of patients with atopic dermatitis in response to dupilumab.Front Immunol. 2022 Oct 20;13:1002536. doi: 10.3389/fimmu.2022.1002536. eCollection 2022. Front Immunol. 2022. PMID: 36341398 Free PMC article.
-
Metabolomics and lipidomics in NAFLD: biomarkers and non-invasive diagnostic tests.Nat Rev Gastroenterol Hepatol. 2021 Dec;18(12):835-856. doi: 10.1038/s41575-021-00502-9. Epub 2021 Sep 10. Nat Rev Gastroenterol Hepatol. 2021. PMID: 34508238 Review.
Cited by
-
Role of inflammatory cytokine in mediating the effect of plasma lipidome on epilepsy: a mediation Mendelian randomization study.Front Neurol. 2024 May 30;15:1388920. doi: 10.3389/fneur.2024.1388920. eCollection 2024. Front Neurol. 2024. PMID: 38872823 Free PMC article.
-
Untargeted metabolomics reveal the corrective effects of scorpion on epileptic mice.Sci Rep. 2025 Jan 6;15(1):937. doi: 10.1038/s41598-024-84028-5. Sci Rep. 2025. PMID: 39762379 Free PMC article.
-
Valproic Acid Treatment after Traumatic Brain Injury in Mice Alleviates Neuronal Death and Inflammation in Association with Increased Plasma Lysophosphatidylcholines.Cells. 2024 Apr 23;13(9):734. doi: 10.3390/cells13090734. Cells. 2024. PMID: 38727269 Free PMC article.
-
Metabolomics analysis of children with spastic cerebral palsy: a case-control study.BMC Pediatr. 2025 Jul 2;25(1):494. doi: 10.1186/s12887-025-05828-w. BMC Pediatr. 2025. PMID: 40596988 Free PMC article.
-
Phospholipidomics in Clinical Trials for Brain Disorders: Advancing our Understanding and Therapeutic Potentials.Mol Neurobiol. 2024 Jun;61(6):3272-3295. doi: 10.1007/s12035-023-03793-y. Epub 2023 Nov 20. Mol Neurobiol. 2024. PMID: 37981628 Free PMC article. Review.
References
-
- Augustin K, Khabbush A, Williams S, Eaton S, Orford M, Cross JH, et al. Mechanisms of action for the medium‐chain triglyceride ketogenic diet in neurological and metabolic disorders. Lancet Neurol. 2018;17(1):84–93. - PubMed
Publication types
MeSH terms
Substances
LinkOut - more resources
Full Text Sources
Research Materials
Miscellaneous
