. 2023 Apr 20;35(5):1360-1385.
doi: 10.1093/plcell/koad036.

The transcriptional landscape of plant infection by the rice blast fungus Magnaporthe oryzae reveals distinct families of temporally co-regulated and structurally conserved effectors

Affiliations

The transcriptional landscape of plant infection by the rice blast fungus Magnaporthe oryzae reveals distinct families of temporally co-regulated and structurally conserved effectors

Xia Yan et al. Plant Cell. .

Abstract

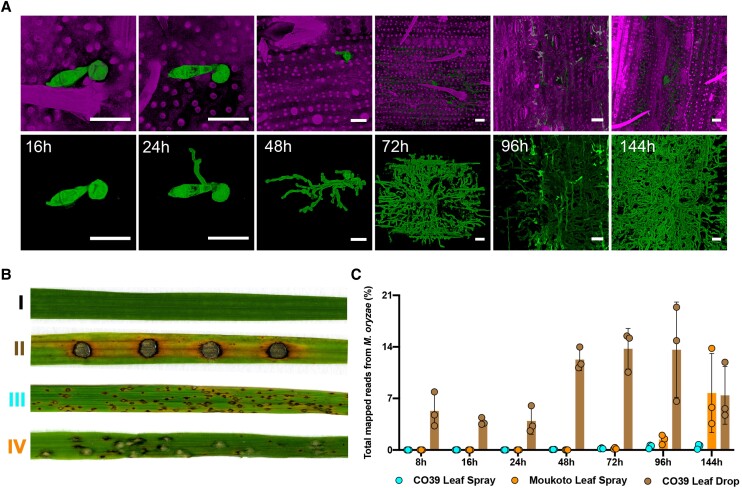
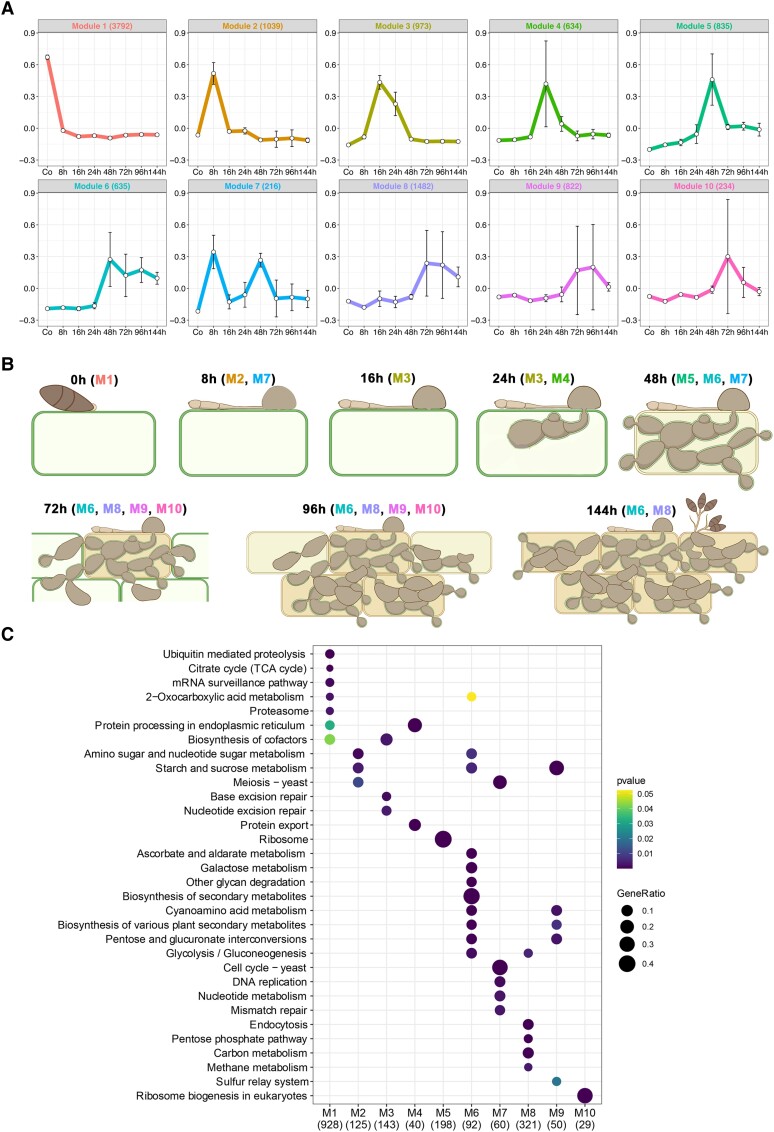
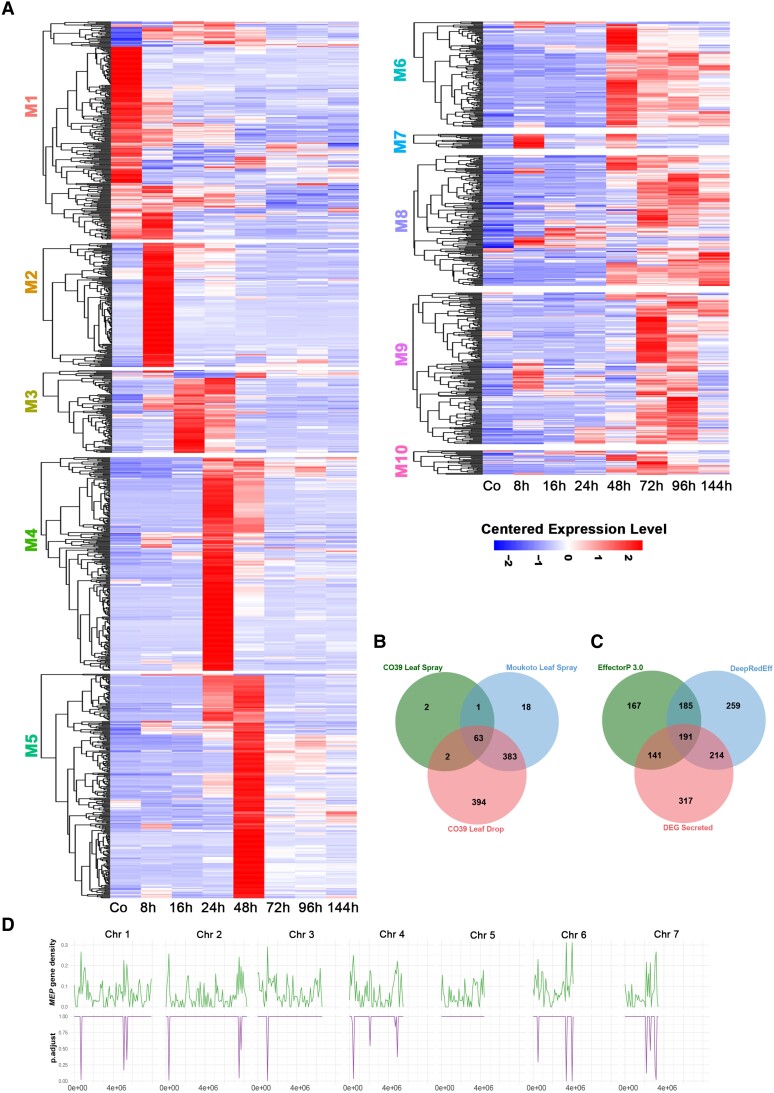
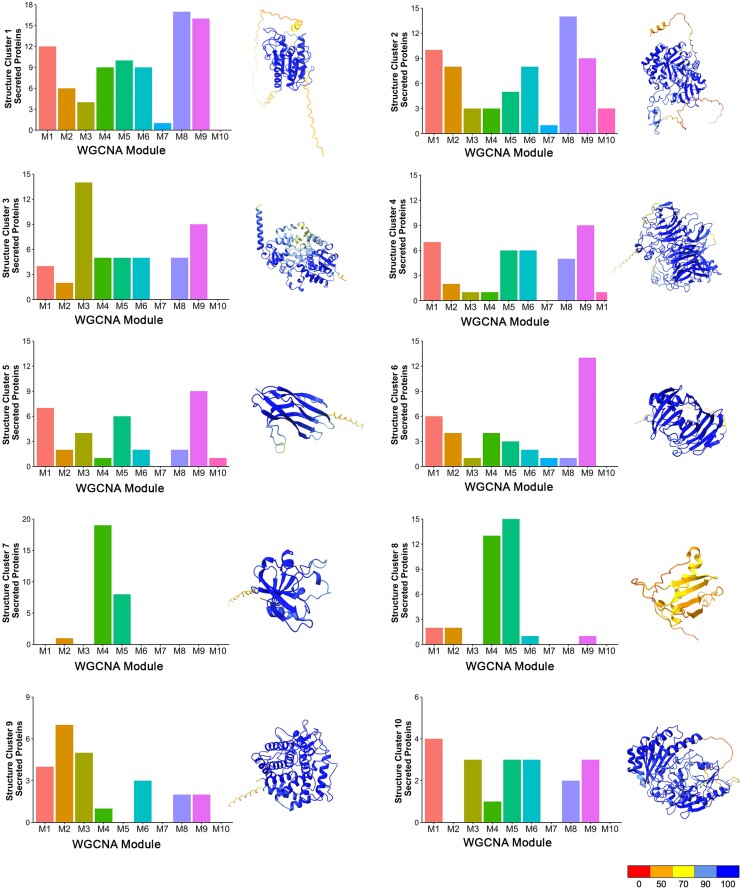
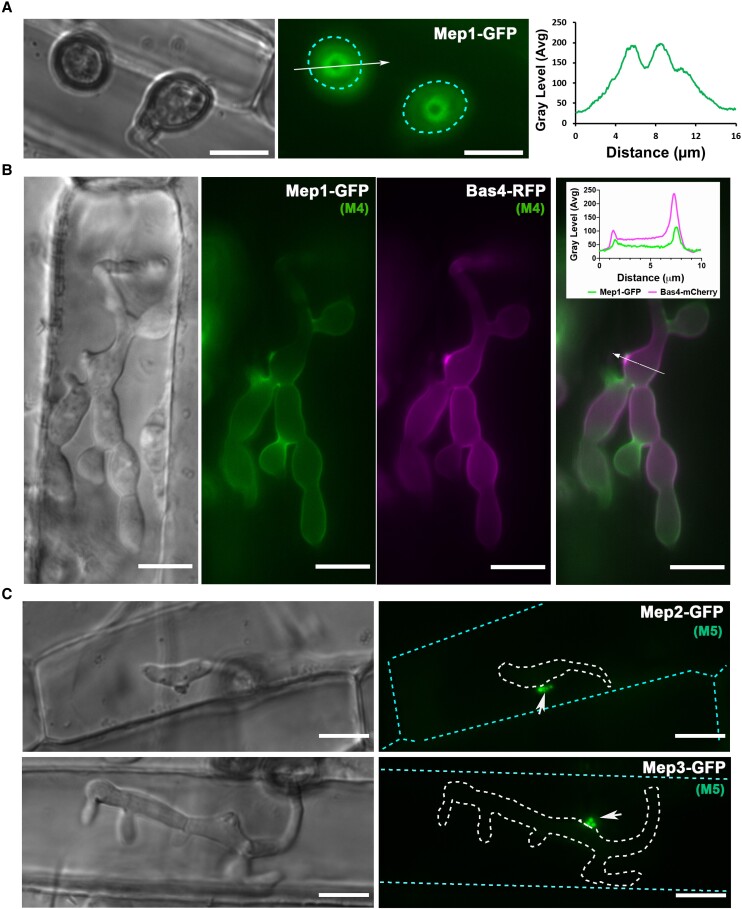
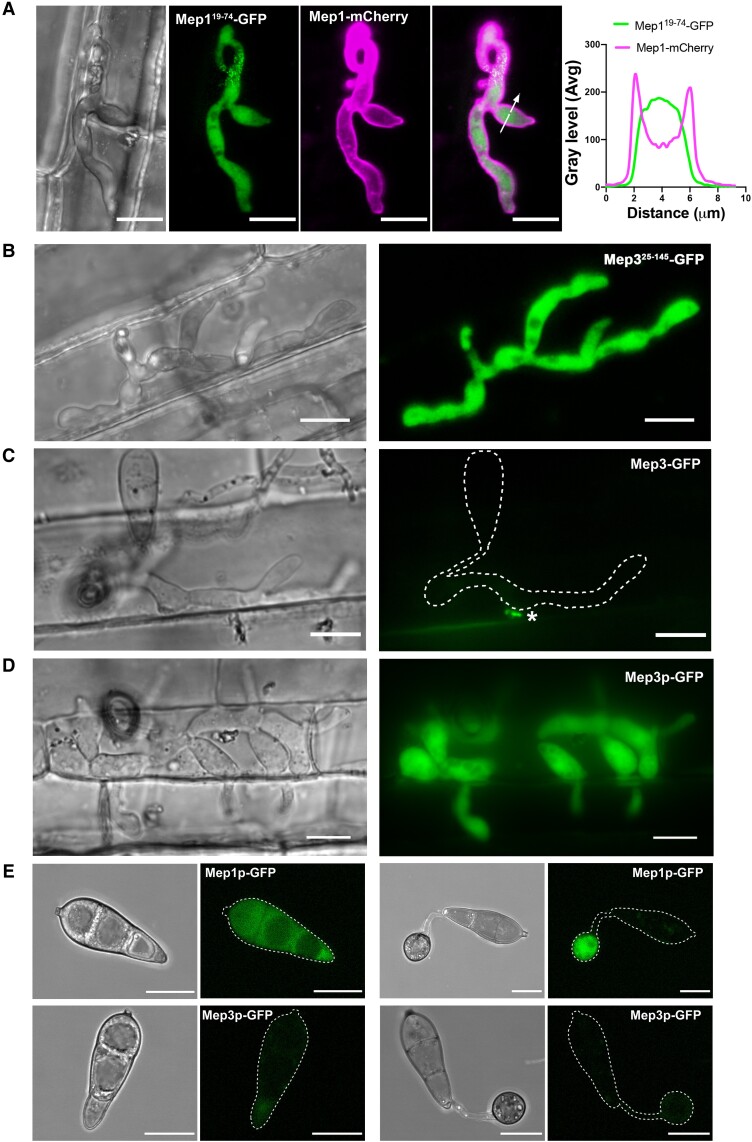
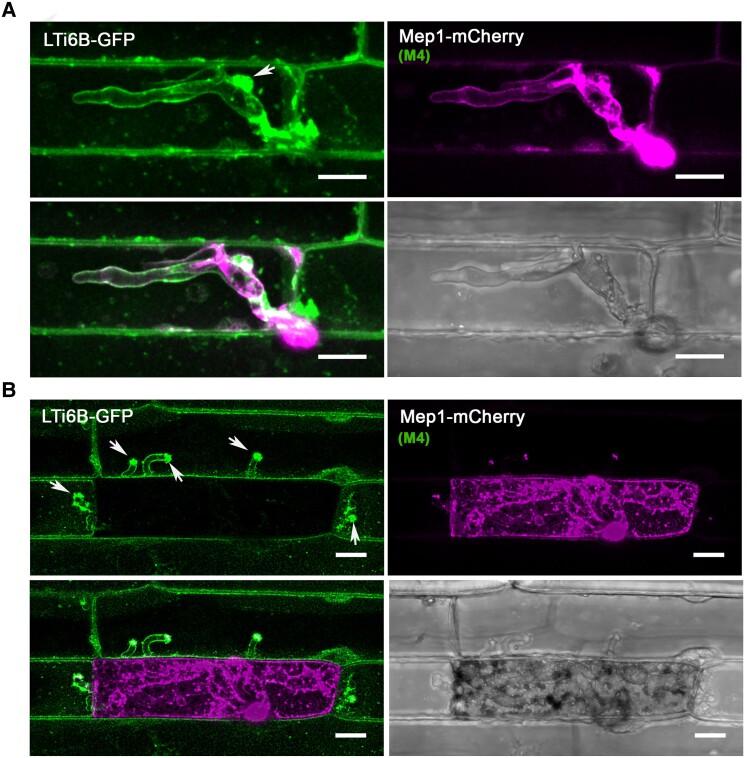
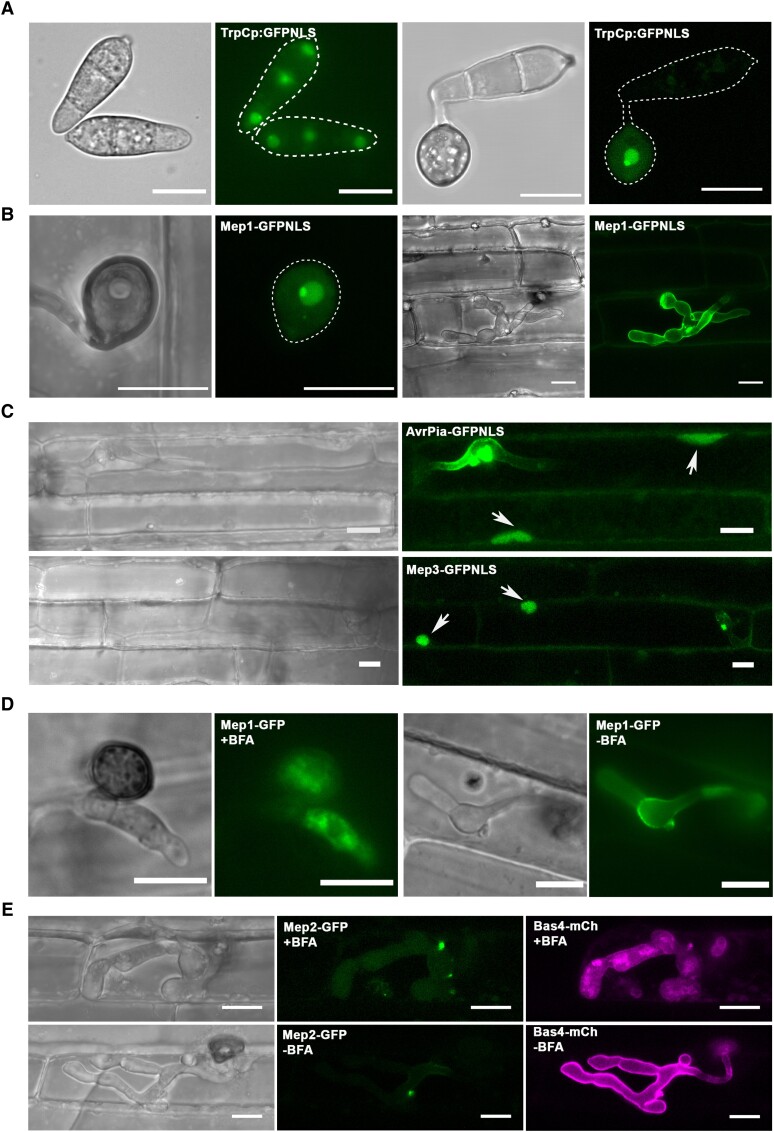
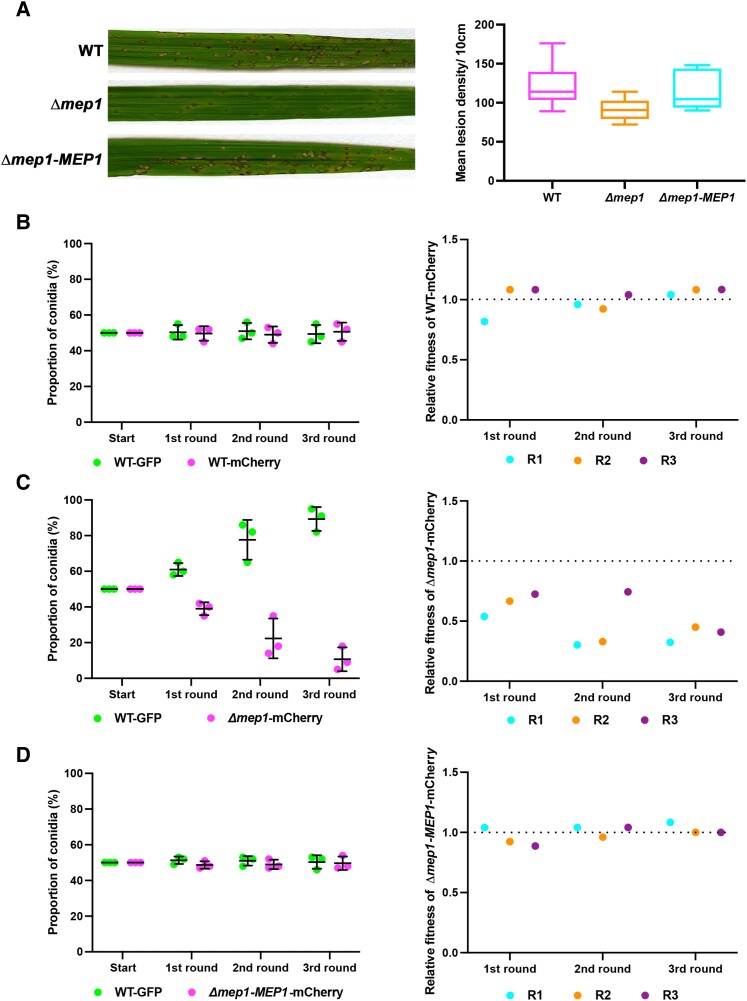
The rice blast fungus Magnaporthe oryzae causes a devastating disease that threatens global rice (Oryza sativa) production. Despite intense study, the biology of plant tissue invasion during blast disease remains poorly understood. Here we report a high-resolution transcriptional profiling study of the entire plant-associated development of the blast fungus. Our analysis revealed major temporal changes in fungal gene expression during plant infection. Pathogen gene expression could be classified into 10 modules of temporally co-expressed genes, providing evidence for the induction of pronounced shifts in primary and secondary metabolism, cell signaling, and transcriptional regulation. A set of 863 genes encoding secreted proteins are differentially expressed at specific stages of infection, and 546 genes named MEP (Magnaportheeffector protein) genes were predicted to encode effectors. Computational prediction of structurally related MEPs, including the MAX effector family, revealed their temporal co-regulation in the same co-expression modules. We characterized 32 MEP genes and demonstrate that Mep effectors are predominantly targeted to the cytoplasm of rice cells via the biotrophic interfacial complex and use a common unconventional secretory pathway. Taken together, our study reveals major changes in gene expression associated with blast disease and identifies a diverse repertoire of effectors critical for successful infection.


Conflict of interest statement

Conflict of interest statement. The authors declare no competing interests.

Figures

Figure 1.
Figure 1.
Transcriptional profile analysis of a time-course of plant infection by the rice blast fungus M. oryzae. Rice infections were carried out using 2 distinct inoculation methods and 2 cultivars differing in relative susceptibility to blast. A) Micrographs of rice cultivar CO39 leaves inoculated with M. oryzae Guy11 to show the progression of tissue invasion. Infected rice leaves were collected at 16-, 24-, 48-, 72-, 96-, and 144-h postinoculation. Wheat Germ Agglutinin-Alexa Fluor 488 conjugate (WGA-AF488) was used to stain fungal hyphae and PI was used to stain the plant cell wall. Scale bars = 20 µm. B) Comparison of rice blast disease symptoms 6-d postinoculation using either leaf drop infection or spray infection on rice cultivars with varying host susceptibility. I: moderately susceptible rice cultivar CO39 inoculated with water control; II: leaf drop infection of rice CO39 with Guy11; III: spray infection of rice CO39 with Guy11; IV: spray infection of highly susceptible rice cultivar Moukoto with Guy11. C) Graph depicting the proportion of fungal transcripts in the plant and pathogen mixed transcriptome (CO39 Leaf Spray, Moukoto Leaf Spray, and CO39 Leaf Drop correspond to inoculation methods). Error bars represent SD of 3 biological replicates for all time points except conidia with 2 biological replicates.
Figure 2.
Figure 2.
Temporal co-expression analysis reveals 10 modules of pathogen gene expression during rice blast infection. Analysis of co-expressed pathogen genes during rice blast disease development. A) Weighted correlation network analysis (WGCNA) identifies 10 co-expressed modules during a time-course of infection-related development and plant infection (Modules 1–10). The representative eigengene is shown for each module. Co, 0-h conidia control. Error bars represent SD of 3 biological replicates for all time points except conidia with 2 biological replicates. B) Schematic representation of each stage of rice blast disease development when genes in color-coded corresponding WGCNA modules are co-expressed. C) KEGG enrichment analysis of genes in each WGCNA module using clusterProfiler reveals over-represented physiological functions during blast disease development.
Figure 3.
Figure 3.
Stage-specific temporal expression of the M. oryzae secretome during rice infection. A) Heat map showing the hierarchical clustering of pathogen genes encoding putatively secreted proteins from each WGCNA co-expression module. Distinct temporal patterns of secretome expression occur during biotrophic and necrotrophic development. Expression levels are shown relative to the mean expression TPM value across all stages. B) Venn diagram showing a comparison of differentially expressed secreted protein-encoding genes from 3 different inoculation experiments (CO39 Leaf Spray, Moukoto Leaf Spray, and CO39 Leaf Drop Infections). In total, 68 effector candidates were identified from the CO39 leaf spray infections, 467 effector candidates from Moukoto leaf spray inoculation, and 847 effector candidates from CO39 leaf drop infections. Although leaf drop-CO39 infections revealed expression of many more differentially expressed effector candidates, 20 effector candidates were revealed only in spray inoculation experiments. C) Comparison of effector predictions of host-induced secreted proteins using EffectorP 3.0 and DeepRedEff algorithms with differentially expressed genes encoding signal peptide-containing proteins (DEG Secreted). D) Enrichment analysis of MEP gene loci on M. oryzae chromosomes 1–7, encoding predicted secreted proteins. The number of MEP genes was compared with the total gene number in 200 kb windows across each chromosome. Phyper was used to compute the hypergeometric distribution and obtain P-values (Johnson et al. 1992). The resulting graphs in the bottom panel show regions of each chromosome where there is a significant over-representation of MEP gene loci.
Figure 4.
Figure 4.
Structurally conserved M. oryzae effectors are temporally co-expressed during biotrophic invasive growth. AlphaFold and ChimeraX platforms were used to predict the 3D structures of predicted secreted proteins of M. oryzae. Structure clusters were then analyzed against each WGCNA module. Bar charts represent the number of predicted secreted proteins identified in each predicted structure cluster (Clusters 1–10), which are classified within each WGCNA co-expression module during pathogenesis. Ribbon diagrams show a representative predicted protein structure for each M. oryzae structure cluster. These include MGG_09840, which contains a cutinase domain for Structure Cluster 1; MGG_04534 contains a chitin recognition protein domain for Structure Cluster 2; MGG_07497 contains a cytochrome P450 domain for Structure Cluster 3; MGG_05785 (Inv1/Bas113) contains a glycosyl hydrolase family 32 domain for Structure Cluster 4; MGG_02347 (Nis1) for Structure Cluster 5; MGG_08537 contains a glycosyl hydrolase family 12 domain for Structure Cluster 6; MGG_00230 (Mep2) is a predicted ART containing a heat-labile enterotoxin alpha chain domain for Structure Cluster 7; MGG_12426 is a predicted MAX effector and homologue of AvrPib for Structure Cluster 8; MGG_04305 contains a glycosyl hydrolase family 88 domain for Structure Cluster 9; MGG_00276 contains berberine and berberine-like domains for Structure Cluster 10. Protein structures were predicted by AlphaFold, and ChimeraX was used to visualize the protein structure using PDB files generated by AlphaFold. The command “color bfactor palette alphafold” was used to color-code the confidence for each prediction (scale from red = 0% confident to blue = 100% confident). Genes encoding proteins in Structure Clusters 7 and 8 are over-represented in WGCNA M4 and M5.
Figure 5.
Figure 5.
Live-cell imaging of Mep candidates during plant infection reveals spatial localization of effectors during appressorium penetration and invasive growth. A) Micrographs showing the M4 effector Mep1-GFP localizing in a ring conformation at the appressorium pore at the leaf surface in M. oryzae Guy11. Conidial suspensions at 5 ×10⁴ mL−1 were inoculated onto rice leaf sheath and images captured at 24 hpi. The periphery of the appressorium is indicated by a cyan dotted line. Line scans show Mep1-GFP fluorescence in a transverse section of the appressorium. Scale bars = 10 µm. B) Conidia were harvested from a M. oryzae transformant expressing Mep1-GFP and Bas4-RFP gene fusions and inoculated onto rice leaf sheath preparations. Images were captured at 28 hpi of invasive growth. Micrograph and line scan graphs show co-localization of Mep1-GFP and Bas4-RFP in invasive hyphae of the M. oryzae wild-type strain Guy11. Arrow indicates the area used for line scan analysis. Scale bars = 10 µm. C) Micrographs showing the localization of representative M5 effector candidates Mep2-GFP and Mep3-GFP from the 32 selected Mep proteins (Supplemental Fig. S10 and Supplemental Data Set S8) during plant infection. Images were captured at 22 to 24 hpi. Invasive hyphae are outlined by a white dotted line and individual plant cells indicated with a cyan dotted line. Short white arrows indicate localization of both Mep2-GFP and Mep3-GFP at the BIC. Scale bars = 10 µm.
Figure 6.
Figure 6.
MEP genes are highly expressed in living plant tissue during plant infection. A) Conidia were harvested from a M. oryzae transformant expressing a Mep1Δ19–74-GFP signal peptide deletion and a Mep1-RFP full-length gene fusion and inoculated onto CO39 rice leaf sheath. Images were captured at 24 hpi of invasive growth. GFP fluorescence (in green) was retained inside the invasive hyphae, while mCherry fluorescence (in magenta) was exported to the apoplast. Micrograph and line scan graphs show that the Mep1 signal peptide is required for correct protein secretion. Arrow indicates the area used for line scan analysis. Scale bars = 10 µm. B) Micrographs showing a rice plant infected by the M. oryzae wild-type strain Guy11 expressing a Mep3Δ25–145-GFP signal peptide deletion. Images were captured at 24 hpi of invasive growth. Scale bars = 10 µm. C) Micrographs showing rice plant tissue infected by the M. oryzae wild-type strain Guy11 expressing full-length MEP3, driven by its native promoter. Mep3-GFP could be observed as small puncta at the BIC. Asterisk indicates the BIC. Images were captured at 24 hpi of invasive growth. D) Micrographs showing rice CO39 infected with M. oryzae wild-type strain Guy11 expressing cytoplasmic GFP driven by the MEP3 promoter. Scale bars = 10 µm. E) Conidia were harvested from M. oryzae transformants expressing GFP driven by the promotor of Mep1p-GFP and Mep3p-GFP, respectively, and inoculated onto hydrophobic glass coverslips. Micrographs of Mep1p-GFP showed fluorescent signal in both the conidium and the appressorium, in contrast to Mep3p-GFP, which displayed little signal. Appressorium formation was observed at 20 hpi. Scale bars = 10 µm.
Figure 7.
Figure 7.
The rice plasma membrane is invaginated and accumulates at the BIC during plant infection. Laser confocal micrographs of M. oryzae expressing Mep1-mCherry colonizing epidermal leaf cells of a transgenic rice line expressing plasma membrane-localized LTi6B-GFP. Images were captured at 24 hpi (A) and 36 hpi (B). The plant plasma membrane stays intact and invaginated at the early stages of plant infection. LTi6B fluorescence accumulates at the bright BIC, indicating the BIC is a plant membrane-rich structure. The fluorescence signal from secreted Mep1-mCherry is surrounded by the fluorescence signal of the rice cell plant plasma membrane marker LTi6B-GFP as the fungus invades new cells, but the initial epidermal cell is occupied and then loses viability, and Mep1-mCherry fluorescence fills the rice cell. Arrows indicate the BICs in the invaded neighboring cells. Scale bars = 10 um.
Figure 8.
Figure 8.
Cytoplasmic Mep candidates, which accumulate at the BIC, are translocated into host cells. A) Cellular localization of GFP with an NLS driven by the TrpC promoter in M. oryzae. The fluorescence signal in the nuclei and nucleoli of conidia and the appressorium. The outline of the fungus is depicted by a white dotted line. B) Micrographs of Mep1-GFPNLS inoculated onto rice leaf sheath and captured at 28 hpi. Fluorescence could be observed in the nucleus and nucleolus of the appressorium, but not in the fungus or plant cells. C) Micrographs of AvrPia-GFPNLS and BIC-accumulating Mep effector candidates showing delivery into both the invaded host cell and unoccupied neighboring host cells. Arrows indicate plant nuclei. D) Cellular localization of Mep1-GFP in M. oryzae during biotrophic growth on epidermal rice cells. BFA was applied at 20 hpi, and 0.1% DMSO was used for the control treatment. Images were captured at 3 to 4-h posttreatment. Mep1-GFP fluorescence shows accumulation within invasive hyphae and particularly in the BIC-associated cell. E) Micrographs of M. oryzae expressing Mep2-GFP and Bas4-mCherry during biotrophic growth on epidermal rice cells. BFA treatment was used to examine the secretion of Mep2-GFP and Bas4-mCherry. Mep2-GFP fluorescence accumulated in the BIC in the presence or absence of BFA. By contrast, Bas4-mCherry fluorescence accumulated inside invasive hyphae. Scale bars = 10 µm.
Figure 9.
Figure 9.
Mep1 contributes to pathogen fitness during plant infection. A) Conidial suspensions of equal concentration (5 × 10⁴ spores mL−1) from M. oryzae Guy11, Δmep1, or Δmep1 complementation strain Δmep1-MEP1 were used to inoculate 21-d-old seedlings of the blast-susceptible cultivar CO39 and disease symptoms recorded after 5 dpi. The box plot shows the lesion density of seedlings infected with Guy11 and the Δmep1 mutant per unit area. The lower horizontal line shows the minimum value, and the upper horizontal line shows the maximum value. The lower border and upper border of the box show the lower quartile and upper quartile, respectively. The line in the box shows the median. Whiskers showing Min to Max. B–D) A relative fitness assay was carried out by mixing conidia in equal amounts (1:1) from Guy11 expressing GFP (WT-GFP) vs. Guy11 expressing mCherry (WT-mCherry), Guy11 expressing GFP (WT-GFP) vs. Δmep1 mutant expressing mCherry (Δmep1-mCherry), and Guy11 expressing GFP (WT-GFP) vs. the complemented strain of Δmep1 expressing mCherry (Δmep1-MEP1-mCherry). Spores were collected from disease lesions and used to inoculate new seedlings in the recovered proportions. B) The dot plot on the left shows the proportion of Guy11 TrpCp:GFP (WT-GFP) and the Guy11 TrpCp:mCherry (WT-mCherry) conidia recovered from each generation. Bars represent the mean ± SD of 3 replicates. The dot plot on the right shows the relative fitness of Guy11 TrpCp:mCherry. C) The dot plot on the left shows the proportion of Guy11 TrpCp:GFP (WT-GFP) and Δmep1 TrpCp:mCherry (Δmep1-mCherry) conidia recovered from each generation. The Δmep1 TrpCp:mCherry mutant was driven to near extinction in 3 generations. Bars represent the mean ± SD. The dot plot on the right shows the relative fitness of strain Δmep1 TrpCp:mCherry. D) The dot plot on the left shows the proportion of Guy11 TrpCp:GFP (WT-GFP) and the Δmep1-MEP1 TrpCp:mCherry (Δmep1-MEP1-mCherry) conidia recovered from each generation. Bars represent the mean ± SD. The dot plot on the right shows the relative fitness of the complemented Δmep1-MEP1 TrpCp:mCherry strain. Relative fitness was calculated using the equation x2(1 − x1)/x1 (1 − x2), where x1 is the initial frequency of conidia from the tested strain and x2 is the final frequency.

Comment in

References

    1. Bardou P, Mariette J, Escudié F, Djemiel C, Klopp C. Jvenn: an interactive Venn diagram viewer. BMC Bioinformatics. 2014:15(1):293. 10.1186/1471-2105-15-293 - DOI - PMC - PubMed
    1. Bjornson M, Pimprikar P, Nürnberger T, Zipfel C. The transcriptional landscape of Arabidopsis thaliana pattern-triggered immunity. Nat Plants. 2021:7(5):579–586. 10.1038/s41477-021-00874-5 - DOI - PMC - PubMed
    1. Bohnert HU, Fudal I, Dioh W, Tharreau D, Notteghem JL, Lebrun MH. A putative polyketide synthase/peptide synthetase from Magnaporthe grisea signals pathogen attack to resistant rice. Plant Cell. 2004:16(9):2499–2513. 10.1105/tpc.104.022715 - DOI - PMC - PubMed
    1. Bray NL, Pimentel H, Melsted P, Pachter L. Near-optimal probabilistic RNA-seq quantification. Nat Biotechnol. 2016:34(5):525–527. 10.1038/nbt.3519 - DOI - PubMed
    1. Cao H, Huang P, Zhang L, Shi Y, Sun D, Yan Y, Liu X, Dong B, Chen G, Snyder JH, et al. . Characterization of 47 Cys2 -His2 zinc finger proteins required for the development and pathogenicity of the rice blast fungus Magnaporthe oryzae. New Phytol. 2016:211(3):1035–1051. 10.1111/nph.13948 - DOI - PubMed

Publication types

Substances

Supplementary concepts