. 2023 May;10(13):e2206384.
doi: 10.1002/advs.202206384. Epub 2023 Feb 19.

Mechanobiological Adaptation to Hyperosmolarity Enhances Barrier Function in Human Vascular Microphysiological System

Affiliations

Mechanobiological Adaptation to Hyperosmolarity Enhances Barrier Function in Human Vascular Microphysiological System

Joon Ho Kang et al. Adv Sci (Weinh). 2023 May.

Abstract

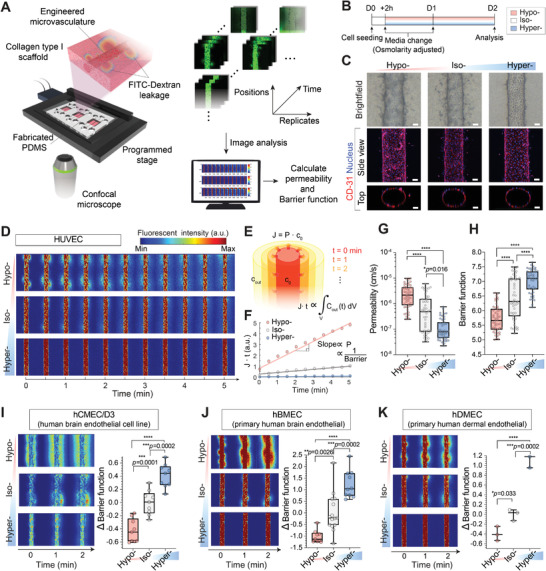
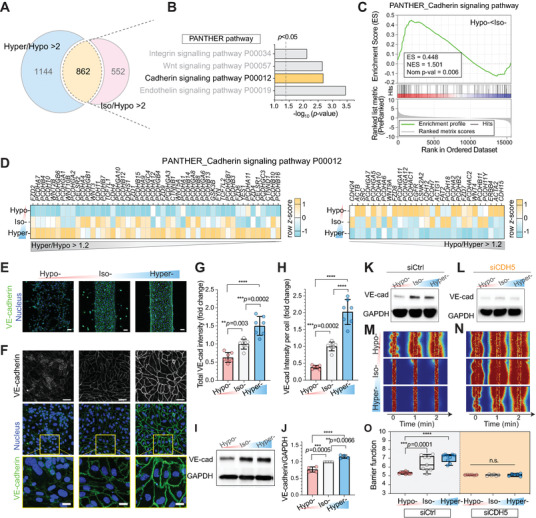
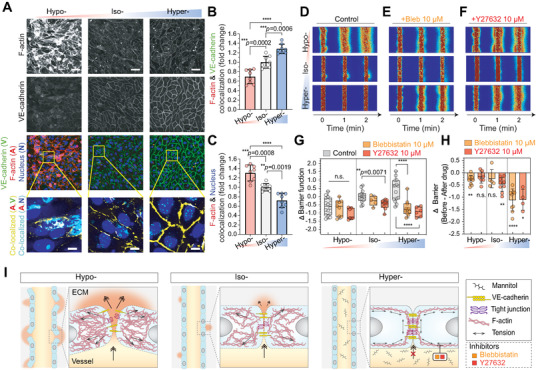
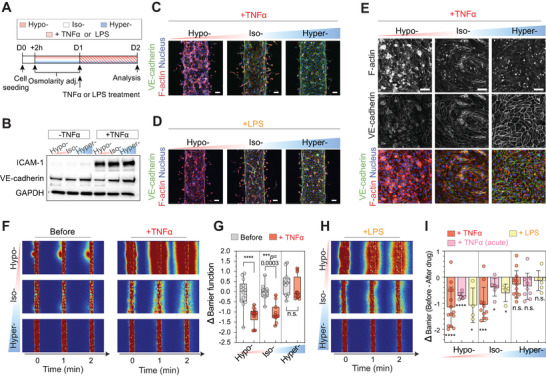
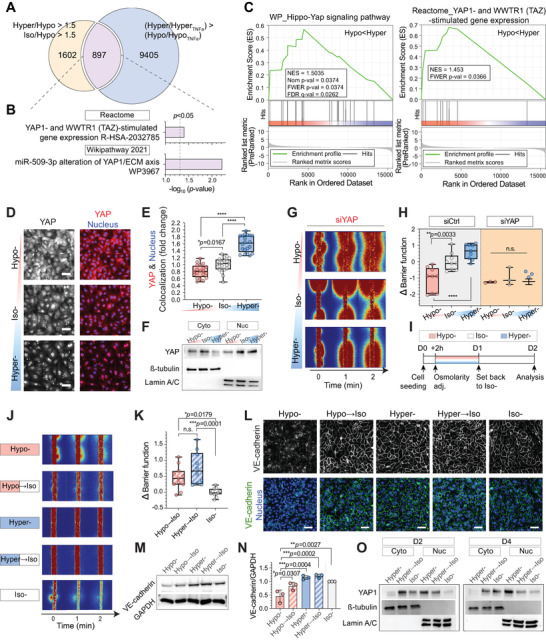
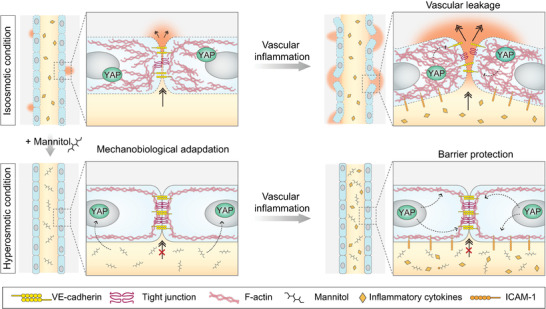
In infectious disease such as sepsis and COVID-19, blood vessel leakage treatment is critical to prevent fatal progression into multi-organ failure and ultimately death, but the existing effective therapeutic modalities that improve vascular barrier function are limited. Here, this study reports that osmolarity modulation can significantly improve vascular barrier function, even in an inflammatory condition. 3D human vascular microphysiological systems and automated permeability quantification processes for high-throughput analysis of vascular barrier function are utilized. Vascular barrier function is enhanced by >7-folds with 24-48 h hyperosmotic exposure (time window of emergency care; >500 mOsm L-1 ) but is disrupted after hypo-osmotic exposure (<200 mOsm L-1 ). By integrating genetic and protein level analysis, it is shown that hyperosmolarity upregulates vascular endothelial-cadherin, cortical F-actin, and cell-cell junction tension, indicating that hyperosmotic adaptation mechanically stabilizes the vascular barrier. Importantly, improved vascular barrier function following hyperosmotic exposure is maintained even after chronic exposure to proinflammatory cytokines and iso-osmotic recovery via Yes-associated protein signaling pathways. This study suggests that osmolarity modulation may be a unique therapeutic strategy to proactively prevent infectious disease progression into severe stages via vascular barrier function protection.

Keywords: 3D human vascular microphysiological system; Yes-associated protein (YAP); hyperosmolarity; inflammation; mechanobiology; vascular barrier function.


Conflict of interest statement

The authors declare no conflict of interest.

Figures

Figure 1
Figure 1
Continuous hyperosmolarity exposure enhances the vascular barrier function in human microvasculature‐on‐chips. A) Human microvessel engineering and barrier function assay platform. Endothelial cells are cultured onto a cylindrical collagen scaffold. The barrier functions of engineered microvessels are then quantified by time‐course imaging of fluorescein isothiocyanate (FITC)‐dextran leakage out from the vessel lumen. B) Experimental timeline for testing the effect of osmotic exposure on microvessel barrier function. Otherwise noted, all images and data represent microvessels 2 d after osmolarity adjustments (D2). C) Representative bright‐field images (top) and immunostaining of CD31 images (bottom; side and top view) of osmolarity (hypo‐, iso‐, or hyperosmolarity) adapted human umbilical vein endothelial cell (HUVEC) 3D engineered microvessels. Cell nuclei were counterstained with DAPI. For iso‐osmotic conditions, microvessels are cultured in regular endothelial culture media. Note that cylindrical lumen (hollow channel) is created inside the vessels. Scale bars, 50 µm. D) Representative fluorescent images of 4 kDa FITC‐dextran leakage from osmolarity‐adapted HUVEC engineered microvessels. Three images along the vessel's vertical positions were acquired per each microvessel. t = 0 min images were taken immediately after the lumen was filled with 4 kDa FITC dextran. E,F) Schematic and representative dextran flux graph as a function of time from osmolarity‐adapted HUVEC 3D engineered microvessels. Permeability (and 1/Barrier function; values > 0) is quantified from the slope of the Jt versus t graph. G,H) Permeability and barrier function of osmolarity‐adapted HUVEC 3D engineered microvessels at D2 (n = 48, 50, and 47 engineered microvessels for hypo‐, iso‐, and hyperosmotic conditions, respectively). I–K) Representative fluorescent images of 4 kDa FITC‐dextran leakage (left) and barrier function (right) of osmolarity‐adapted hCMEC/D3, hBMEC, and hDMEC 3D engineered microvessels (hCMEC/D3: n = 9, 9, and 9; hBMEC: n = 9, 15, and 10; hDMEC: n = 3, 3, and 3, for hypo‐, iso‐ and hyper‐, respectively). Box and whisker plots in panel (G)–(K) represent median value (horizontal bars), 25–75 percentiles (box edges), and minimum to maximum values (whiskers). P‐values were obtained using one‐way ANOVA followed by Tukey's HSD post hoc test. n.s.: not significant, ****P < 0.0001.
Figure 2
Figure 2
Adherent junction drives osmolarity‐driven barrier function change. A) Number of genes that are upregulated by more than twofolds in hyper‐ (Hyper/Hypo > 2) and iso‐ (Iso/Hypo > 2) compared to hypo‐osmotic conditions. B) Gene ontology (GO) analysis of the 862 intersected genes. Significantly enriched gene sets were selected from the PANTHER pathway. The dashed vertical lines indicate significance at p < 0.05. C) Gene set enrichment analysis (GSEA) results showing significant enrichment of the gene sets, “Cadherin signaling pathway” in Reactome from the Molecular Signatures Database (MSigDB) in iso‐ compared to hypo‐osmotic conditions. Red and blue shading indicate high and low log2‐ranked values comparing iso‐ to hypo‐osmotic conditions, respectively. ES: enrichment score, NES: normalized enrichment score, and Nom p‐value: nominal p‐value. D) Heatmap visualization of gene expression profiles of PANTHER_Cadherin signaling pathway (P00012). Genes over 1.2‐fold up‐ (Hyper/Hypo > 1.2) and downregulated (Hypo/Hyper > 1.2) in hyper‐ compared to hypo‐osmotic conditions are displayed based on the z‐score. E,F) Representative immunostaining of VE‐cadherin in HUVEC 3D engineered microvessels and 2.5D monolayer (see the Experimental Section) 2 d after corresponding osmolarity adjustment (hypo‐, iso‐, and hyperosmolarity at D2; see Figure 1B for detailed timelines). Cell nuclei were counterstained with DAPI. Scale bars, 50 µm. Inset: zoom‐in view of cell junctions. Scale bars, 10 µm. G,H) Total VE‐cadherin intensity and intensity per cell from immunostained images relative to iso‐osmotic condition. Mean ± S.D. n = 7 images from three biological replicates. I) Representative western blot displaying VE‐cadherin levels of 2.5D HUVEC monolayers at D2. GAPDH was used as a loading control. J) Western blot‐based quantification of VE‐cadherin levels relative to iso‐osmolarity conditions. VE‐cadherin levels were normalized by GAPDH level. Mean ± S.D. N = 4 independent experiments. K,L) Western blot displaying VE‐cadherin levels of osmolarity‐adapted control siRNA (siCtrl) and siCDH5‐treated HUVEC cells. GAPDH was used as the loading control. M,N) Representative fluorescent images of 4 kDa FITC‐dextran leakage from siCtrl and siCDH5‐treated HUVEC 3D engineered microvessels after osmolarity adaptation. Cells in culture were treated with siCtrl or siCDH5 for 2 d before cell seeding. See Figure S13 (Supporting Information) for detailed timelines. t = 0 min images were taken immediately after the lumen was filled with FITC‐dextran solutions. O) Barrier function of siCtrl (left) and siCDH5 (right) treated HUVEC 3D engineered microvessels after osmolarity adaptation (siCtrl: n = 9, siCDH5: n = 6 microvessels for each osmolarity condition). Box and whisker plots represent median value (horizontal bars), 25–75 percentiles (box edges), and minimum to maximum values (whiskers). For panels (G), (H), (J), and (O), P‐values were obtained using one‐way ANOVA followed by Tukey's HSD post hoc test. n.s: not significant, ****P < 0.0001.
Figure 3
Figure 3
Cell–cell junction localization of F‐actin and actomyosin‐dependent barrier function imply mechanobiological adaptation of microvessels during osmolarity exposure. A) Representative immunostaining of F‐actin and VE‐Cadherin in HUVEC 2.5D monolayer 2 d after corresponding osmotic adjustment (hypo‐, iso‐, or hyperosmotic condition at D2; see Figure 1B for detailed timelines). Scale bars, 50 µm. Cell nuclei were counterstained with DAPI. Inset: zoom‐in view of F‐actin and VE‐cadherin (yellow) and actin and nucleus (cyan) colocalized pixels. Cell nuclei were counterstained with DAPI. Scale bars, 10 µm. B,C) Fraction of F‐Actin & VE‐cadherin and F‐Actin & Nucleus colocalized pixels from the immunostained images. Mean ± S.D. n = 8 images from five biological replicates. See Figure S15 (Supporting Information) for detailed processing steps. D–F) Representative fluorescent images of 4 kDa FITC‐dextran leakage from osmolarity‐adapted HUVEC 3D engineered microvessels without treatment, 30 min after 10 × 10−6 m Blebbistatin, and 10 × 10−6 m Y‐27632 treatment. t = 0 min images were taken immediately after the lumen was filled with FITC‐dextran solutions. G,H) Barrier function changes, relative to iso‐osmotic controls or before drug treatments, in osmolarity‐adapted HUVEC 3D engineered microvessels 30 min after 10 × 10−6 m Blebbistatin and 10 × 10−6 m Y‐27632 treatment (Control: n = 16, 14, and 13 microvessels for hypo‐, iso‐, and hyper‐, respectively; Blebbistatin: n = 9, 5, and 9 microvessels for hypo‐, iso‐, and hyper‐, respectively; Y‐27632: n = 7, 9, and 4 microvessels for hypo‐, iso‐, and hyper‐osmotic conditions, respectively). In panel (G), box and whisker plots represent median value (horizontal bars), 25–75 percentiles (box edges), and minimum to maximum values (whiskers). In panel (H), data represent Mean ± S.D. I) Proposed mechanism of osmolarity‐driven actin cytoskeletal change and its consequent effect on the vascular barrier function. For panels (B), (C), and (G), P‐values were obtained using one‐way ANOVA followed by Tukey's HSD post hoc test. In panel (H), P‐values obtained by two‐tailed, one‐sample t‐test compared to 0 (P‐values from left to right: 0.0013, 0.086, 0.22, 0.0012, <0.0001, 0.013). n.s: not significant, *P < 0.05, **P < 0.01, ***P < 0.001, ****P < 0.0001.
Figure 4
Figure 4
Hyperosmolarity‐adapted microvessels display significantly improved barrier protection under acute and chronic inflammation. A) Experimental timeline for testing the barrier protective effect of osmolarity‐adapted HUVEC 3D engineered microvessels following tumor necrosis factor alpha (TNFα) or lipopolysaccharides (LPS) induced vascular inflammations. Note that osmolarity was persistently maintained during inflammation. B) Western blot displaying ICAM‐1 (an inflammatory marker), and VE‐cadherin levels of osmolarity‐adapted (hypo‐, iso‐, or hyperosmotic) 2.5D HUVEC monolayers 24 h after 0 or 5 ng mL−1 TNFα treatment. GAPDH was used as a loading control. C–E) Representative immunostaining of VE‐cadherin and F‐actin in osmolarity‐adapted HUVEC 3D engineered microvessels 24 h after 5 ng mL−1 TNFα, 24 h after 100 ng mL−1 LPS treatment, and HUVEC 2.5D monolayer 24 h after 5 ng mL−1 TNFα treatment. Cell nuclei were counterstained with DAPI. Scale bars, 50 µm. F) Representative fluorescent images of 4 kDa FITC‐dextran leakage from osmolarity adjusted HUVEC 3D engineered microvessels before (left) and 24 h after 5 ng mL−1 TNFα (right) treatment. t = 0 min images were taken immediately after the lumen was filled with 4 kDa FITC dextran. G) Barrier function before and 24 h after 5 ng mL−1 TNFα treated microvessels with corresponding osmolarity adjustment. Data reflect change relative to iso‐osmotic conditions, before TNFα treatment. n = 14, 11, and 12 microvessels for hypo‐, iso‐, and hyperosmolarity, respectively. Box and whisker plots in panel (G) represent median value (horizontal bars), 25–75 percentiles (box edges), and minimum to maximum values (whiskers). P‐values were obtained using one‐way ANOVA followed by Tukey's HSD post hoc test. H) Representative fluorescent images of 4 kDa FITC‐dextran leakage from osmolarity‐adapted HUVEC 3D engineered microvessels 24 h after 100 ng mL−1 LPS treatment. t = 0 min images were taken immediately after the lumen was filled with 4 kDa FITC dextran. I) Barrier function changes of osmolarity‐adapted HUVEC 3D engineered microvessels 24 h after 5 ng mL−1 TNFα (n = 14, 11, and 12 microvessels for hypo‐, iso‐, and hyperosmotic conditions, respectively), 24 h after 100 ng mL−1 LPS (n = 4, 4, and 6 microvessels for hypo‐, iso‐, and hyperosmotic conditions, respectively), and 4 h after 100 ng mL−1 TNFα (acute; n = 6, 6, and 9 microvessels for hypo‐, iso‐, and hyperosmotic conditions, respectively). Data represent mean ± S.D. P‐values obtained by two‐tailed, one‐sample t‐test compared to 0 (P‐values from left to right: <0.0001, <0.0001, 0.0471, 0.0003, 0.037, 0.036, 0.092, 0.073, 0.42). For panels (G) and (I), n.s: not significant, *P < 0.05, **P < 0.01, ***P < 0.001, ****P < 0.0001.
Figure 5
Figure 5
Hyperosmolarity‐induced Yes‐associated protein (YAP) nuclear localization and enhanced barrier integrity are sustained after iso‐osmotic recovery. A) Number of genes that are upregulated by more than 1.5‐folds in hyper‐ and iso‐ compared to hypo‐ (Hyper/Hypo > 1.5 and Iso/Hypo > 1.5) and that are highly maintained after TNFα treatment in hyper‐, but not in hypo‐osmotic conditions (Hyper/HyperTNFα > Hypo/HypoTNFα ). B) Gene ontology (GO) analysis for the 897 intersected genes from “Reactome” and “Wikipathway 2021.” The dashed vertical lines indicate significance at p < 0.05. C) Gene set enrichment analysis (GSEA) results showing significant enrichment of the gene sets, “Hippo‐Yap signaling pathway” in WikiPathways (WP) and “YAP1‐ and WWTR1 (TAZ)‐stimulated gene expression” in Reactome from the Molecular Signatures Database (MSigDB) in hyper‐ compared to hypo‐osmotic conditions. Red and blue shading indicate high and low log2‐ranked values comparing Hyper/Hypo. NES; normalized enrichment score, Nom p‐value; nominal p‐value, FWER; familywise‐error rate, FDR; false discovery rate. D) Representative immunostaining of YAP in HUVEC 2.5D monolayers 1 d after corresponding osmotic adjustment (hypo‐, iso‐, or hyperosmotic condition at D1; see Figure 1B for detailed timelines). Cell nuclei were counterstained with DAPI. Scale bars: 50 µm. E) Quantification of YAP and DAPI colocalization. n = 20 images from two independent experiments. F) Expression of cytoplasmic and nucleus YAP proteins in HUVEC 2.5D monolayers after osmolarity adaptation. ß‐tubulin and Lamin A/C were used as a loading control for cytoplasmic and nuclear proteins, respectively. G) Representative fluorescent images of 4 kDa FITC‐dextran leakage from osmolarity‐adapted HUVEC 3D engineered microvessels after siYAP treatment. Cells in culture were treated with siYAP 2 d before cell seeding. See Figure S13 (Supporting Information) for detailed timelines. H) Barrier function changes, relative to siCtrl iso‐osmotic conditions, in osmolarity‐adapted siCtrl (left; same as Figure 2G–K) and siCDH5 (right) treated HUVEC 3D engineered microvessels after osmolarity adaptation. I) Experimental timeline for testing the barrier function change of osmolarity‐adapted HUVEC 3D engineered microvessels following iso‐osmotic recovery (i.e., Hypo → Iso, Hyper → Iso). J) Representative fluorescent images of 4 kDa FITC‐dextran leakage from osmolarity‐adapted and iso‐osmotic recovered HUVEC 3D engineered microvessels. t = 0 min images were taken immediately after the lumen was filled with 4 kDa FITC‐dextran. K) Barrier function changes of osmolarity‐adapted HUVEC 3D engineered microvessels following iso‐osmotic recovery (i.e., Hypo → Iso, Hyper → Iso). Data reflect change relative to iso‐osmotic conditions at D2 (Iso‐). L) Representative immunostaining of VE‐cadherin in osmolarity‐adapted and iso‐osmotic recovered HUVEC 2.5D monolayers. Cell nuclei were counterstained with DAPI. Scale bars: 50 µm. M,N) Western blot images of total VE‐cadherin and quantifications of VE‐cadherin compared to GAPDH in osmolarity‐adapted and iso‐osmotic recovered HUVEC 2.5D monolayers. GAPDH was used as a loading control. Data represent mean ± S.D. n = 3 biological replicates. O) Expression of cytoplasmic and nuclear YAP in osmolarity‐adapted and iso‐osmotic recovered HUVEC 2.5D monolayers at D2 (left) and D4 (right). Note that nuclear YAP increase observed in hyper → iso samples at D2 finally recovers at D4. ß‐tubulin and Lamin A/C were used as a loading control for cytoplasmic and nuclear proteins, respectively. For panels (E), (H), and (K) box and whisker plots represent median value (horizontal bars), 25–75 percentiles (box edges), and minimum to maximum values (whiskers). For panels (E), (H), (K), and (N) P‐values were obtained using one‐way ANOVA followed by Tukey's HSD post hoc test. n.s: not significant, ****P < 0.0001.
Figure 6
Figure 6
Proposed mechanism of the Yes‐associated protein (YAP)‐mediated mechanoprotective effect of hyperosmolarity in engineered human microvessels.

Similar articles

Cited by

References

    1. a) Polacheck W. J., Kutys M. L., Yang J., Eyckmans J., Wu Y., Vasavada H., Hirschi K. K., Chen C. S., Nature 2017, 552, 258; - PMC - PubMed
    2. b) Yazdani S., Jaldin‐Fincati J. R., Pereira R. V. S., Klip A., Traffic 2019, 20, 390. - PubMed
    1. Prescott H. C., Osterholzer J. J., Langa K. M., Angus D. C., Iwashyna T. J., BMJ 2016, 353, i2375. - PMC - PubMed
    1. Dolmatova E. V., Wang K., Mandavilli R., Griendling K. K., Cardiovasc. Res. 2021, 117, 60. - PMC - PubMed
    1. Aird W. C., Blood 2003, 101, 3765. - PubMed
    1. a) Xiao F., Wang D., Kong L., Li M., Feng Z., Shuai B., Wang L., Wei Y., Li H., Wu S., Tan C., Zhao H., Hu X., Liu J., Kang Y., Liao X., Zhou Y., Zhang W., Nat. Commun. 2018, 9, 2644; - PMC - PubMed
    2. b) Fink M. P., Warren H. S., Nat. Rev. Drug Discovery 2014, 13, 741; - PubMed
    3. c) Han S., Lee S. J., Kim K. E., Lee H. S., Oh N., Park I., Ko E., Oh S. J., Lee Y. S., Kim D., Lee S., Lee D. H., Lee K. H., Chae S. Y., Lee J. H., Kim S. J., Kim H. C., Kim S., Kim S. H., Kim C., Nakaoka Y., He Y., Augustin H. G., Hu J., Song P. H., Kim Y. I., Kim P., Kim I., Koh G. Y., Sci. Transl. Med. 2016, 8, 335ra55. - PubMed

Publication types

LinkOut - more resources